4378
Three-Dimensional, Free-Breathing Magnetic Resonance Fingerprinting for Whole-Liver Coverage1Department of Radiology, Case Western Reserve University, Cleveland, OH, United States, 2Department of Radiology, University of North Carolina at Chapel Hill, Chapel Hill, NC, United States, 3Department of Biomedical Engineering, Case Western Reserve University, Cleveland, OH, United States
Synopsis
In this proof-of-concept study, a 3D free-breathing abdominal MR Fingerprinting sequence is applied to the abdomen. Full-liver coverage with spatial resolution of 1.6×1.6×5 mm3 is attained in 8 minute 40 seconds.
Introduction
Magnetic resonance fingerprinting (MRF) allows for rapid, simultaneous quantitative mapping of multiple tissue properties1. Performing an MRF exam in the abdomen is challenging because respiratory motion severely degrades the quality of tissue property maps. Breath-holding exams minimize respiratory motion2, but limit the duration of the exam and, thus, volumetric coverage. Therefore, a free-breathing exam is preferable. Previously, a 3D free-breathing exam3 was proposed, which yielded 24 mm of coverage in approximately 8 minutes. In this work, we have reduced the effective scan time per slice to increase volumetric coverage to 180 mm, allowing for a whole liver MRF acquisition in 8 minutes, 40 seconds.Methods
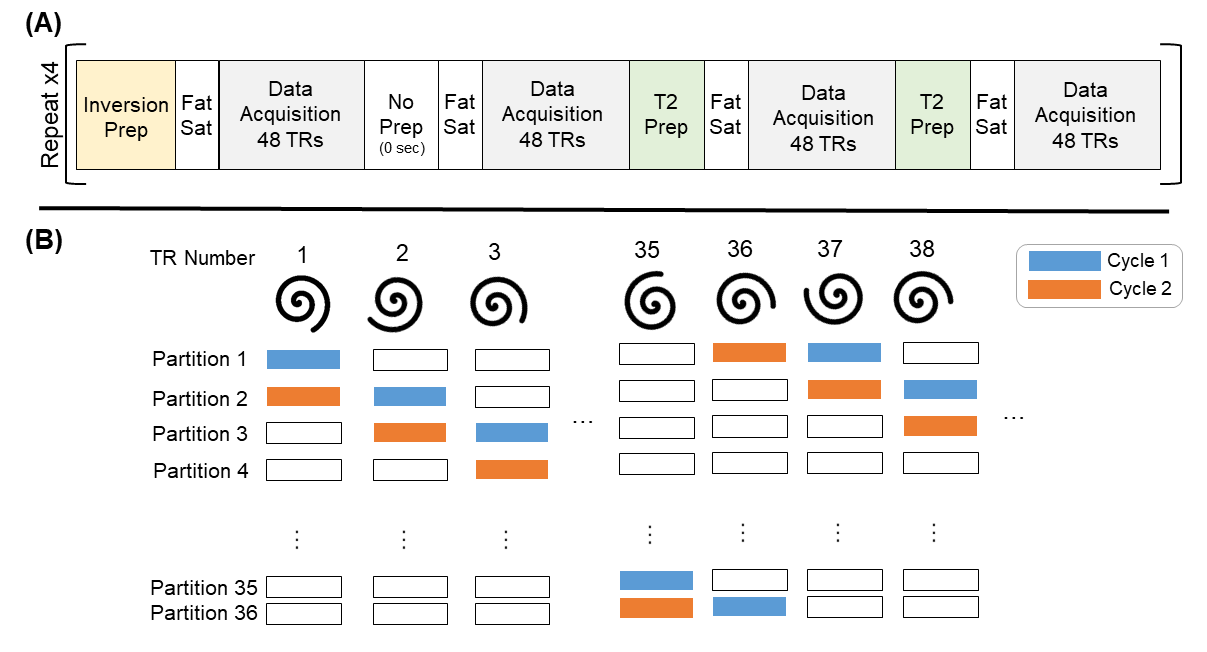
A block diagram of the 3D free-breathing MRF sequence is shown in Figure 1. The MRF sequence was divided into 36 cycles, each containing 16 blocks. One cycle was acquired for each partition in z, but the partition number was incremented with each TR. Each cycle was divided into 16 blocks of 48 TRs, with no pause between blocks. Flip angles varied from 4-10°. A uniform density spiral with an acceleration factor of 48 was played during each FISP readout. In each cycle, 768 undersampled volumes were acquired. A 2 second pause followed each cycle. The preparation pulse at the beginning of each block alternated between a non-selective inversion pulse (TI = 21/100/250/400 ms), no preparation, and an MLEV composite T2 preparation4 (TE = 40/80 ms). A fat saturation pulse was applied after the preparation pulse. Total scan time for 36 partitions was 4 minutes, 20 seconds. The following scan parameters were used: TE/TR = 2.3/8 ms, FOV = 400×400×180 mm3, Partial Fourier = 6/8, Matrix Size = 256×256×36, Resolution = 1.6×1.6×5 mm3. The sequence was executed twice to increase the amount of data in the selected respiratory bin.
After
data acquisition, the respiratory phase was estimated using the signal acquired
from respiratory bellows. Data in the expiration phase, approximately the
lowest 20% of the respiratory waveform, was retained. To
improve the quality of the property maps, the remaining data was selected from
the run with the respiratory state closest to expiration at a given time point.
A dictionary with T1 values of [60:10:2000, 2020:20:3000, 3050:50:3500,
4000:500:5000] ms and T2 values of [10:2:100, 105:5:200, 210:10:300, 350:50:500]
ms was calculated using Bloch simulations. Due to the short pause between
cycles the dictionary simulation was repeated three times to reach the steady
state signal. To speed up reconstruction, SVD compression5 was applied to
the dictionary and k-space data. The 3D NUFFT6 with density compensation and
a two-step low-rank model-based reconstruction method7 was used to calculate
the parameter maps. All experiments were
performed on a Seimens 3.0T Skyra scanner with an 18-channel body coil. The
sequence was tested on a healthy volunteer under IRB approval.
Results
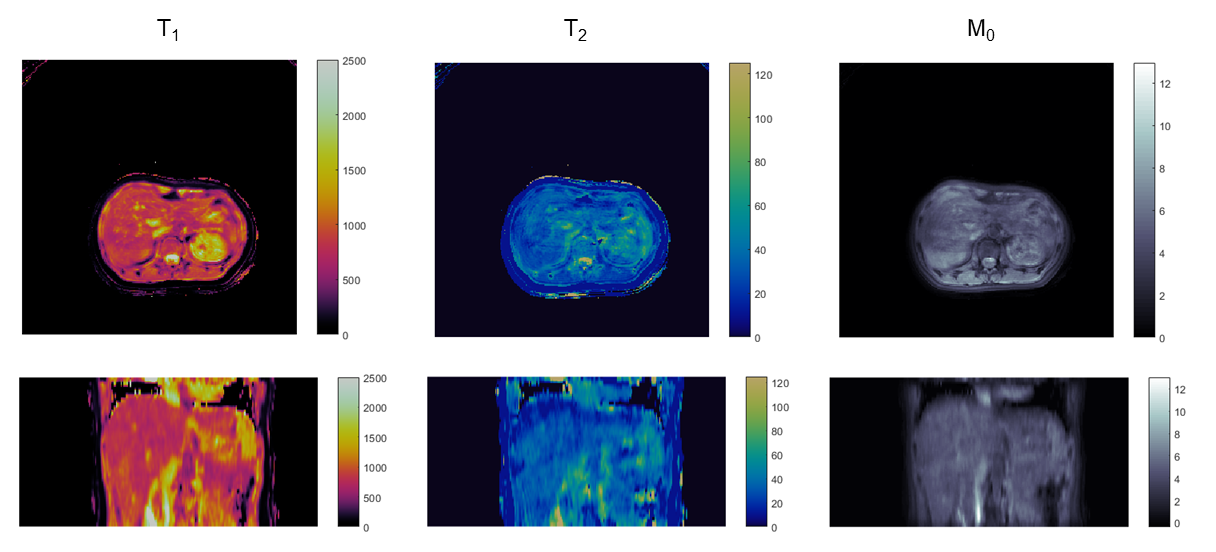
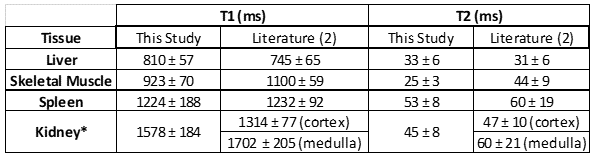
Obtained maps are shown in Figure 2. 53% of the data acquired over two repetitions of the sequence was accepted by the navigator for reconstruction. Mean and standard deviations for abdominal tissues are listed in Table 1.Discussion
We present preliminary results from a 3D free-breathing abdominal MRF exam for whole liver imaging. The reduced acquisition time for this sequence is an important step towards clinically feasible quantitative abdominal imaging. However, while quantitative measurements agree with published literature, the maps depicted in Fig. 2 show blurring due to motion, indicating a need for better estimation of motion states. While bellows were used for this study, estimation of respiratory motion states using an image-based navigator would be more reliable than the respiratory bellows. In this acquisition there is no real-time feedback as to how much of the acquired data is accepted by the navigator. Future studies will focus on determining the minimum data requirements and how to ensure that limit is met. Integrating simultaneous multi-slice acquisitions could further improve volumetric coverage.Acknowledgements
Siemens Healthineers and NIH grant 5R01CA208236References
1. Ma D, Gulani V, Seiberlich N, Liu K, Sunshine J, Duerk J, Griswold M. Magnetic resonance fingerprinting. Nature 2013;495:187-192.
2. Chen Y, Jiang Y, Pahwa S, Ma D, Lu L, Twieg M, Wright K, Seiberlich N, Griswold M, Gulani V. MR Fingerprinting for Rapid Quantitative Abdominal Imaging. Radiology 2016;279:278-286.
3. Chen Y, Mehta B, Hamilton J, Ma D, Seiberlich N, Griswold M, Gulani V. Free-Breathing 3D Abdominal Magnetic Resonance Fingerprinting Using Navigators. In Proc ISMRM 2016;716.
4. Brittain J, Hu B, Wright G, Meyer C, Macovski A. Coronary angiography with magnetization-prepared T2 contrast. Magn Reson Med 1995;33:689-696.
5. McGivney D, Pierre E, Ma D, Jiang Y, Saybasili H, Gulani V, Griswold M. SVD Compression for Magnetic Resonance Fingerprinting in the Time Domain. IEEE Trans Med Imaging 2014;33:2311-2322.
6. Jeffrey A Fessler, "Michigan Image Reconstruction Toolbox," available at https://web.eecs.umich.edu/~fessler/code/, downloaded 02 February 2018.
7. Pierre E, Griswold MA, Connelly A. Fast Analytical Solution for Extreme Unaliasing of MR Fingerprinting Image Series. In Proc ISMRM 2017;1353.
Figures