4377
Mapping T1, T2, and proton density fat fraction of the liver using MR Fingerprinting with three-point DIXON and 6-peak fat model1Department of Radiology, University of Yamanashi, Chuo, Japan
Synopsis
An MR Fingerprinting (MRF) simultaneously combining the three-point DIXON (3P-DIXON) method for the fatty liver was proposed. The MRF-FISP sequence with multi-TR/TE/flip angle was developed. The six-peak fat model was used to calculate a dictionary for the MRF. Template matching using the acquired signal evolutions and the rough fat fraction map estimated by 3P-DIXON provided quantification of T1, T2, and
Introduction
Quantitative mapping of T1, T2, and fat fraction for the liver is a promising approach to characterize and evaluate the liver lesion and function1. In the case of the abdominal mapping, a faster quantitative method is highly required to avoid motion effect of organs. Chen et al. successfully demonstrated the abdominal MR Fingerprinting2. In spite of its promising results, it is still challenging to achieve MRF for the fatty liver because the reconstruction of MRF is generally implemented with an assumption of the single component composition. Recently, MRF approach with water/fat separation with a single-peak model has been proposed3,4. To obtain further accurate quantification, multi-peak fat model5 is required for the dictionary, making it difficult to perform the stable matching of MRF. In this study, we developed the MRF-based approach using fast imaging with steady-state precession (MRF-FISP) sequence6 with a 6-peak fat model and the 3-point DIXON (3P-DIXON) method7.Materials & Methods
ACQUISITION:
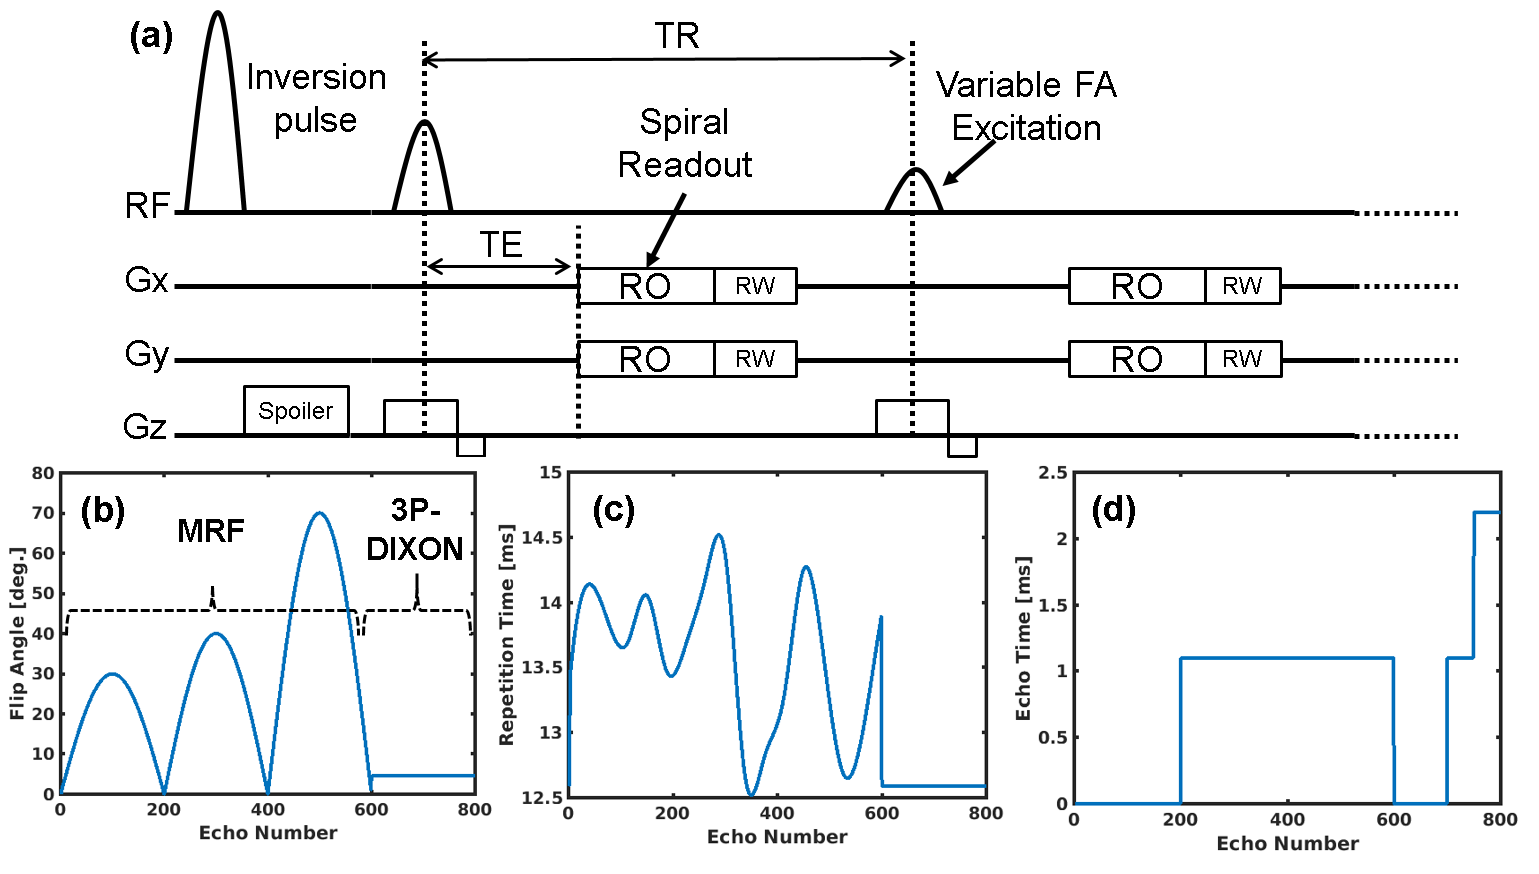
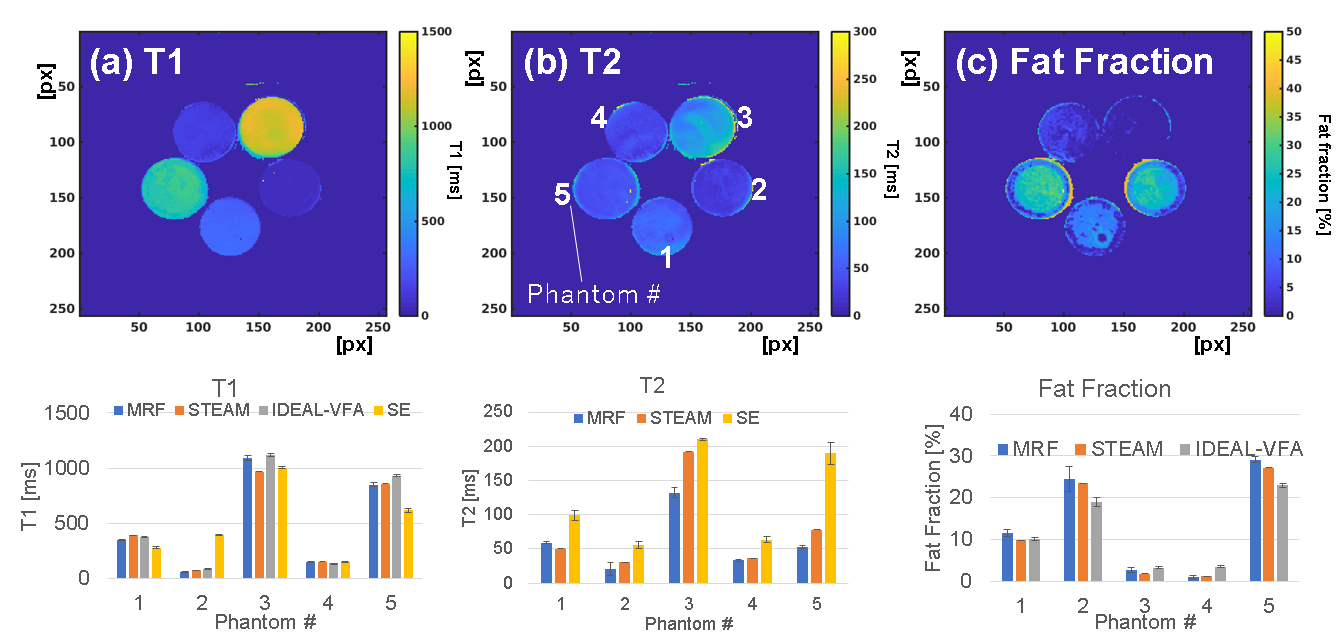
The MRF-FISP sequence with 800 acquisition using spiral readout (2048 sampling point with dwell time of 2 microseconds) was used. The spiral trajectory with zero-moment compensated rotates 31 degrees every repetition. Variable flip angles (Fig .1 (b)) and TRs (Fig .1 (c)) were generated based on sinusoidal curves and a Perlin noise approach. TEs of 2.2 and 3.3 ms were used for the first 200 and the subsequent 400 echoes, respectively. The rest of 200 echoes were acquired with fixed FA (5°) and TR (11 ms) and variable TE (1.1, 2.2, and 3.3 ms) for the 3P-DIXON reconstruction. The scan time was 11 second, which is acceptable for one breath-hold acquisition. The phantom and volunteer studies were performed using 3 tesla clinical MRI (Discovery MR750, GE Healthcare) with 32-ch torso body coil. The phantom consists of 5 acrylic tubes with varying concentration of gadolinium and agarose.
DICTIONARY:
A dictionary containing 230600 signal evolutions was calculated. The signal evolution in the liver can be expressed as a linear combination of water and fat with six-peak model components as below.
$$$S(T_1, T_2) = (1-\alpha)W(T_1, T_2) + \alpha \sum_{i=1}^n {F_i e^{-j \phi_i t}},$$$
where α is the fat fraction, W is the signals of water, Fi and Φi are the signal and off-resonance frequency for ith fat peak. The coefficients and off-resonance in our study were adopted from a literature which introduced 6-peak fat model8. The dictionary contained possible T1 of water (20~2000 ms), T2 of water (10~500 ms), B1 (80%-110%), and fat fraction (0-100 %) for the liver. Fixed T1 and T2 for the fat were used, that were measured in peanuts oil using multi-TR/TE STEAM. To accelerate the signal matching, the dictionary was compressed using the SVD approach9.
RECONSTRUCTION:
The signal matching was achieved using the simple template matching combining with a rough fat fraction map derived using the 3P-DIXON. Each echo was reconstructed using the non-uniform Fourier transform with parallel imaging. The signal evolutions, which was projected on to SVD space, was matched to the compressed dictionary. As describe in Fig. 2, the matching was performed using the dictionary which has fat fractions around the roughly estimated value (±5 %). For the comparison, quantitative values of T1, T2, and fat fraction were measured using multi-TR/TE STEAM10 , IDEAL-IQ with variable flip angles (IDEAL-VFA)11, and multi-echo/IR-spin echo (SE) sequences. The voxel for the STEAM was placed on the right lobe.
Results
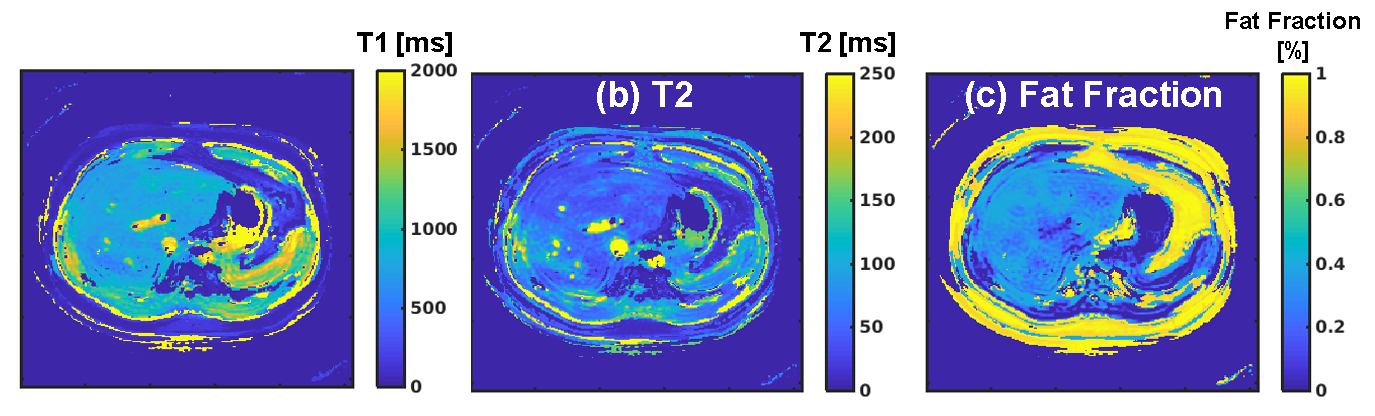
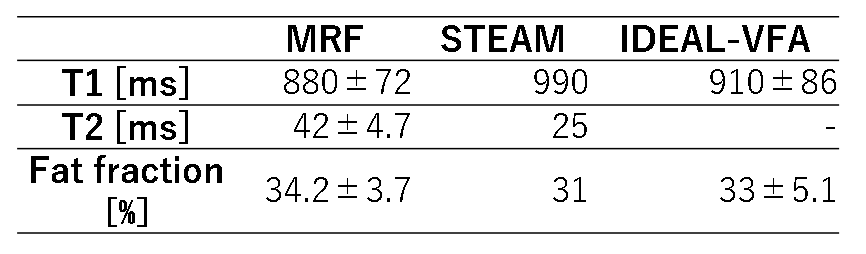
Measured quantitative maps and values using the proposed method were shown in Fig .3. T1 and fat fraction were almost agreed with those of STEAM and IDEAL-VFA, although T2 measured with MRF was underestimated compared to the conventional methods. Fig. 4 shows T1, T2, and fat fraction maps of the volunteer. As shown in Tab.1, the quantitative values of right robe agreed with those measured with STEAM and IDEAL-VFA.Discussion
The quantitative maps measured using the SE method implied that T1 and T2 were biased by the fat components. On the other hands, the proposed approach enabled to obtain relatively accurate quantitative values. To improve the accuracy of T2 mapping, the optimization of the acquisition sequence and reconstruction such as off-resonance correction will be required12. In this study, we used the assumption that the fat components have fixed T1 and T2. However, the relaxation time for the fat may slightly change depending on the chemical environment. Further improvement of fat fraction estimation will be possible by using an additional dictionary for the fat.Conclusion
MR fingerprinting approach with the 3P-DIXON for the liver was proposed. The acquired signal evolutions were matched to the dictionary calculated using multi-peak fat model. Phantom and volunteer studies demonstrated the feasibility of our method.Acknowledgements
The multi-TR/TE STEAM sequence used in this study was provided by Dr. Gavin Hamilton at University of California San Diego.
This study was funded by GE Healthcare Japan (Hino, Japan).
References
[1] Reeder, Scott B., and Claude B. Sirlin. "Quantification of liver fat with magnetic resonance imaging." Magnetic Resonance Imaging Clinics 18.3 (2010): 337-357.
[2] Chen, Yong, et al. "MR fingerprinting for rapid quantitative abdominal imaging." Radiology 279.1 (2016): 278-286.
[3] Koolstra , Kirsten, et al. “Water-Fat Separation in Spiral Magnetic Resonance Fingerprinting using Conjugate Phase Reconstruction.” Proc. ISMRM 2018: 0681
[4] Ostenson, Jason, et al. “Fat Signal Fraction Determination Using MR Fingerprinting”. Proc. ISMRM 2017: 0134
[5] Hines, Catherine DG, et al. "T1 independent, T2* corrected chemical shift based fat–water separation with multi‐peak fat spectral modeling is an accurate and precise measure of hepatic steatosis." Journal of magnetic resonance imaging33.4 (2011): 873-881..
[6] Jiang, Yun, et al. "MR fingerprinting using fast imaging with steady state precession (FISP) with spiral readout." Magnetic resonance in medicine 74.6 (2015): 1621-1631.
[7] Hardy, Peter A., R. Scott Hinks, and Jean A. Tkach. "Separation of fat and water in fast spin‐echo MR imaging with the three‐point Dixon technique." Journal of Magnetic Resonance Imaging 5.2 (1995): 181-185.
[8] Yu, Huanzhou, et al. "Multiecho water‐fat separation and simultaneous R estimation with multifrequency fat spectrum modeling." Magnetic Resonance in Medicine: An Official Journal of the International Society for Magnetic Resonance in Medicine 60.5 (2008): 1122-1134.
[9] McGivney, Debra F., et al. "SVD compression for magnetic resonance fingerprinting in the time domain." IEEE transactions on medical imaging 33.12 (2014): 2311-2322.
[10] Hamilton, Gavin, et al. "In vivo breath‐hold 1H MRS simultaneous estimation of liver proton density fat fraction, and T1 and T2 of water and fat, with a multi‐TR, multi‐TE sequence." Journal of Magnetic Resonance Imaging 42.6 (2015): 1538-1543.
[11] Tamada, Daiki, et al. "Multiparameter estimation using multi‐echo spoiled gradient echo with variable flip angles and multicontrast compressed sensing." Magnetic resonance in medicine (2018).
[12] Ostenson J et al. “Multi-Frequency Interpolation in Spiral Magnetic Resonance Fingerprinting for Correction of Off-Resonance Blurring.”, Magnetic Resonance Imaging. 2017;41: 63–72.
Figures