4376
Fat/Water Separation and T1 and T2 Quantification Using MRF with a Rosette Trajectory in the Heart and Liver1Department of Biomedical Engineering, Case Western Reserve University, Cleveland, OH, United States, 2Department of Radiology, University Hospitals Cleveland Medical Center, Cleveland, OH, United States
Synopsis
Cardiac Magnetic Resonance Fingerprinting (cMRF) has recently been introduced for simultaneous T1 and T2 quantification in the myocardium. One important feature of the MRF framework is the potential to measure multiple tissue properties beyond T1 and T2. Here we propose an approach for simultaneous fat imaging and T1 and T2 quantification based on the cMRF framework with a rosette trajectory. The accuracy in T1 and T2 measurements and the efficacy in water-fat separation were demonstrated in the ISMRM/NIST system phantom and a multi-compartment water/oil phantom, respectively. Preliminary results in the heart and liver in healthy subjects are also shown.
Introduction
For non-Cartesian MRI, fat signals are a dominant source of off-resonance artifacts. However, water-fat separation is valuable in various clinical applications such as diagnosis of hepatic steatosis and evaluation of myocardial lipomatous infiltration1,2. The rosette trajectory was first introduced as a spectrally selective imaging method and allows for water-fat separation by demodulating signals at either the water or fat resonance frequency3. Because of the multiple crossings at the center of k-space, careful design of the rosette trajectory allows for significant suppression of fat signals when data are reconstructed at water frequency, and vice versa. Thus, separate water images and fat images can be reconstructed from one dataset.
Cardiac Magnetic Resonance Fingerprinting (cMRF) has recently been introduced for simultaneous T1 and T2 quantification in the myocardium in a single scan4. Here an approach is proposed for simultaneous fat imaging and T1 and T2 quantification based on the cMRF framework with a rosette trajectory3,5. Validation was performed in a multi-compartment water/oil phantom and the ISMRM/NIST system phantom6. Preliminary results in the heart and liver in healthy subjects are shown in this study.
Methods
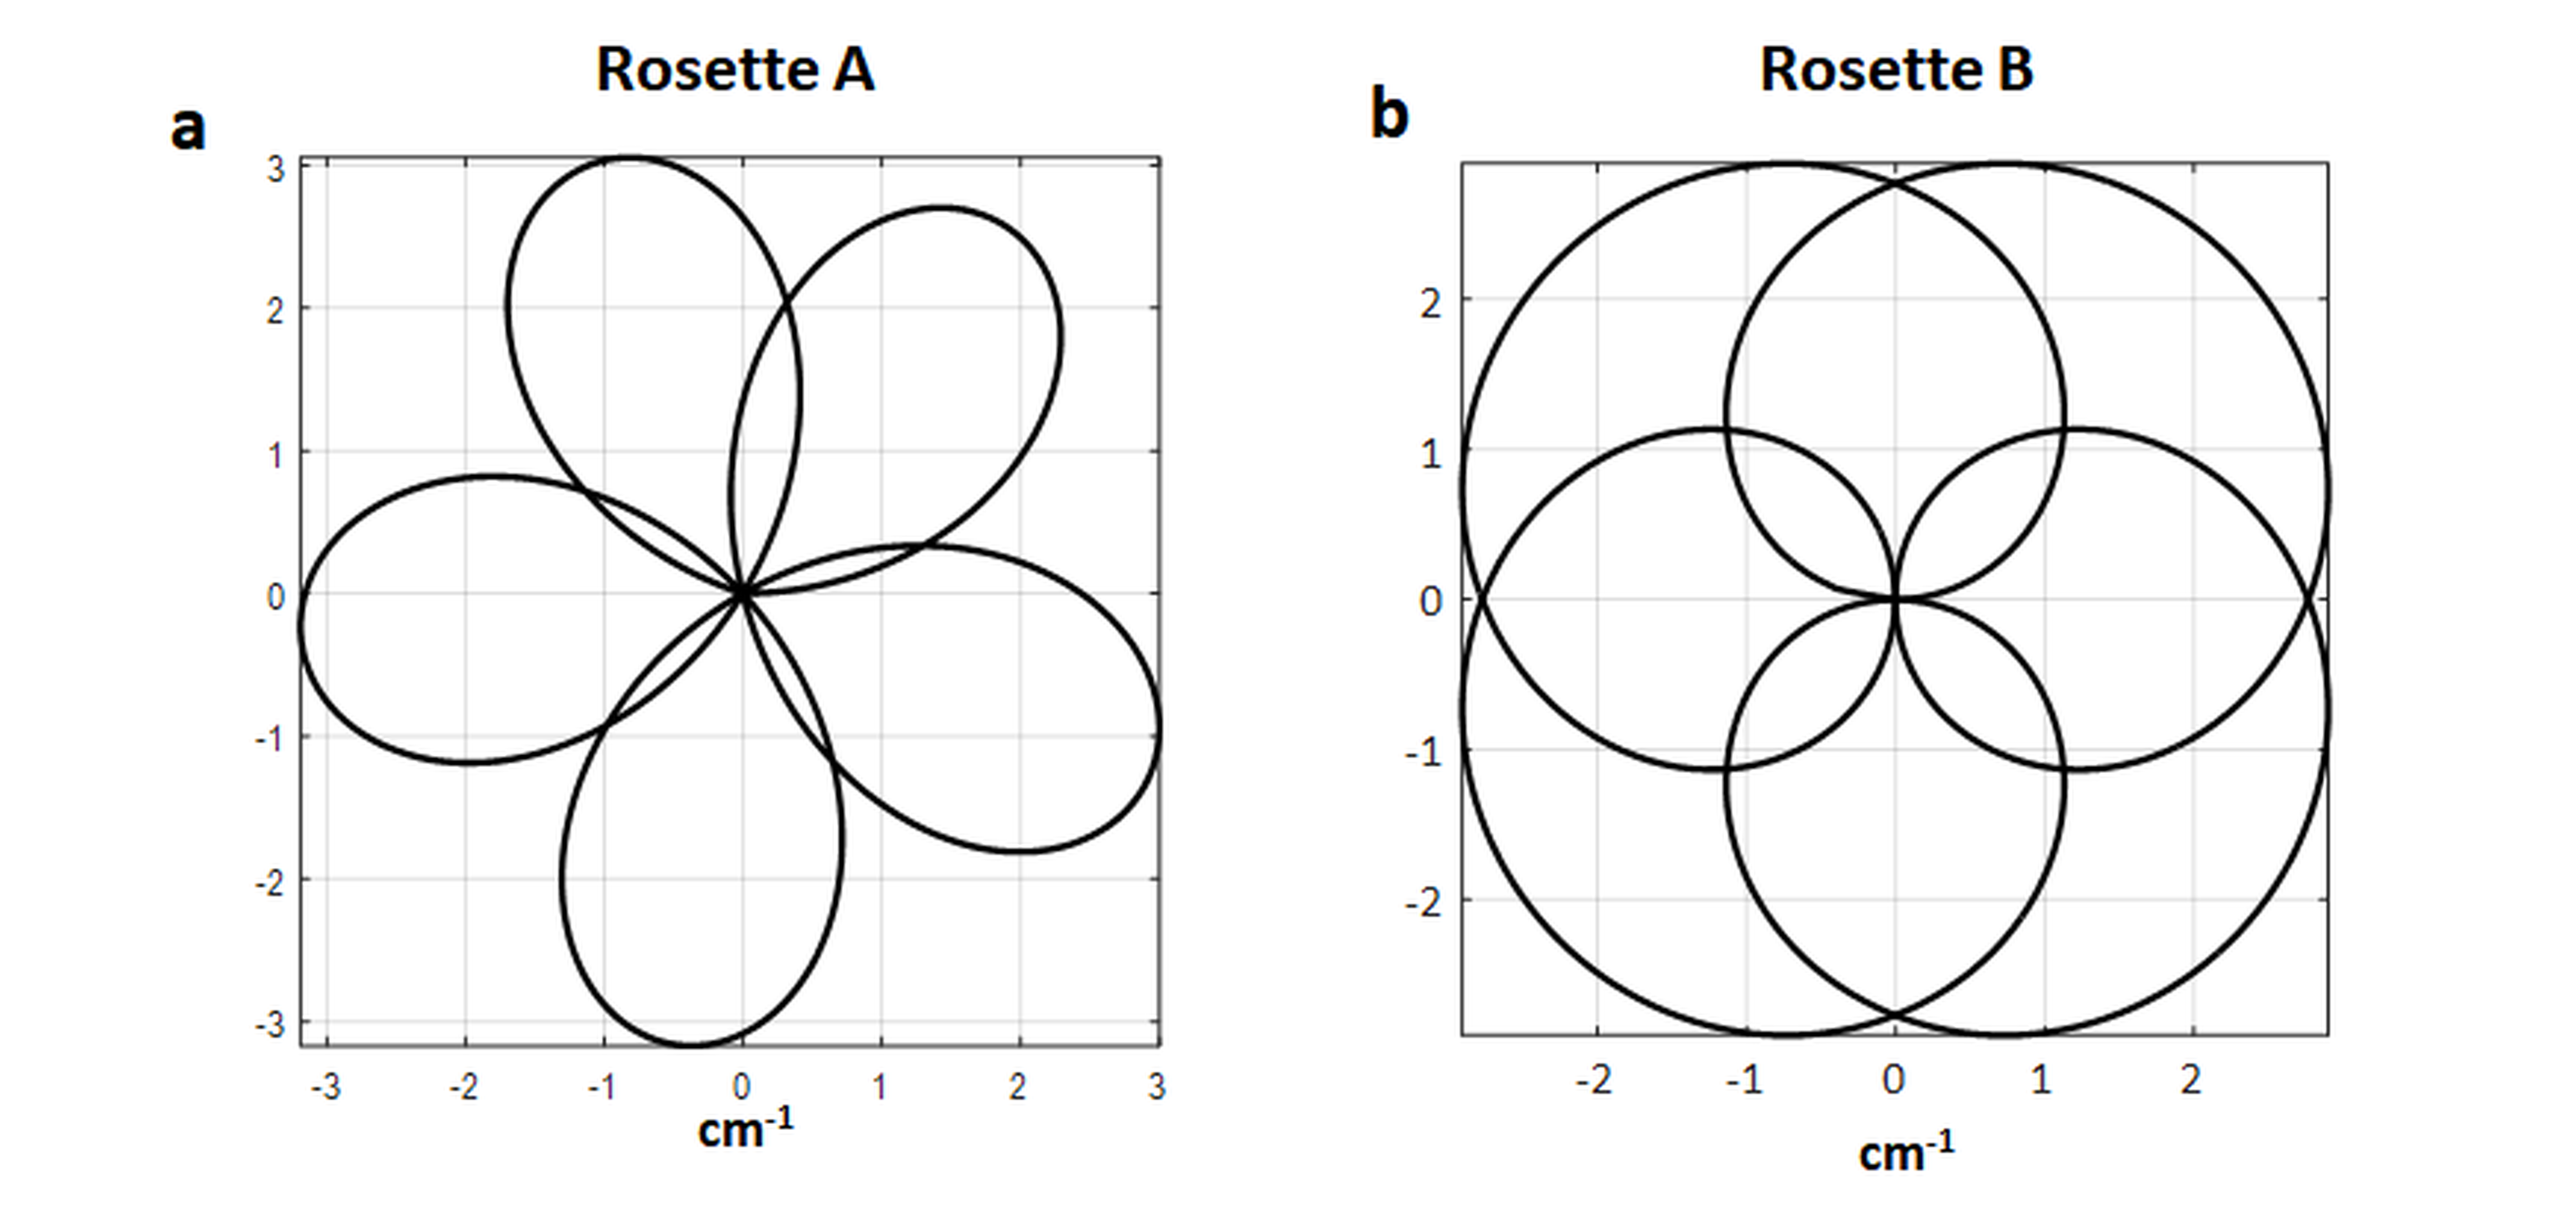
Two types of rosette trajectories were used in this study: a Class I trajectory with five zero-crossings (Fig1.a) and a Class II trajectory with four zero-crossings (Fig1.b)5. cMRF sequences7 using these two trajectories (denoted as Rosette A and Rosette B) were used to acquire data at end-diastole with ECG triggering during a 15-heartbeat breath-hold at the resonance frequency of water. The rosette interleaf was rotated by the golden angle (111°) between TRs. The TR was 6.42/7.36 ms for Rosette A and B, respectively; the TE was 1.39 ms for both trajectories; and voxel size was 1.6×1.6×8 mm3.
All phantom and in vivo experiments were performed on a 3T scanner (Siemens MAGNETOM Skyra, Erlangen, Germany). The accuracy of rosette cMRF in T1 and T2 quantification was validated in the ISMRM/NIST phantom. Its efficacy in water-fat separation was demonstrated in a multi-compartment water/oil phantom. Seven healthy subjects were scanned after written informed consent in this IRB-approved study. Short axis and/or 4-chamber slices in the heart were acquired in five subjects. An axial slice in the liver was acquired in two subjects. Simulated ECG signals at 60 bpm was used for phantom studies and ECG obtained from the heart was used for all in vivo scans. The chemical shift of fat/oil was obtained from the shimming procedure before the acquisition started; a single lipid peak was assumed for this work.
The acquired data were demodulated at water and fat resonance frequencies separately as described above to generate water image series and fat image series, respectively. A dictionary including slice profile and preparation pulse efficiency corrections8 and low rank reconstruction9 were used. For the water image series, the dictionary resolution, denoted by min:step:max, was T1 [10:10:2000, 2020:20:3000] ms, T2 [2:2:100, 105:5:200, 210:10:300, 320:20:500] ms; for fat image series, the dictionary was reduced to T1 [200:10:500] ms, T2 [40:2:100] ms considering T1 and T2 values of fat at 3T10,11. T1, T2, and proton density (PD) maps of water and PD map of fat were produced from the water image series and fat image series, respectively.
Results
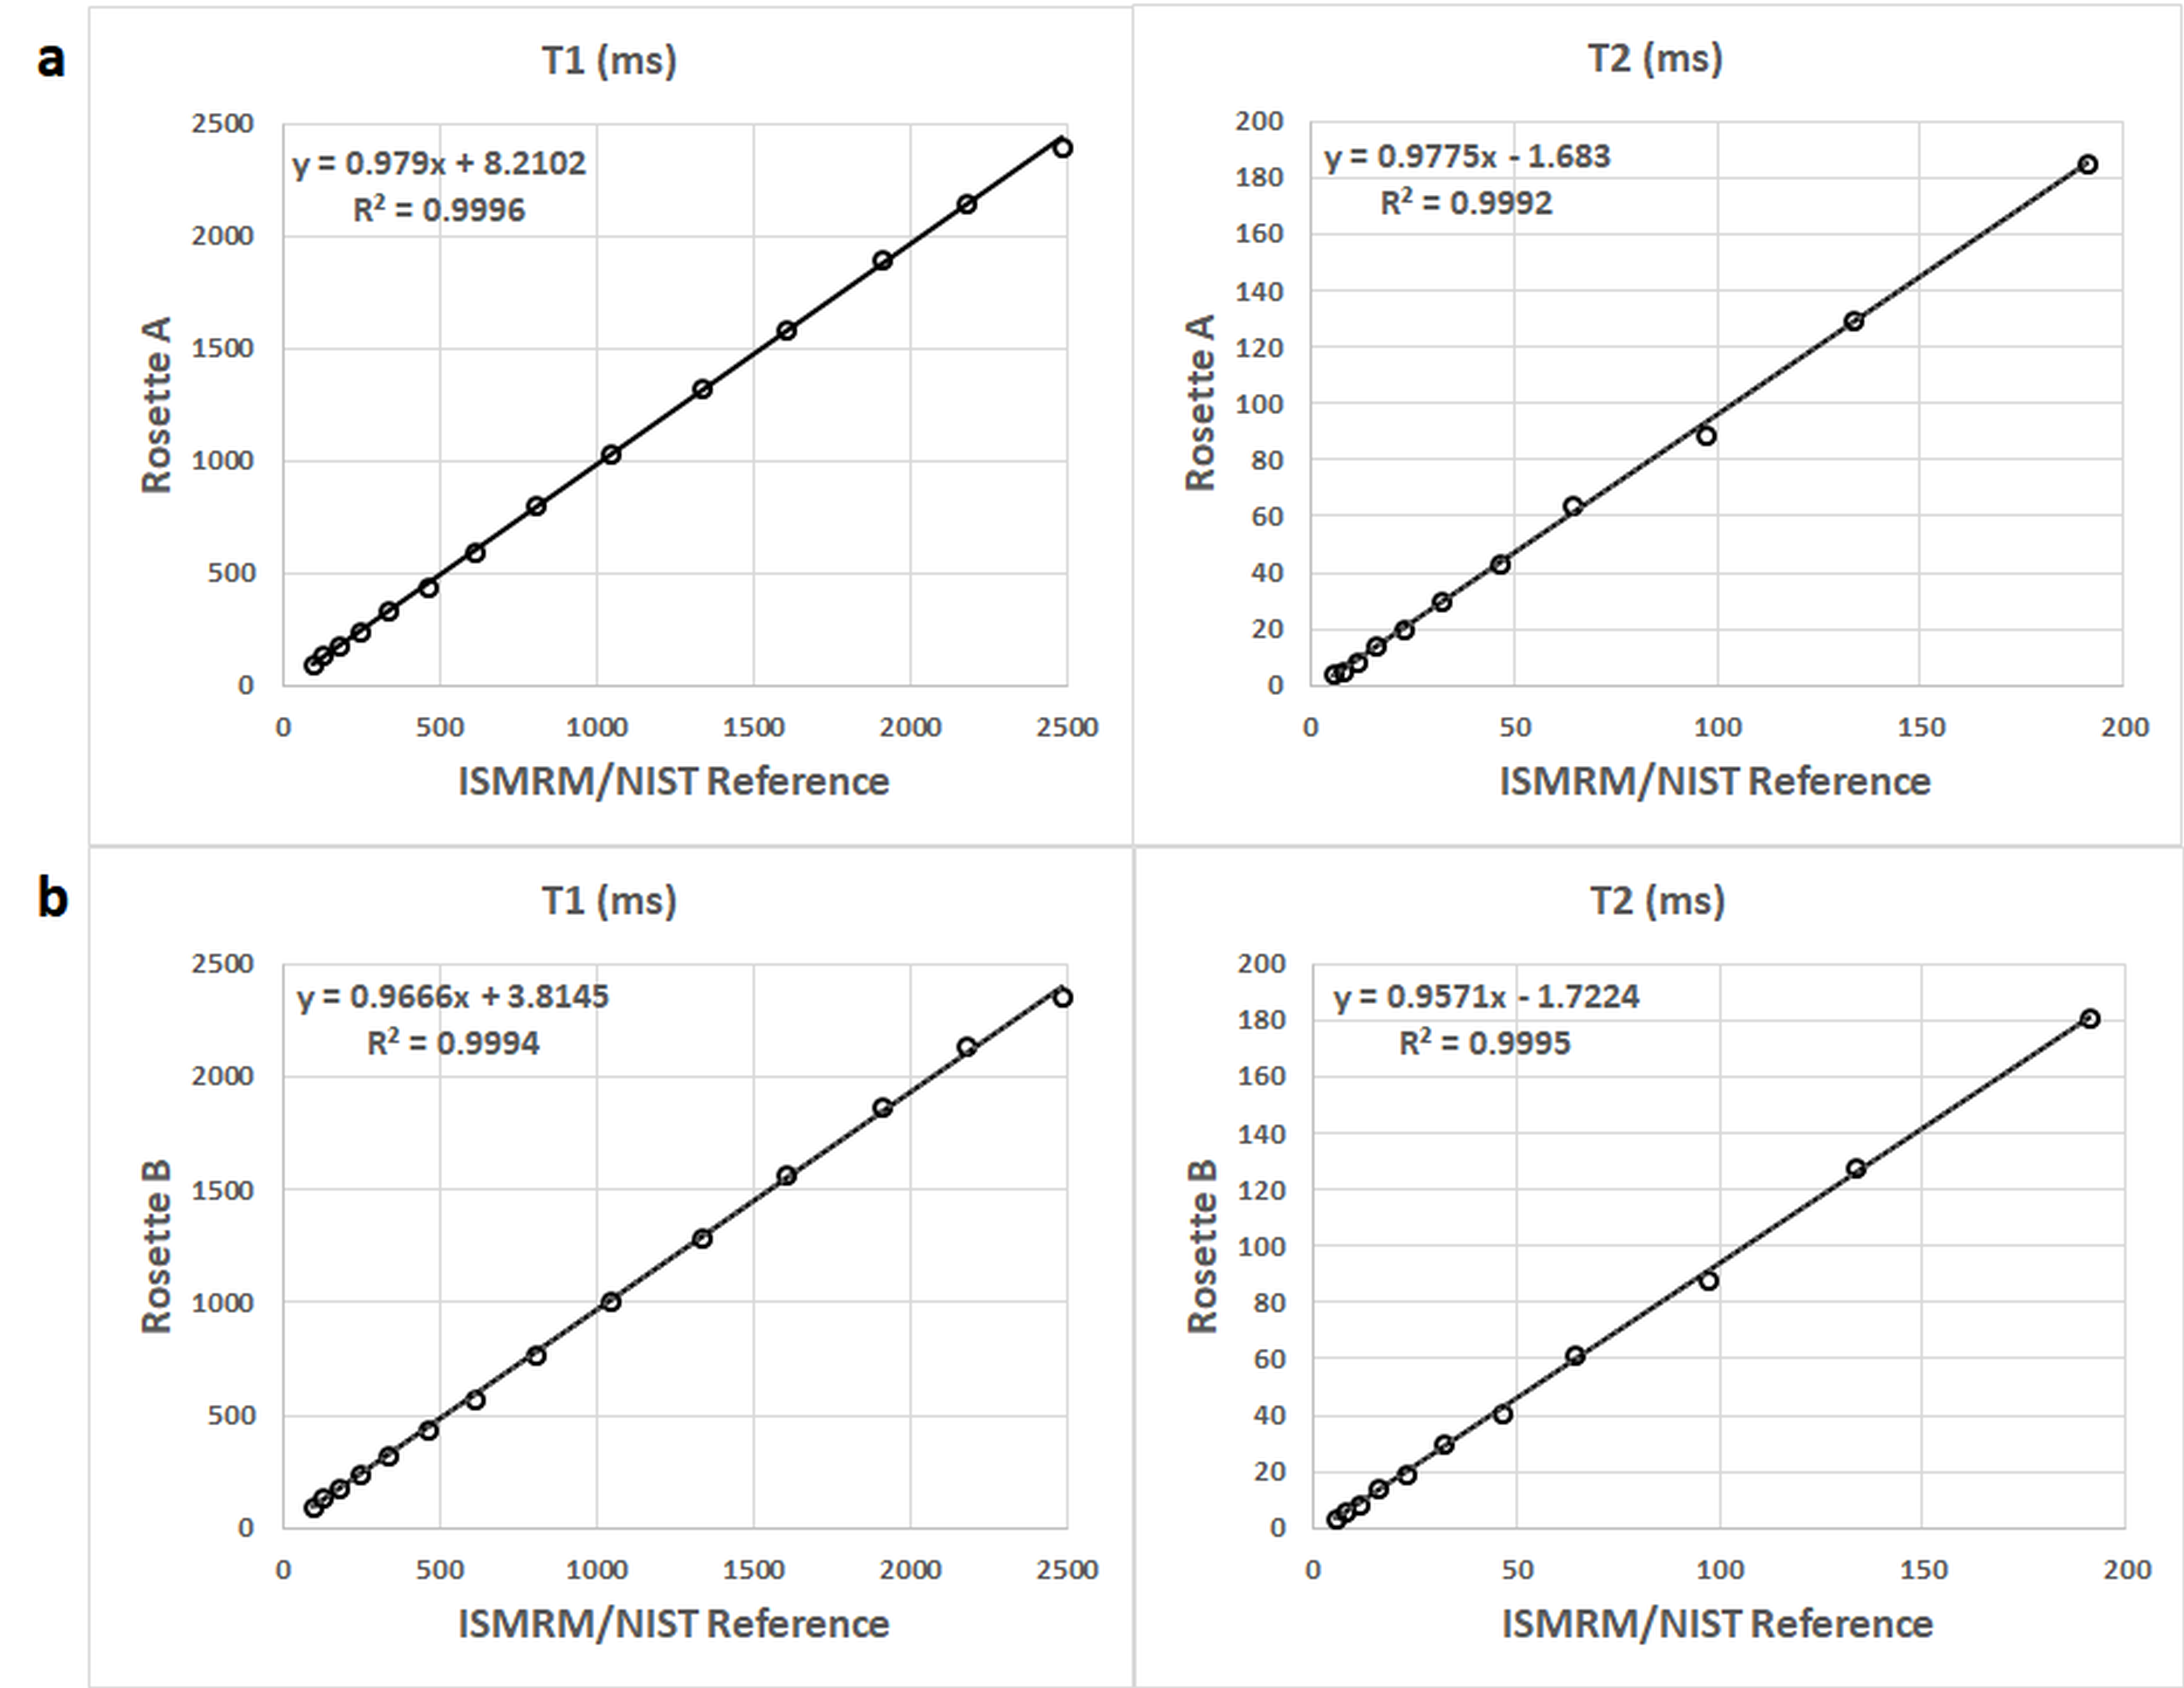
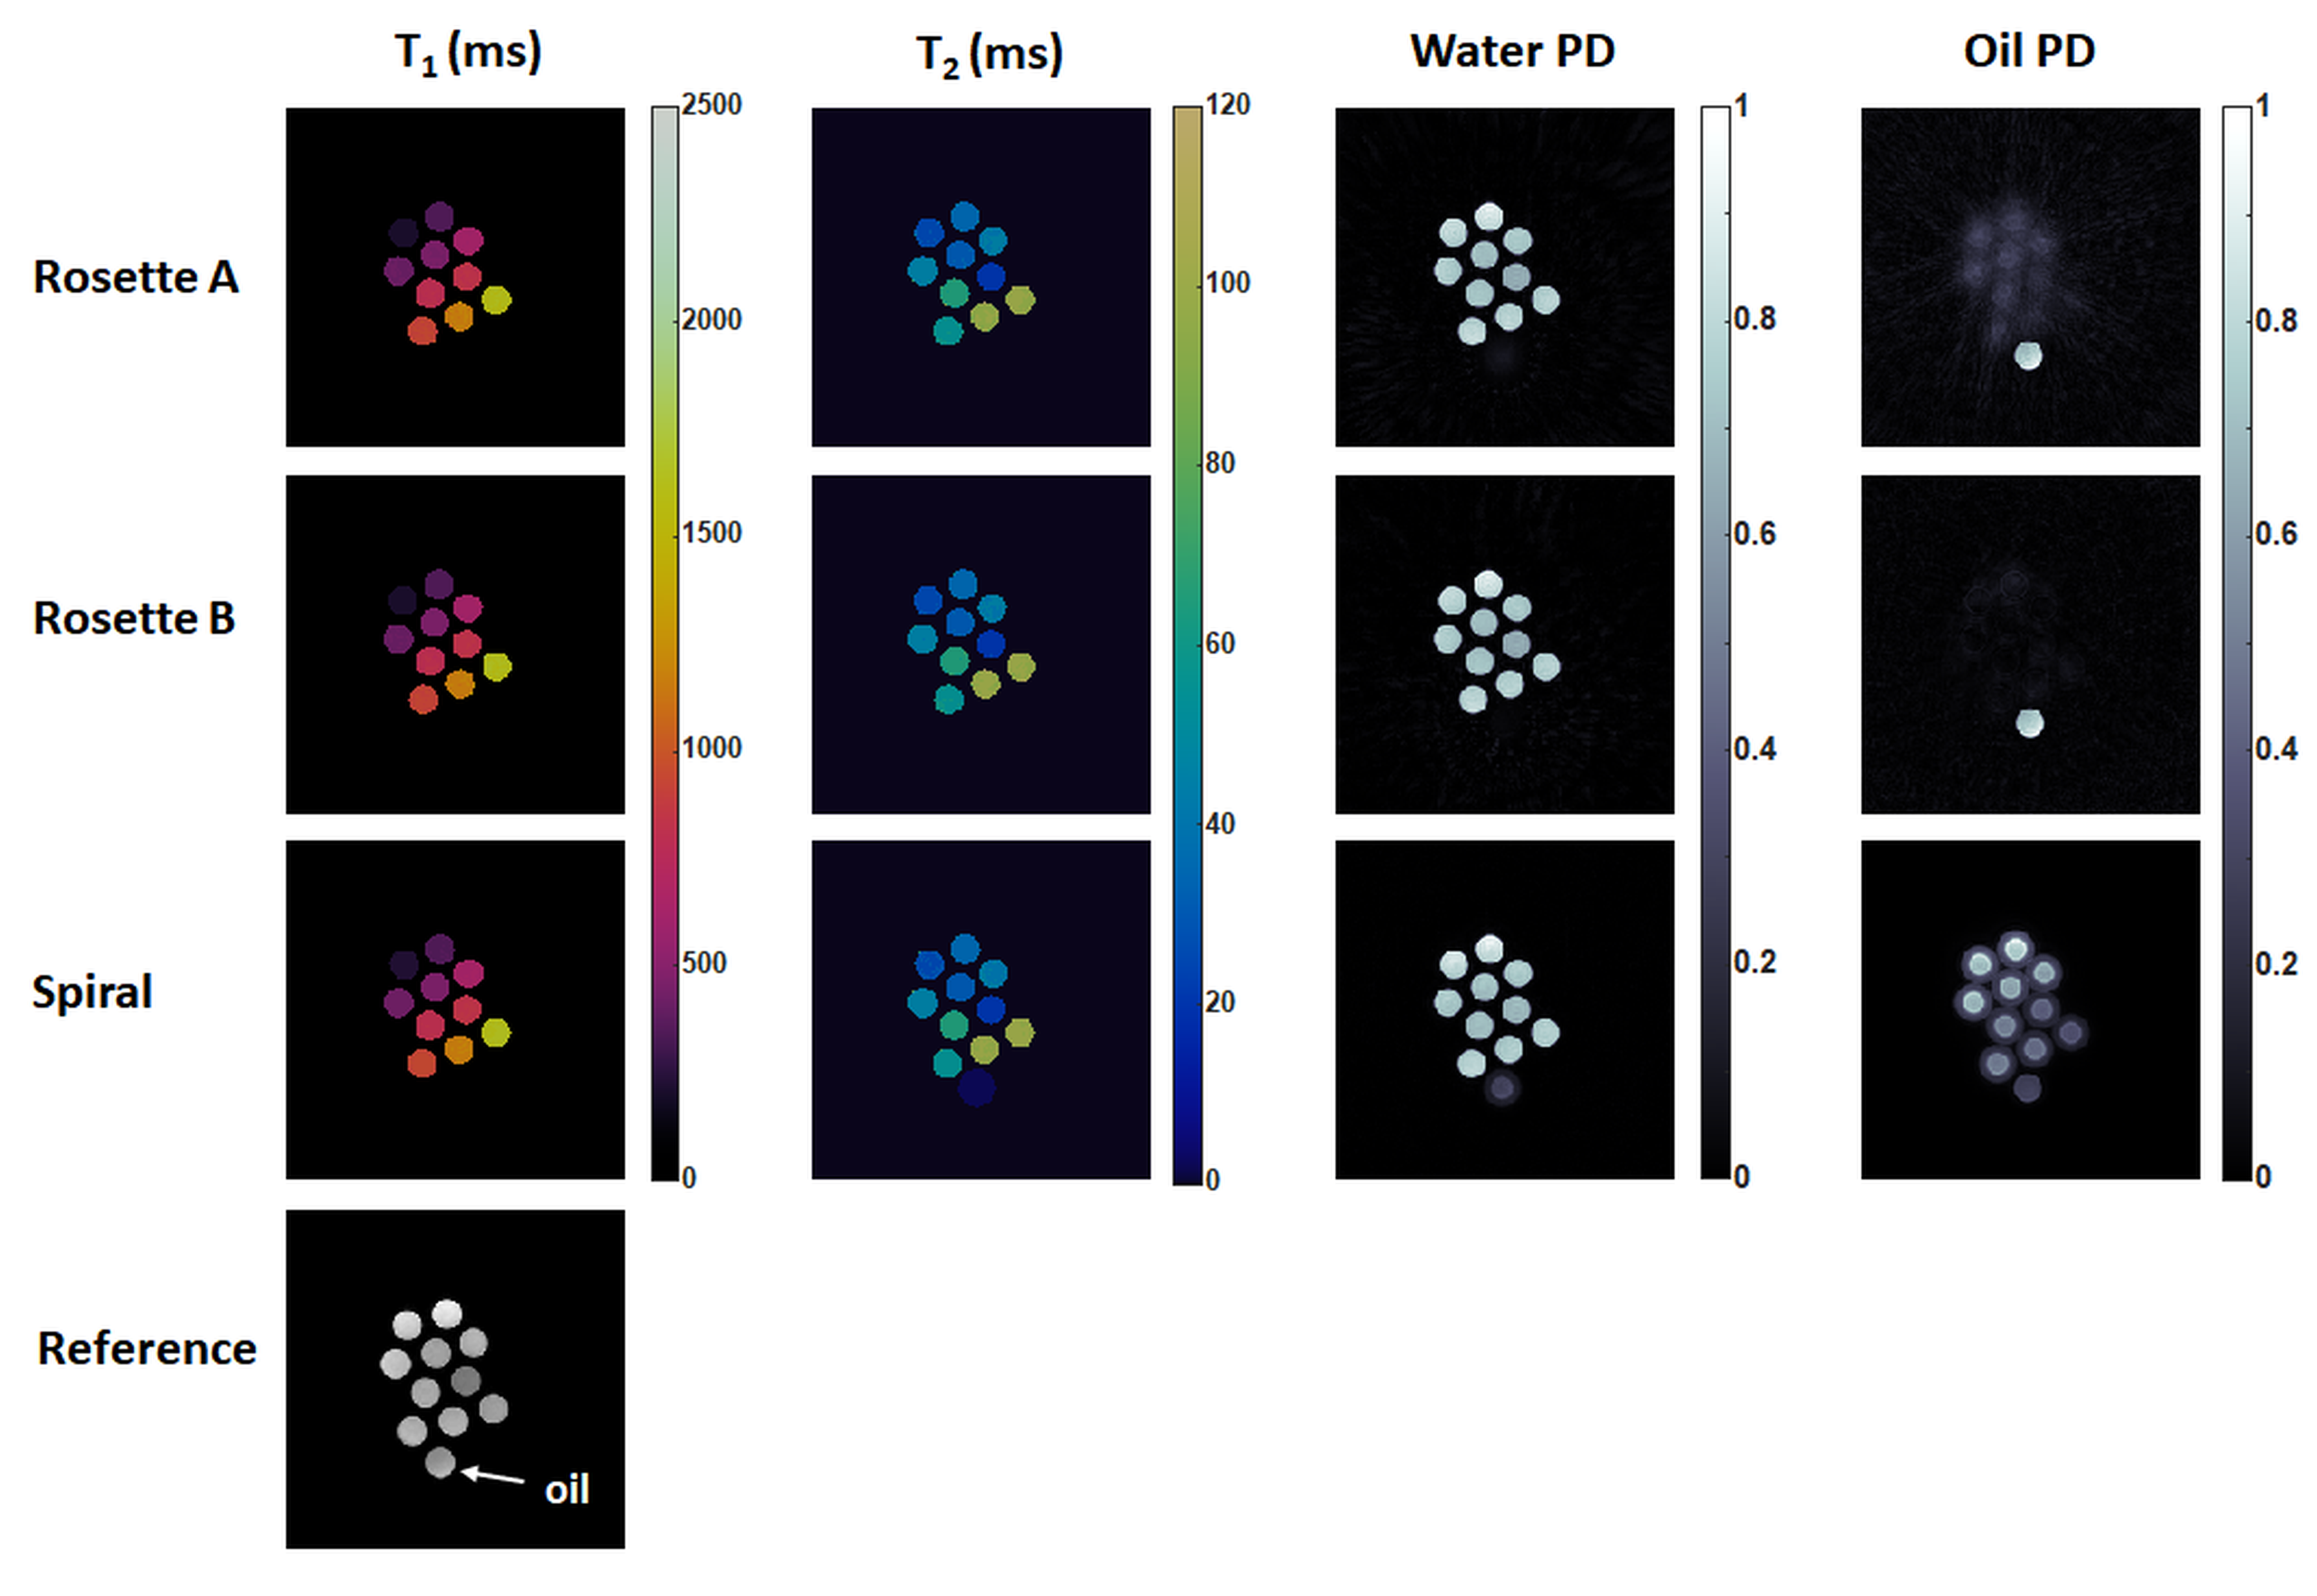
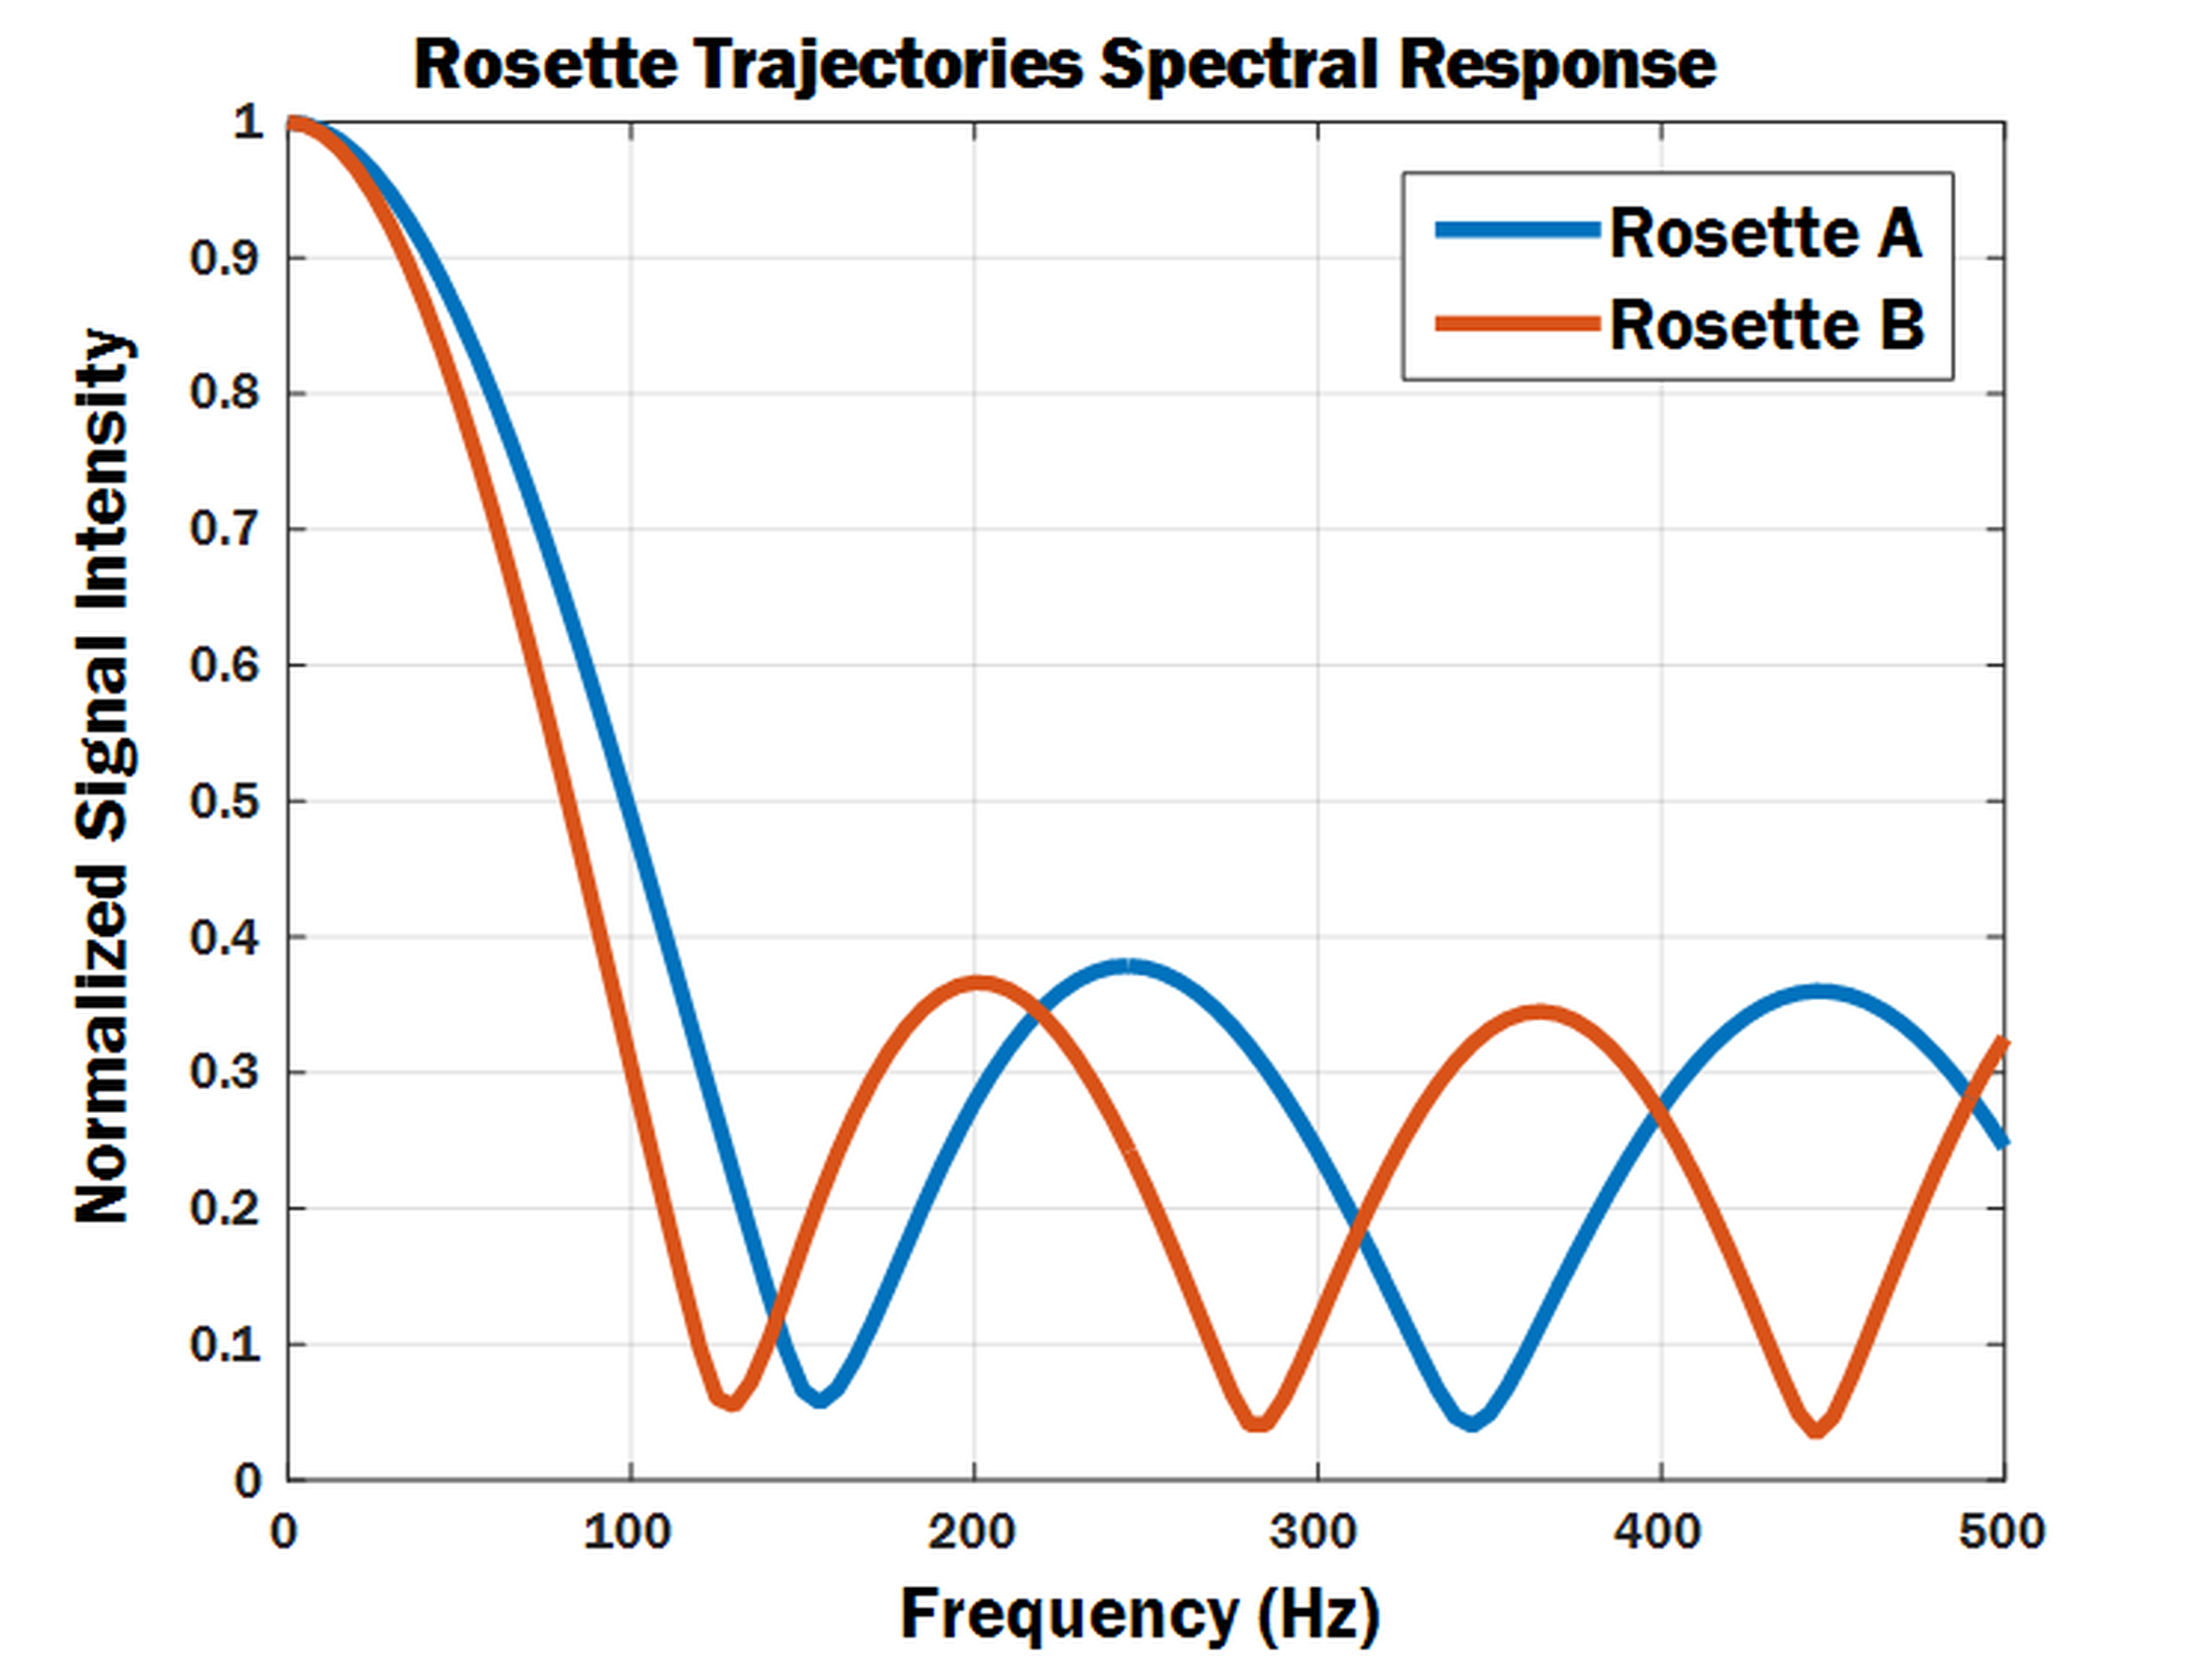
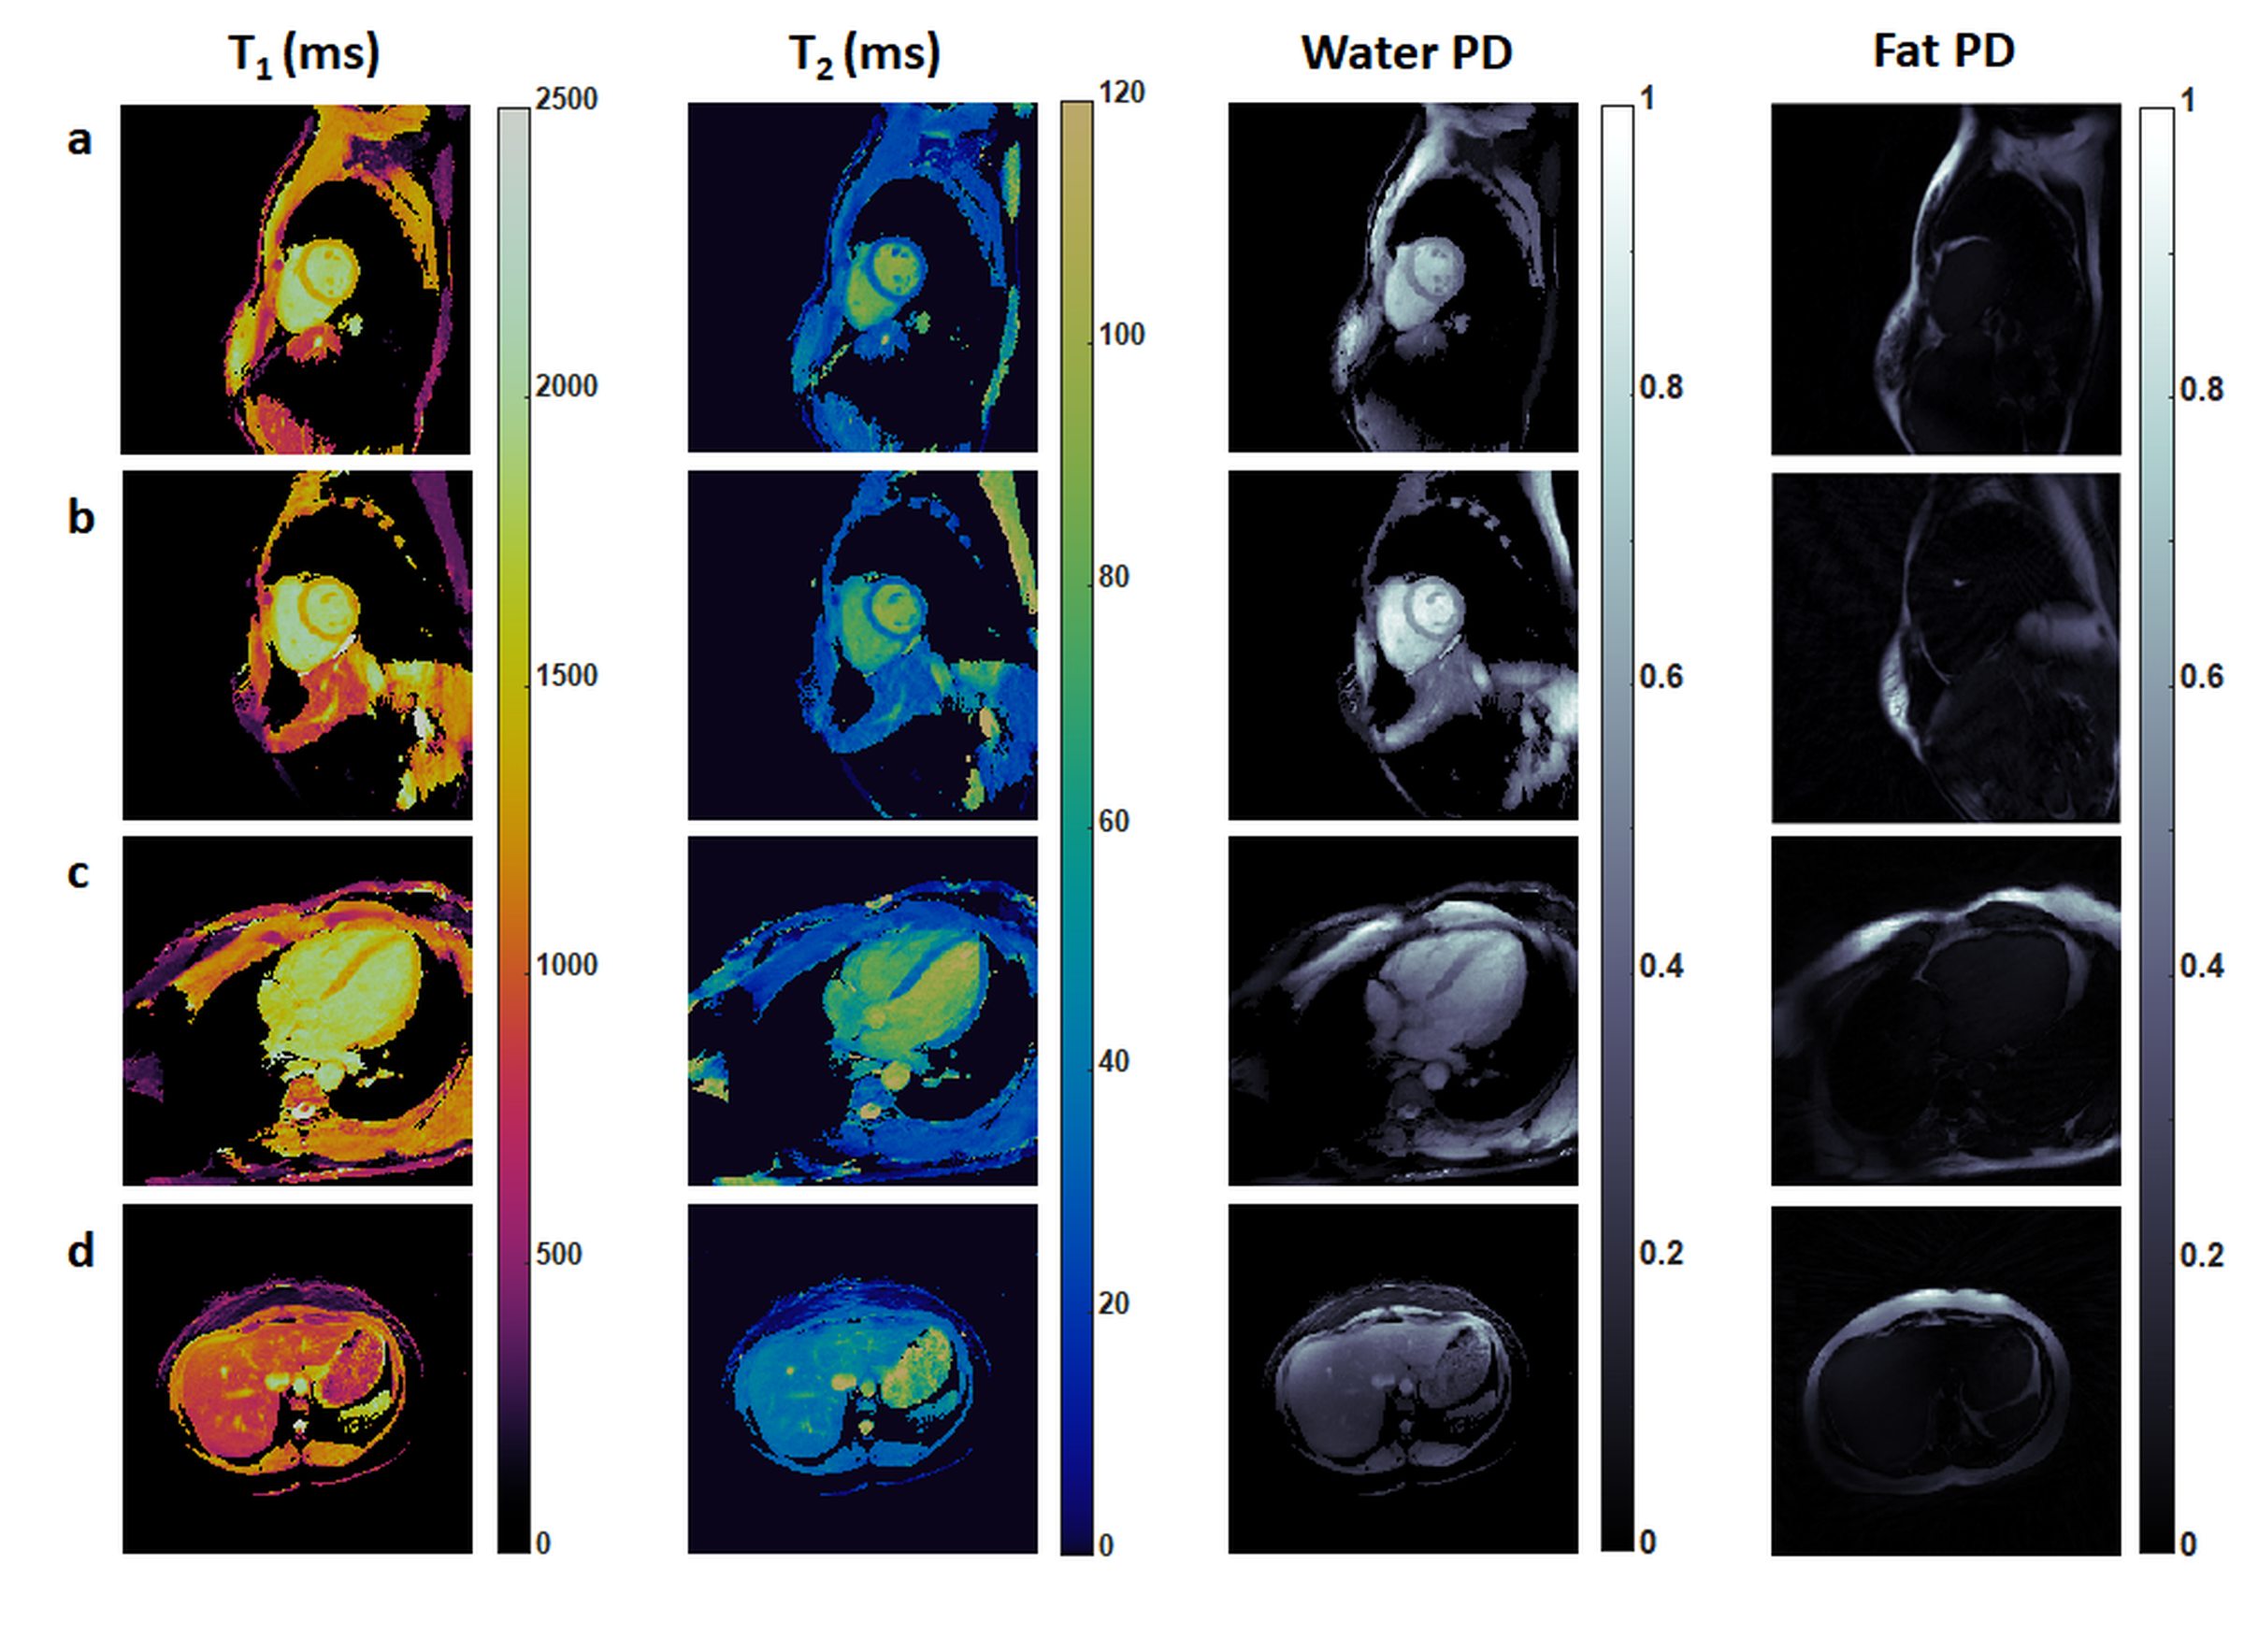
T1 and T2 measurements of rosette cMRF were in excellent agreement with the ISMRM/NIST phantom reference values for both Rosette A (Fig2.a) and Rosette B (Fig2.b). Rosette B exhibits better performance in suppressing fat at 3T than Rosette A (Fig3) due to their different spectral selectivity (Fig4). Residual oil signal in the water PD map was 9.3% and 3.3% for Rosette A and Rosette B, respectively. Fig5 shows representative T1, T2, water PD, and fat PD maps of the mid-ventricular (a), basal (b), 4-chamber (c) slices in the heart, and an axial slice in the liver (d). The mean T1 and T2 values in the myocardium of the five volunteers are 1329.9 ± 22.7ms and 30.7 ± 2.1ms. The T1 and T2 values in the liver of the two volunteers are 867.5 ± 24.1ms and 35.2 ± 5.9ms. T1 and T2 values in both heart and liver agree well with previous reports8,12-14. Epicardial fat (a-c) and subcutaneous fat (a-d) was shown clearly in the fat PD maps, and removed from all of the water maps.Discussion and Conclusion
This study shows that fat/water separation can be achieved along with T1 and T2 quantification in the heart and liver in a single scan of less than 15s using rosette cMRF. This approach could provide multiple biomarkers (i.e. fat deposition, T1, T2) simultaneously for evaluation of myocardial and hepatic diseases.Acknowledgements
R01HL094557, R01DK098503, CBET 1553441, C06 RR12463-01, Siemens Healthineers (Erlangen, Germany).References
1. Farrelly C, Shah S, Davarpanah A, Keeling AN, Carr JC. ECG-gated multiecho Dixon fat-water separation in cardiac MRI: Advantages over conventional fat-saturated imaging. Am. J. Roentgenol. 2012;199.
2. Hussain HK, Chenevert TL, Londy FJ, Gulani V, Swanson SD, McKenna BJ, Appelman HD, Adusumilli S, Greenson JK, Conjeevaram HS. Hepatic fat fraction: MR imaging for quantitative measurement and display - Early experience. Radiology 2005;237:1048–1055.
3. Noll DC. Multishot rosette trajectories for spectrally selective MR imaging. IEEE Trans. Med. Imaging 1997;16:372–7.
4. Hamilton JI, Jiang Y, Chen Y, Ma D, Lo WC, Griswold M, Seiberlich N. MR fingerprinting for rapid quantification of myocardial T1, T2, and proton spin density. Magn. Reson. Med. 2017;77:1446–1458.
5. Li Y, Yang R, Zhang C, Zhang J, Jia S, Zhou Z. Analysis of generalized rosette trajectory for compressed sensing MRI Analysis of generalized rosette trajectory for compressed sensing MRI. Am. Assoc. Phys. Med. 2015;42:5530–5544.
6. Russek SE, Boss M, Jackson EF, Jennings DL, Eveloch JL, Gunter JL, et al. Characterization of NIST/ISMRM MRI System Phantom. Proc 20th Annu Meet ISMRM. 2012:2456.
7. Hamilton JI, Jiang Y, Ma D, Pahwa S, Chen Y, Lo W-C, Griswold MA, Seiberlich N. A Comparison of 5-Heartbeat vs. 15-Heartbeat Cardiac MR Fingerprinting Sequences in Normal Volunteers. ISMRM Work. MRF 2017.
8. Hamilton JI, Jiang Y, Ma D, Lo W-C, Gulani V, Griswold M, Seiberlich N. Investigating and reducing the effects of confounding factors for robust T 1 and T 2 mapping with cardiac MR fingerprinting. Magn. Reson. Imaging 2018;53:40–51.
9. Hamilton JI, Jiang Y, Chen Y, Pawha S, Lo W, Batesole J, Seiberlich N. Low Rank Compressed Sensing Reconstruction for More Precise Cardiac MRF Measurements. Proc. 25th Annu. Meet. ISMRM 2017:554.
10. Jordan CD, Saranathan M, Bangerter NK, Hargreaves BA, Gold GE. Musculoskeletal MRI at 3.0 T and 7.0 T: A comparison of relaxation times and image contrast. Eur. J. Radiol. 2013;82:734–739.
11. Rakow-Penner R, Daniel B, Yu H, Sawyer-Glover A, Glover GH. Relaxation times of breast tissue at 1.5T and 3T measured using IDEAL. J. Magn. Reson. Imaging 2006;23:87–91.
12. Chen Y, Lee GR, Aandal G, Badve C, WrighT KL, Griswold MA, Seiberlich N, Gulani V. Rapid volumetric t1mapping of the abdomen using three-dimensional through-time spiral GRAPPA. Magn. Reson. Med. 2016.
13. de Bazelaire CMJ, Duhamel GD, Rofsky NM, Alsop DC. MR Imaging Relaxation Times of Abdominal and Pelvic Tissues Measured in Vivo at 3.0 T: Preliminary Results. Radiology 2004.
14. Stanisz GJ, Odrobina
EE, Pun J, Escaravage M, Graham SJ, Bronskill MJ, Henkelman RM. T1, T2
relaxation and magnetization transfer in tissue at 3T. Magn. Reson. Med.
2005;54:507–512.
Figures