4375
Real-time Metabolic Investigations of Living Cells by NMR – First Experiences1Departments DOLS, University Hospital of Bern, Switzerland, Institute of Clinical Chemistry, University Hospital Bern, Switzerland, Bern, Switzerland, 2Departments of Clinical Research and Radiology, University of Bern, Switzerland, Magnetic Resonance Spectroscopy and Methodology - Department of Clinical Research - University Bern/Switzerland, Bern, Switzerland, 3Graduate School for Cellular and Biomedical Sciences, University of Bern, Switzerland, Bern, Switzerland, 4Department of Pediatric Endocrinology, Diabetology and Metabolism, University Children’s Hospital of Bern, Switzerland, Bern, Switzerland
Synopsis
NMR approaches using flow systems for real-time spectroscopy of living cells were explored as early as the 80s but did not become routine due to different technical obstacles. We show the technical feasibility of real-time metabolic monitoring in 3D culture inside our established NMR bioreactor using the commercially available InsightCellTM (Bruker) tool, which supposedly eases bioreactor setup. Human skin fibroblasts showed reproducible glucose and O2 measurements in stop-and-go experiments over 12 hours. Chemical interventions on aerobic energy production pathways showed fast response by increasing rate of anaerobic glycolysis, which could be reversed by subsequent inhibition of glycolytic pathway.
Introduction
To our knowledge, approx. 15-20 sophisticated bioreactors have been developed worldwide for growing and investigating cells inside an NMR spectrometer and their potential has been demonstrated1-6. Recently Bruker released a flow tube (InsightMRTM, Bruker), which allows for online reaction monitoring and its further specialization InsightCellTM. This commercially available tool may ease bioreactor establishment, improve comparability of results across laboratories, and does not require a special probehead as it uses a standard 5mm NMR tube. The possibility to analyse both intra- and extracellular metabolome under stable culture condition and detect metabolic responses upon chemical interventions may allow proton NMR to become a key tool in the better understanding of cellular pathomechanisms.
Our aims are 1.) to establish a perfused NMR bioreactor system to study short-term metabolic changes in living cells (fibroblasts, 3D human brain cells); 2.) to test stability and reproducibility of investigating longitudinal and fast dynamic metabolic processes; 3.) to measure sensitivity to pathway changes upon pathway-specific inhibitors. In the long term, we aim to evaluate drug treatments and toxicological challenges.
Methods
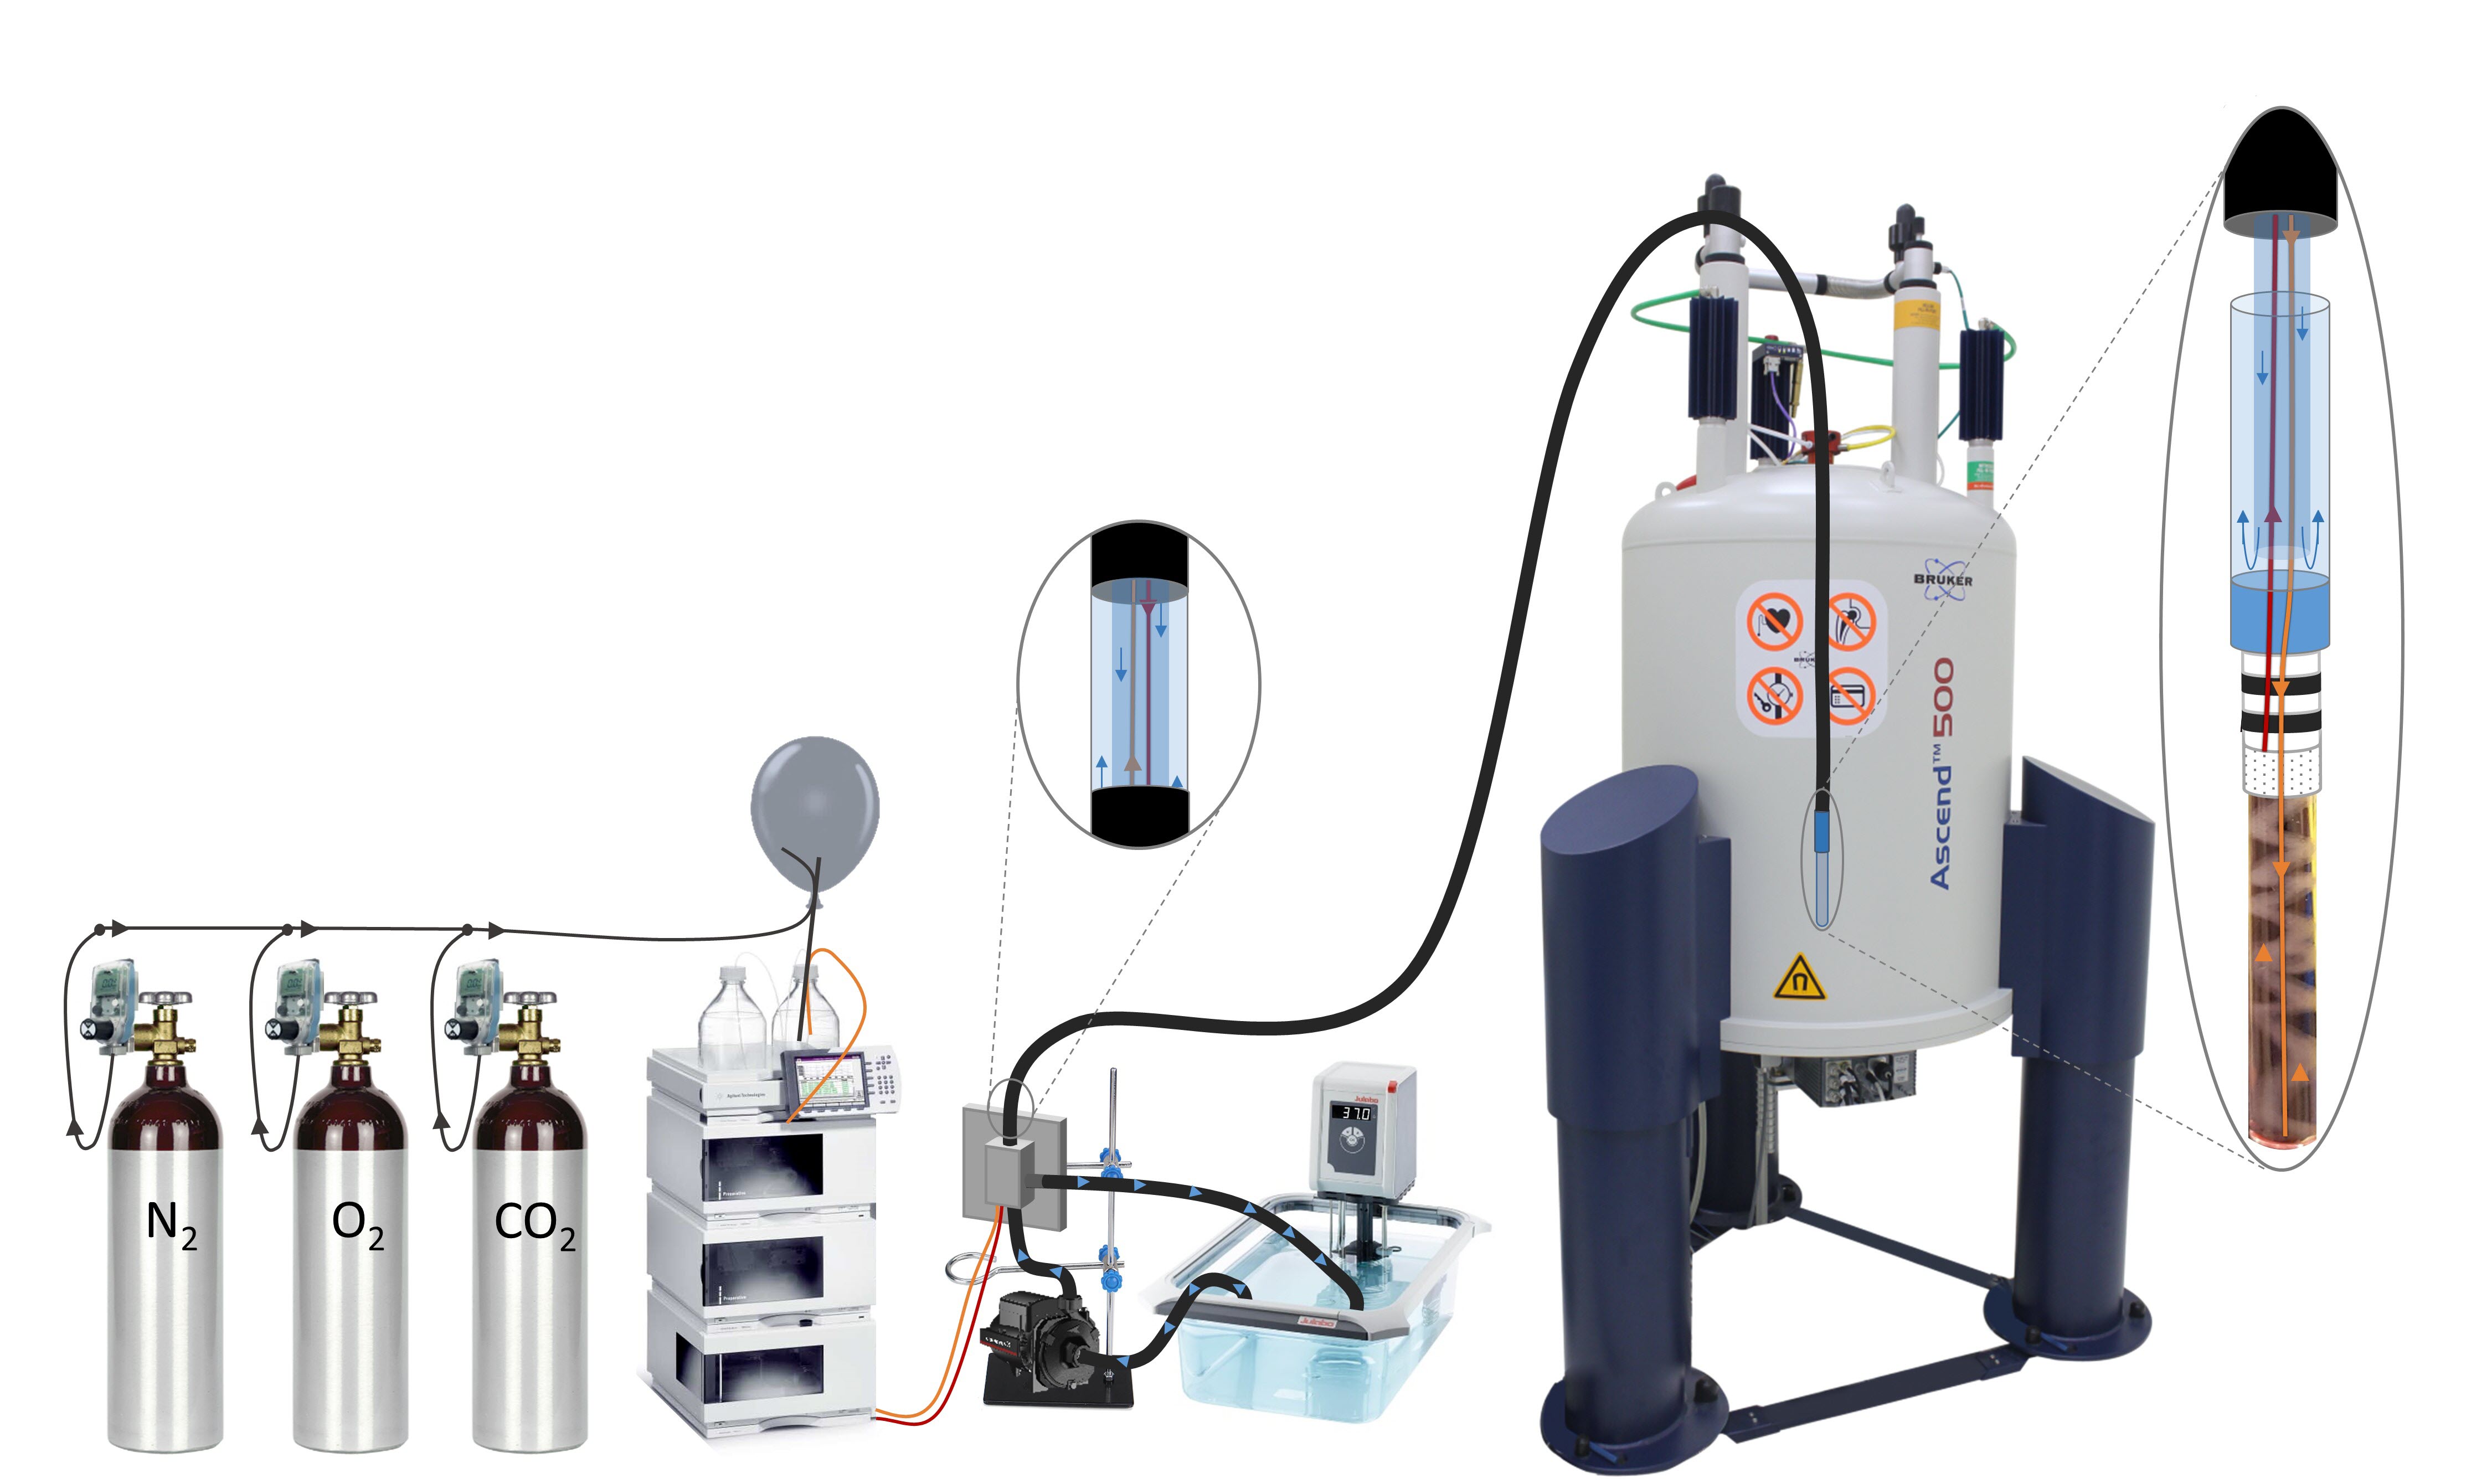
Cell culturing: Human skin fibroblasts were grown under standard culture condition (Dulbecco's Modified Eagle Medium with 5.5mM glucose, 10% foetal calf serum, 2mM L-glutamine, 1mM sodium pyruvate, 50μM uridine) at 37°C in a humidified 5% CO2 incubator. Five million cells were transferred to 3D scaffold as follows: Cells embedded in matrigel (7mg/ml) were kept within a sterile plastic tube at 37°C for 30 minutes. After polymerization of the collagen based matrigel cells were transferred back into medium for re-adhesion and therefore incubated overnight. NMR spectroscopy: 1H NMR experiments were performed on a 500 MHz Bruker Avance II spectrometer. A HPLC pumping system was used for constant perfusion of substrate via perfusion apparatus InsightCellTM. Online metabolic profiling by proton NMR was performed using 1D project spectra of 48 transients (≈7min) per spectrum, allowing kinetic tracking of 30 intra- and extracellular metabolites under standard cell culture condition7. Dependence of T1 times on the paramagnetic O2 concentration was used to estimate oxygen concentration in culture media8,9. Measurements were performed using t1pir spectra of 8 transients (inversion times [sec]: 0.005, 0.646, 1.317, 2.030, 2.804, 3.676, 4.732, 6.277) per spectrum (≈2min). Cell viability was controlled by flow cytometry and trypan blue staining.Results
1.) NMR bioreactor system: Established perfusion apparatus with the InsightCell tool in the NMR spectrometer is shown in Figure 1. Density, composition and amount of 3D Scaffold + fibroblasts was evaluated resulting in a high viability of the cells.
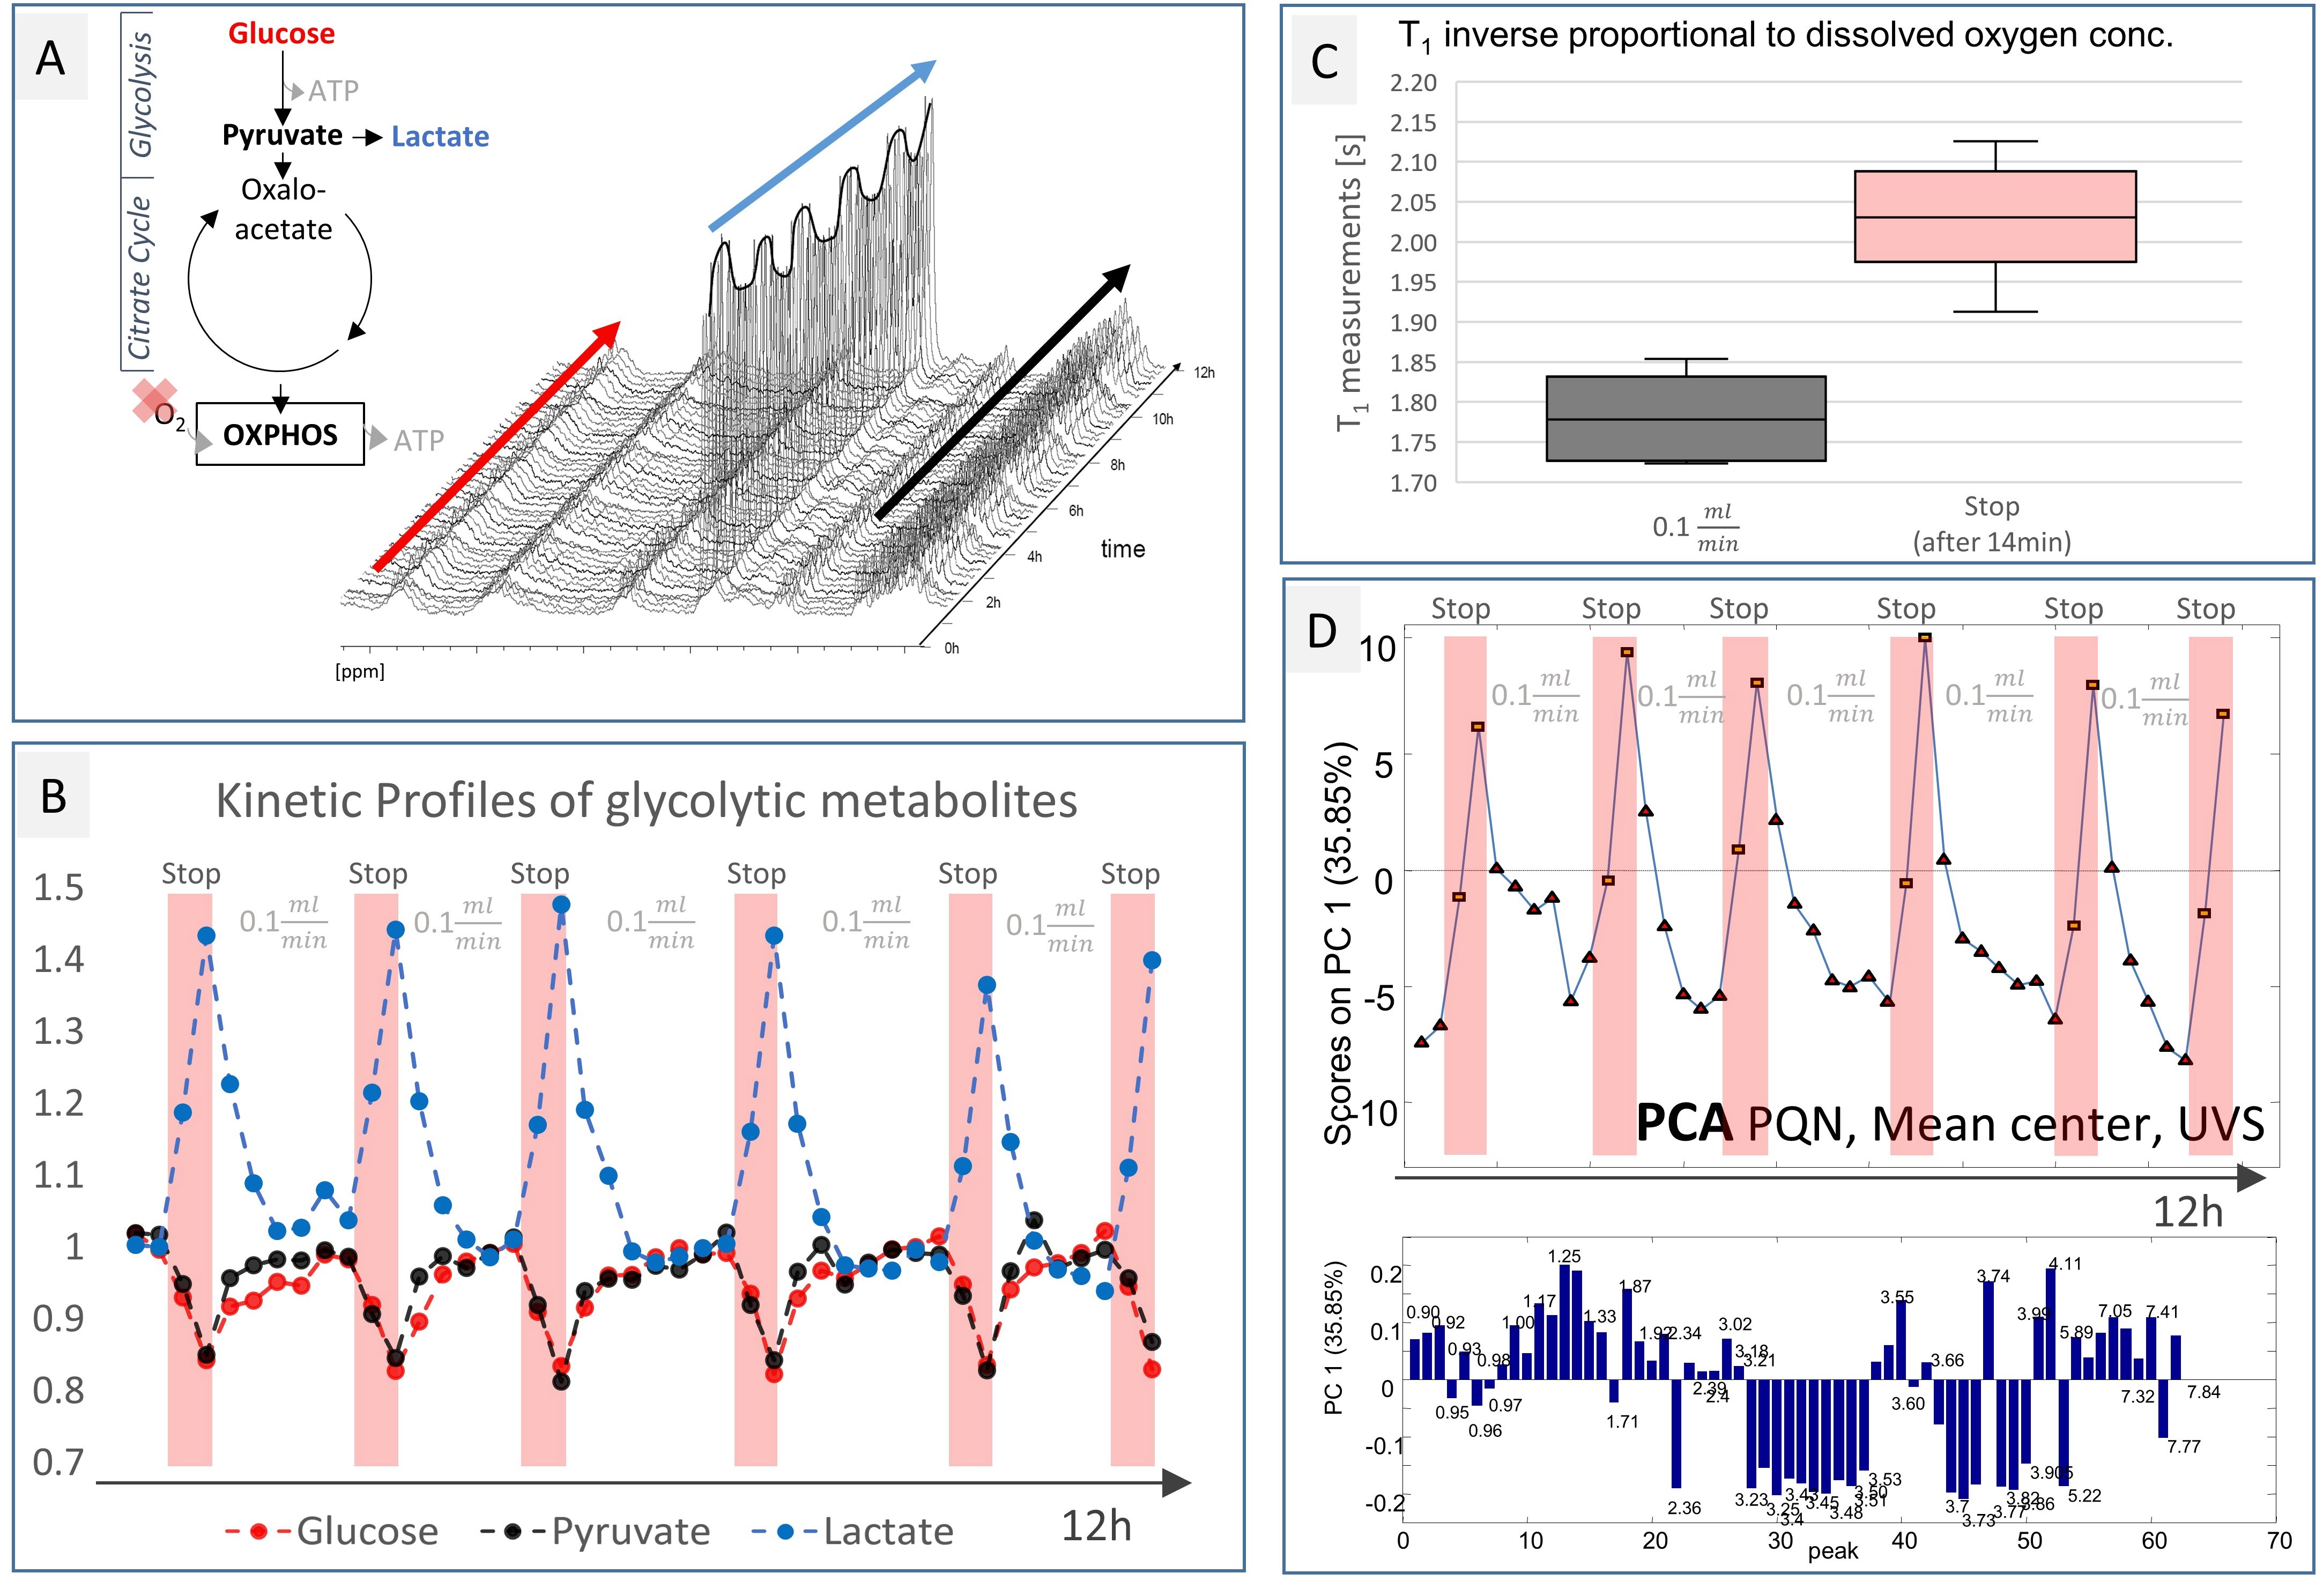
2.) Test stability and reproducibility of metabolic responses: In a substrate “stop-and-go” experiment, embedded fibroblasts were investigated over 12h with an acquisition time of 7-14min per metabolic profile in the perfused bioreactor (Figure 2). The spectra and plots show periodic increases and decreases of glycolytic metabolites, such as glucose, pyruvate and lactate. Metabolic responses remained constant in its direction and amplitude indicating high viability.
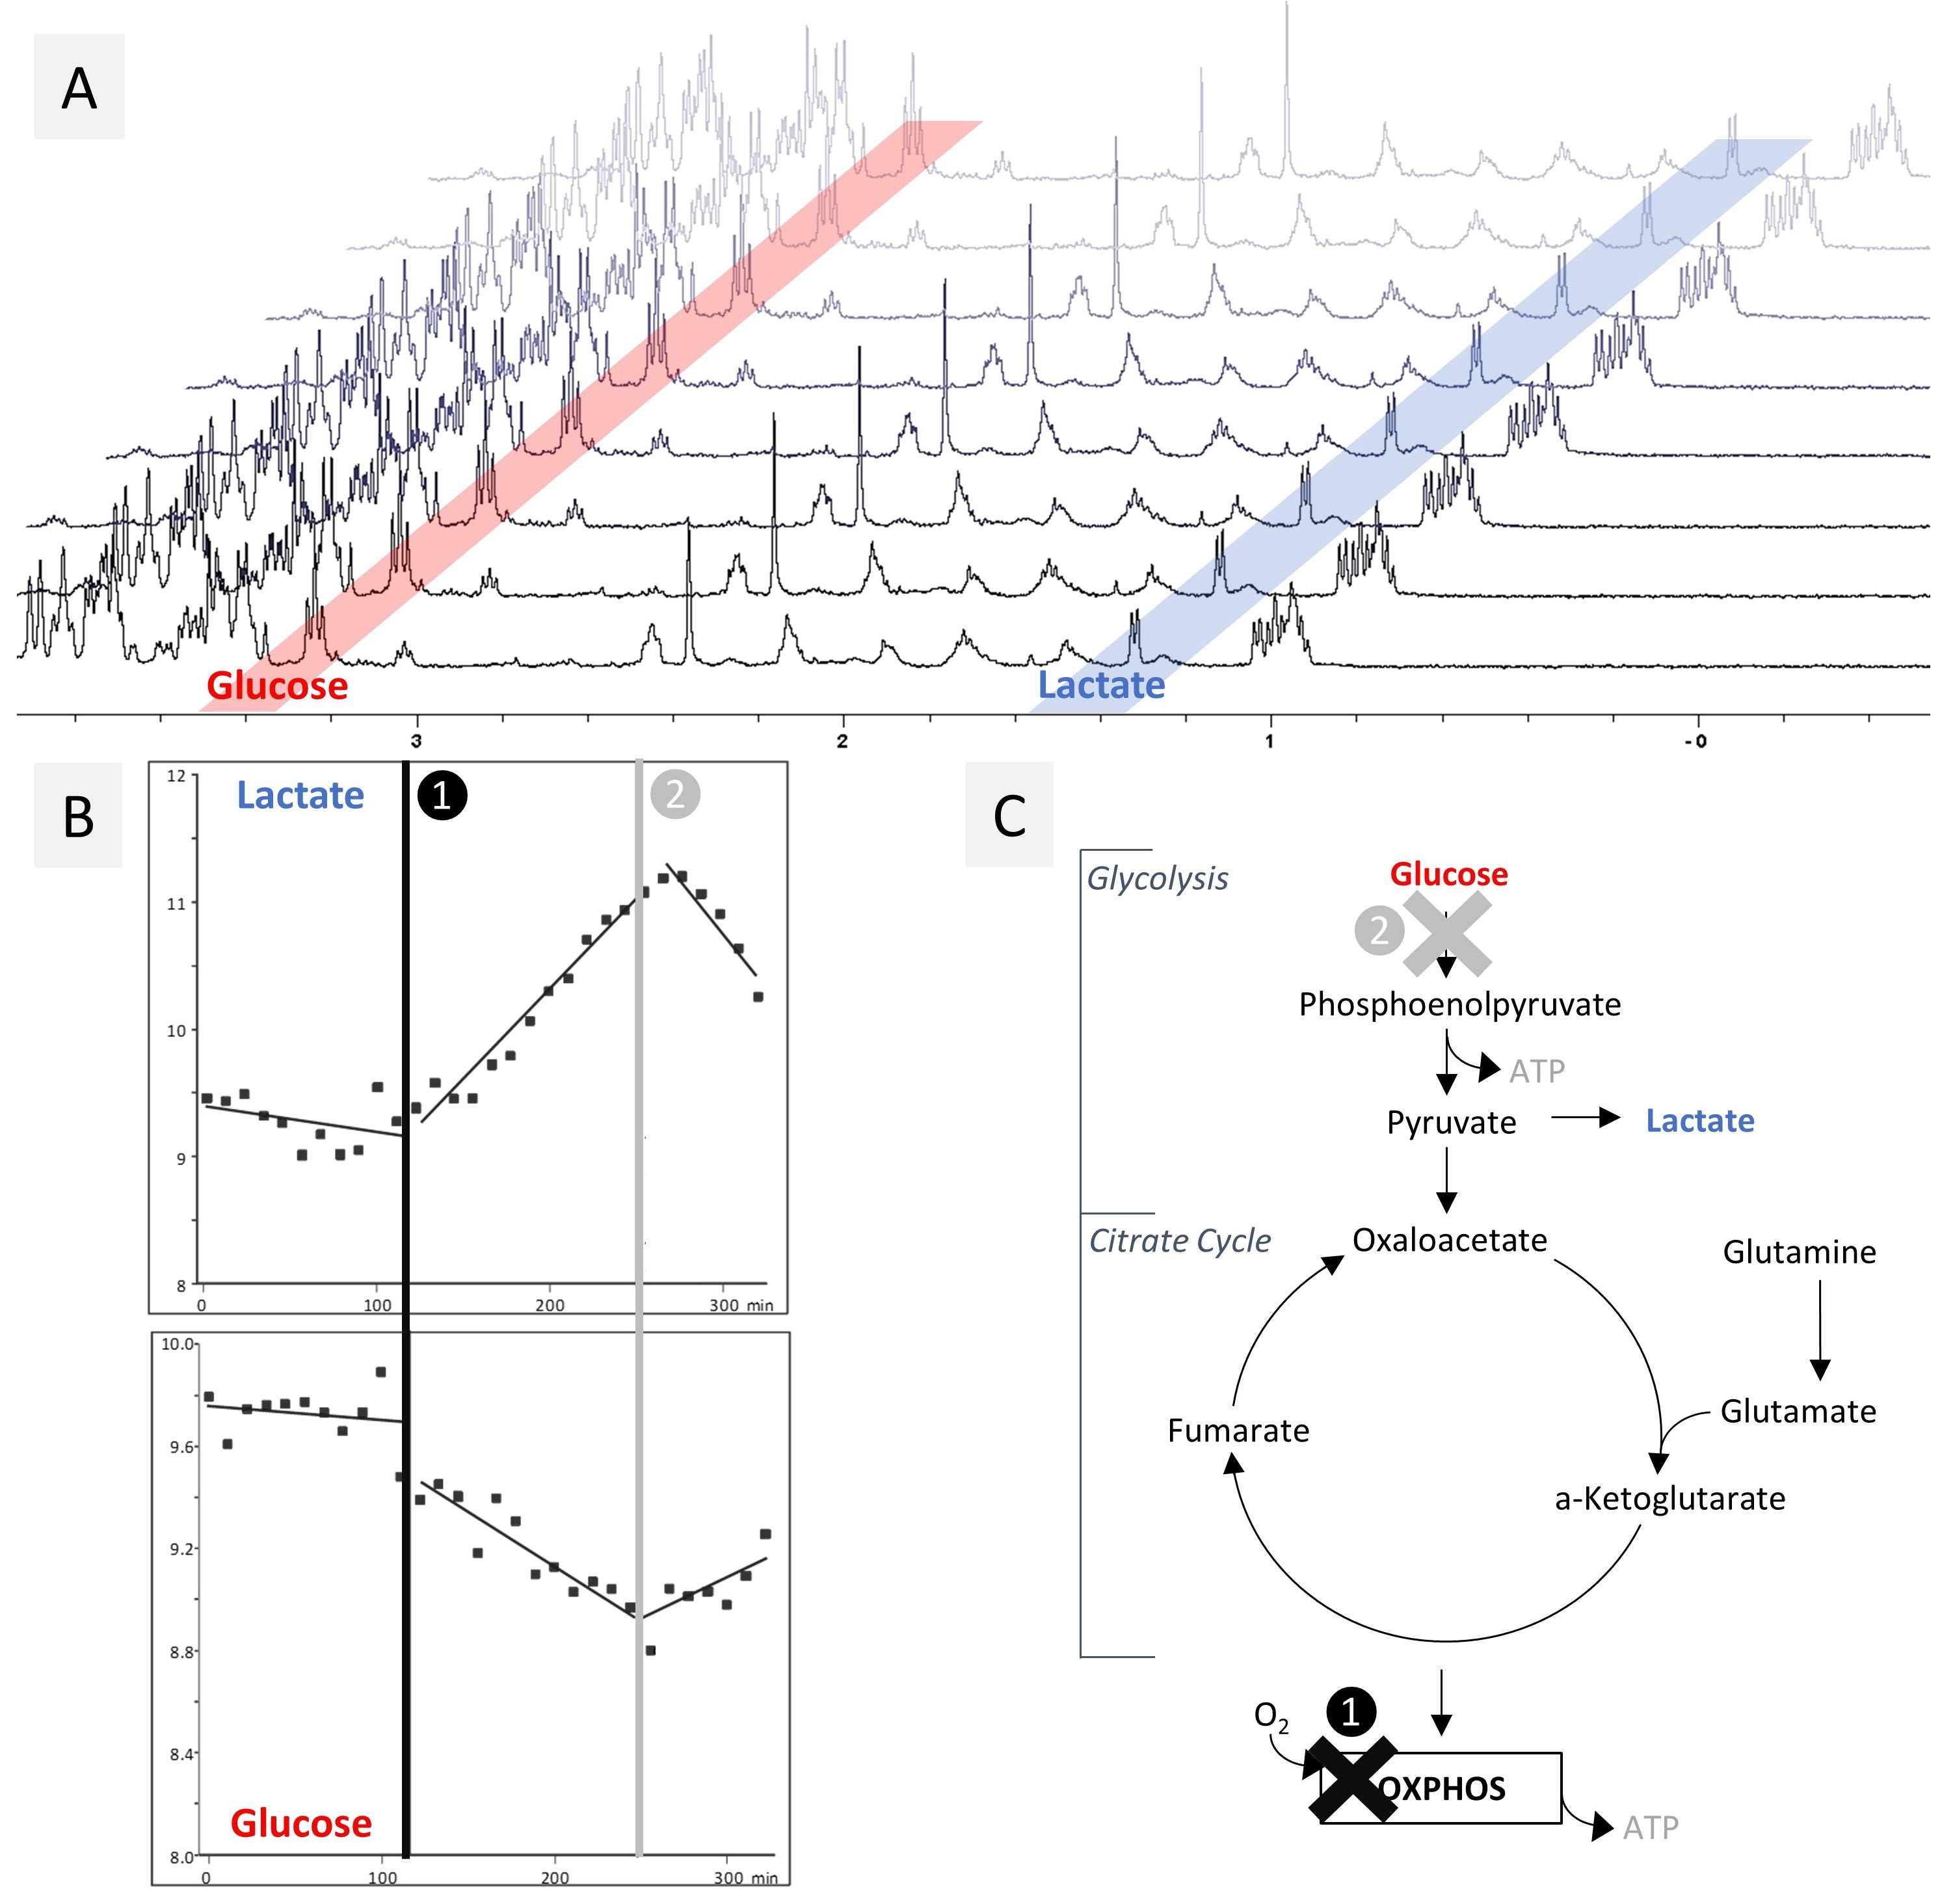
3.) Inhibitor experiment: Constant metabolic profile was recorded under flow for 2 hours (Figure 3). Subsequent addition of 2µM rotenone, a mitochondrial complex I inhibitor, resulted in an immediate alteration of glucose consumption and lactate production. This metabolic response could be reversed after additional selective inhibition of glycolytic pathways using 2-deoxy-D-glucose.
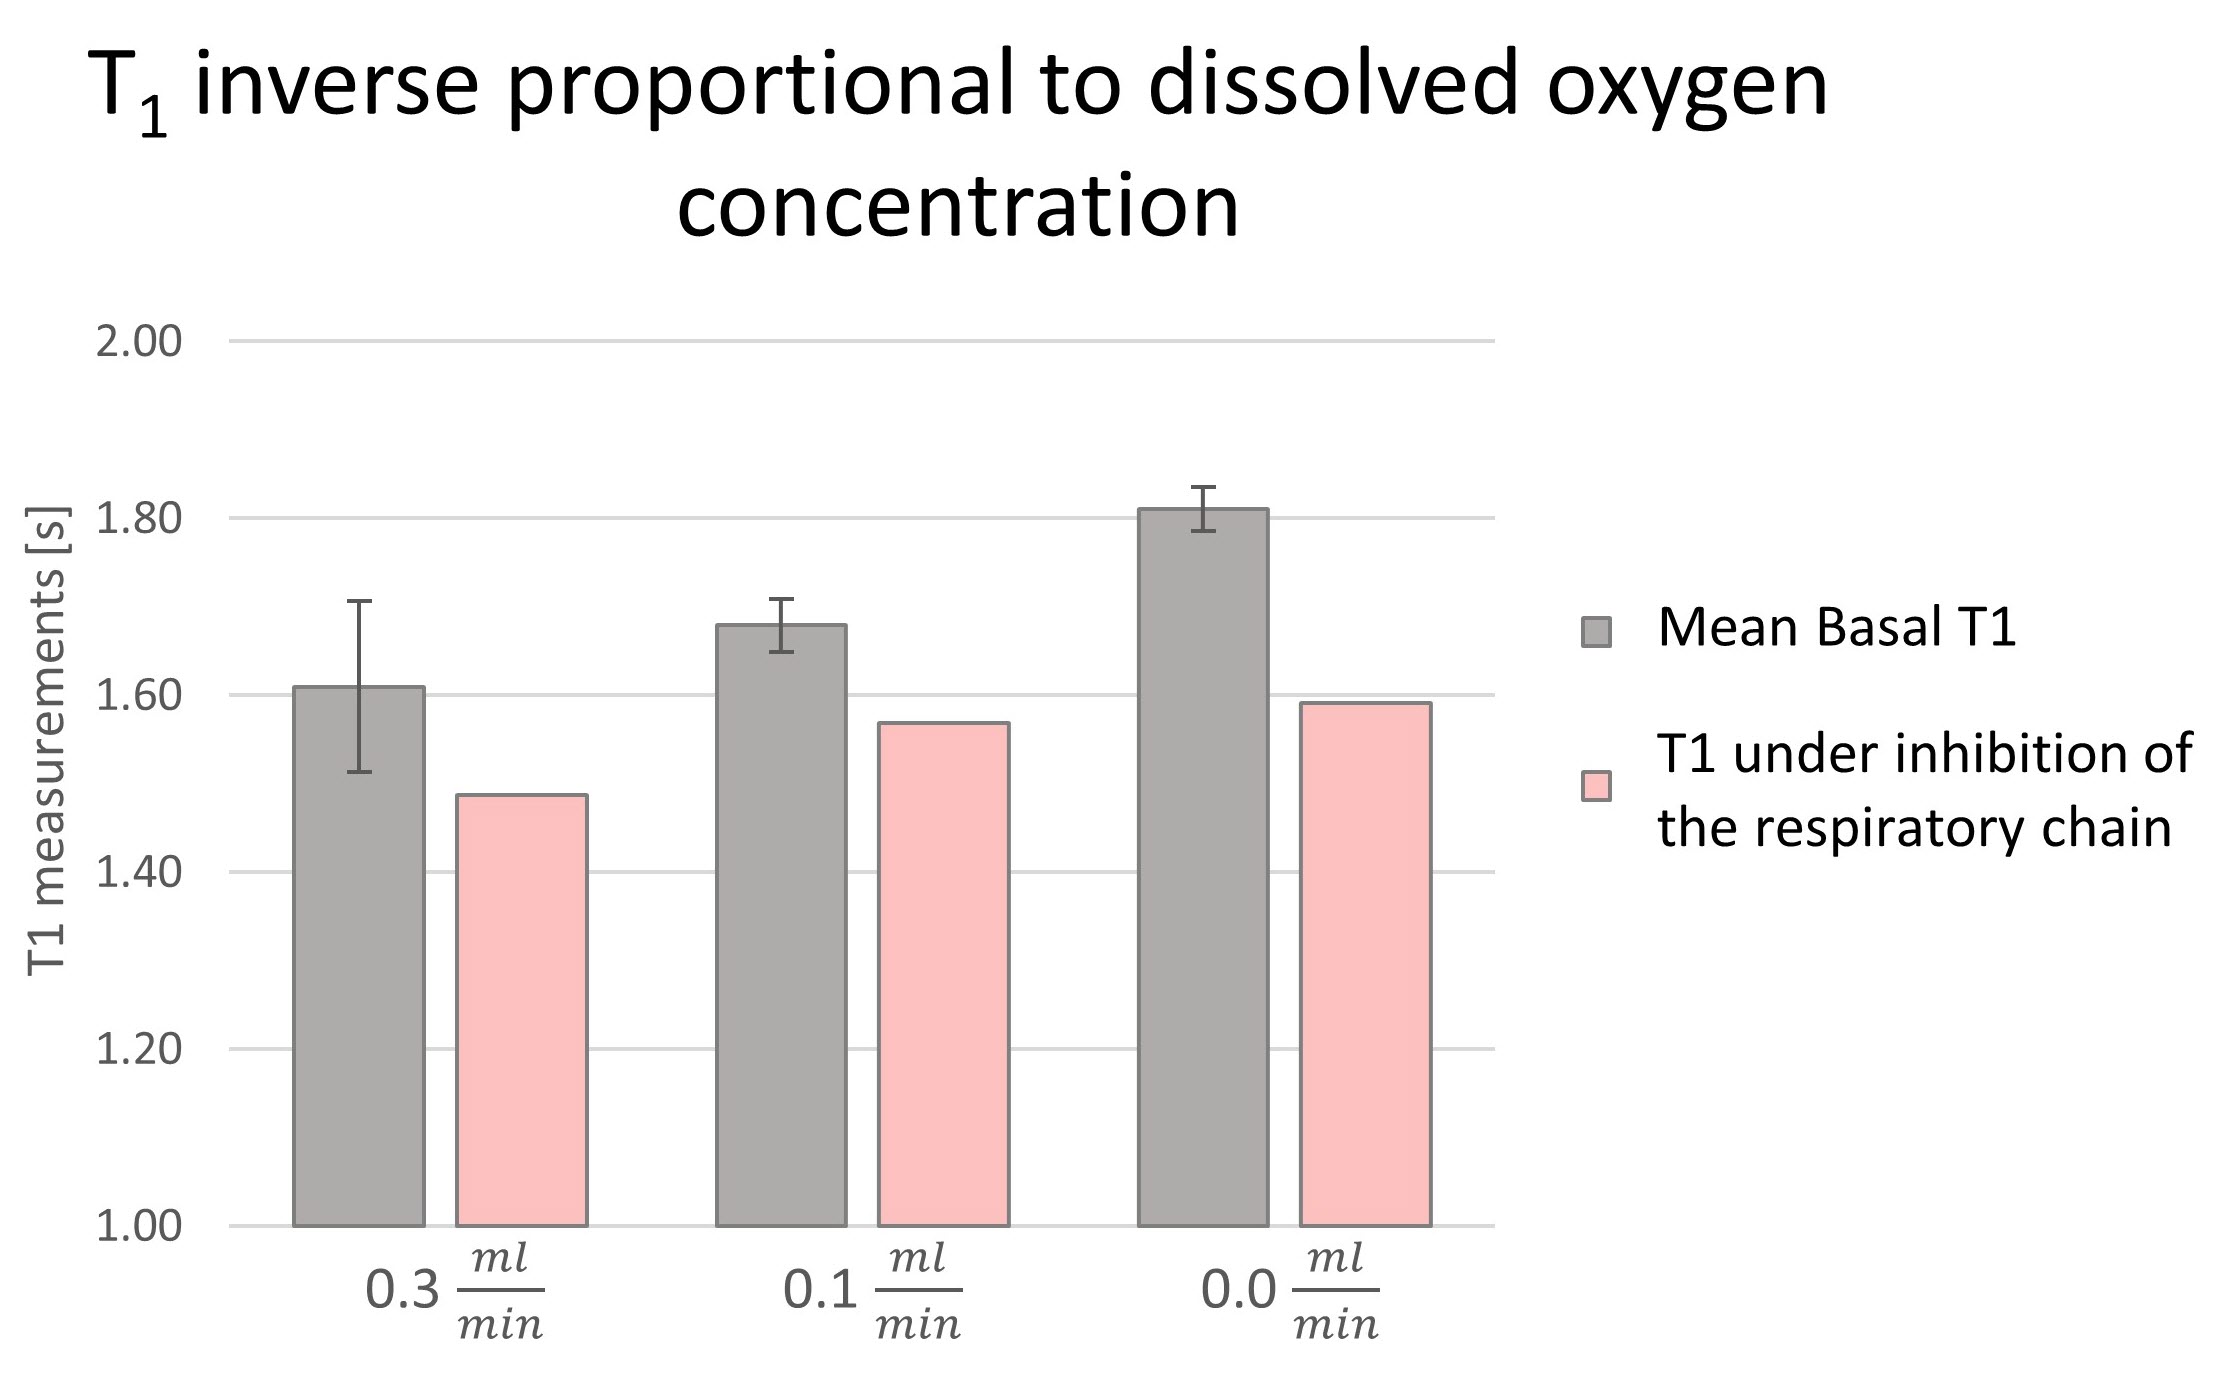
T1 experiments: In preliminary experiments, T1 relaxation times correlated negatively with the flow rate indicating lower oxygen content with reduced flow. Measurements were sensitive to chemical inhibition of aerobic metabolic pathways (Figure 4).
Discussion
In a substrate “stop-and-go” experiment, we demonstrate the technical feasibility of metabolic monitoring in 3D culture inside NMR at least up to 12 hours and caption of cellular response to tested interventions (Figure 2). Furthermore, it indicates high viability of cells within the tube because of the periodicity over 12h without amplitude change. Simultaneous detection of cellular oxygen consumption (via T1), allowed estimation of the remaining oxygen content during the experiments. The inhibitor experiment proved the sensitivity of the measurement to test pathway specific interventions (Figure 3). Shown sensitivity of T1 measurements to chemical inhibition (Figure 4) allows using T1 measurements for statements about the activity of aerobic metabolism.Conclusion
The preliminary results determine the feasibility of metabolome analysis in stable cell cultures and real time metabolic monitoring upon intervention with metabolic inhibitors in a bioreactor based on the InsightCell tool. In a proof of principle, it was possible to estimate cell respiration in culture media via detection of longitudinal T1 relaxation times under basal and inhibited condition.Acknowledgements
We thank Bruker for making the InsightCell tool available to us.References
1. Smith MJ, Marshall CB, Theillet FX, Binolfi A, Selenko P, Ikura M. Real-time NMR monitoring of biological activities in complex physiological environments. Curr Opin Struct Biol 2015; 32:39-47.
2. Santos SS, Leite SB, Sonnewald U, Carrondo MJT, Alves PM. Stirred vessel cultures of rat brain cells aggregates: Characterization of major metabolic pathways and cell population dynamics. Journal of Neuroscience Research 2007; 85 (15):3386-3397.
3. Mancuso A, Beardsley NJ, Wehrli S, Pickup S, Matschinsky FM, Glickson JD. Real-time detection of 13C NMR labeling kinetics in perfused EMT6 mouse mammary tumor cells and betaHC9 mouse insulinomas. Biotechnol Bioeng 2004; 87 (7):835-848.
4. Lundberg P, Roy S, Kuchel PW. Immobilization methods for NMR studies of cellular metabolism--a practical guide. Immunomethods 1994; 4 (2):163-178.
5. Shanks JV. In situ NMR systems. Curr Issues Mol Biol 2001; 3 (1):15-26.
6. Lerche MH, Jensen PR, Karlsson M, Meier S. NMR insights into the inner workings of living cells. Anal Chem 2015; 87 (1):119-132.
7. Aguilar JA, Nilsson M, Bodenhausen G, Morris GA. Spin echo NMR spectra without J modulation. Chemical Communications 2012; 48 (6):811-813.
8. Grucker D. Oxymetry by magnetic resonance: applications to animal biology and medicine. Progress in Nuclear Magnetic Resonance Spectroscopy 2000; 36 (3):241-270.
9. Dunn JF. Measuring oxygenation in vivo with MRS/MRI--from gas exchange to the cell. Antioxid Redox Signal 2007; 9 (8):1157-1168.
Figures