4374
Liver Fatty Acid Profile Mapping with Accelerated Free-Breathing Spectroscopic Imaging1Physics and Atmospheric Science, Dalhousie University, Halifax, NS, Canada, 2Biomedical Translational Imaging Centre (BIOTIC), Halifax, NS, Canada, 3Diagnostic Radiology, Dalhousie University, Halifax, NS, Canada, 4Biomedical Engineering, Dalhousie University, Halifax, NS, Canada
Synopsis
Fat composition in the liver, particularly the amount of polyunsaturated fat, may be important in characterizing NAFLD. Spatially resolved maps of unsaturation indices were generated using an accelerated free-breathing spin echo single point imaging technique. Multiple under-sampling patterns were acquired sequentially to ensure oversampling of the k-space centre even after retrospective motion correction. The technique was validated using a set of oil/water mixture phantoms and evaluated in an in vivo mouse study (N=8).
Introduction
The prevalence of non-alcoholic fatty liver disease (NAFLD) in developed countries is estimated at 20-40% and rising. In 10-20% of cases, NAFLD will progress to non-alcoholic steatohepatitis (NASH), liver fibrosis, or cancer.1, 2, 3 Detecting this progression is difficult since biopsy, the gold standard for grading and staging of NASH, is invasive and cannot be used for frequent follow-up of at-risk patients. Fat composition in the liver, particularly the amount of polyunsaturated fat, may be important in characterizing NAFLD.4 Single voxel MR spectroscopy can provide non-invasive estimates of fat composition, but with limited spatial coverage.
Spectroscopic imaging enables whole-liver fatty acid profile mapping, and purely phase encoded methods are resistant to field inhomogeneities caused by high iron concentrations that may be present in NALFD,5 though these methods are limited by long scan times. This study investigates the use of spin echo single point imaging (SESPI) with an accelerated and redundant phase encoding scheme to allow free-breathing acquisition with retrospective respiratory correction. This enables mapping of fat composition resistant to abdominal motion with the potential for clinically feasible scan times.
Methods
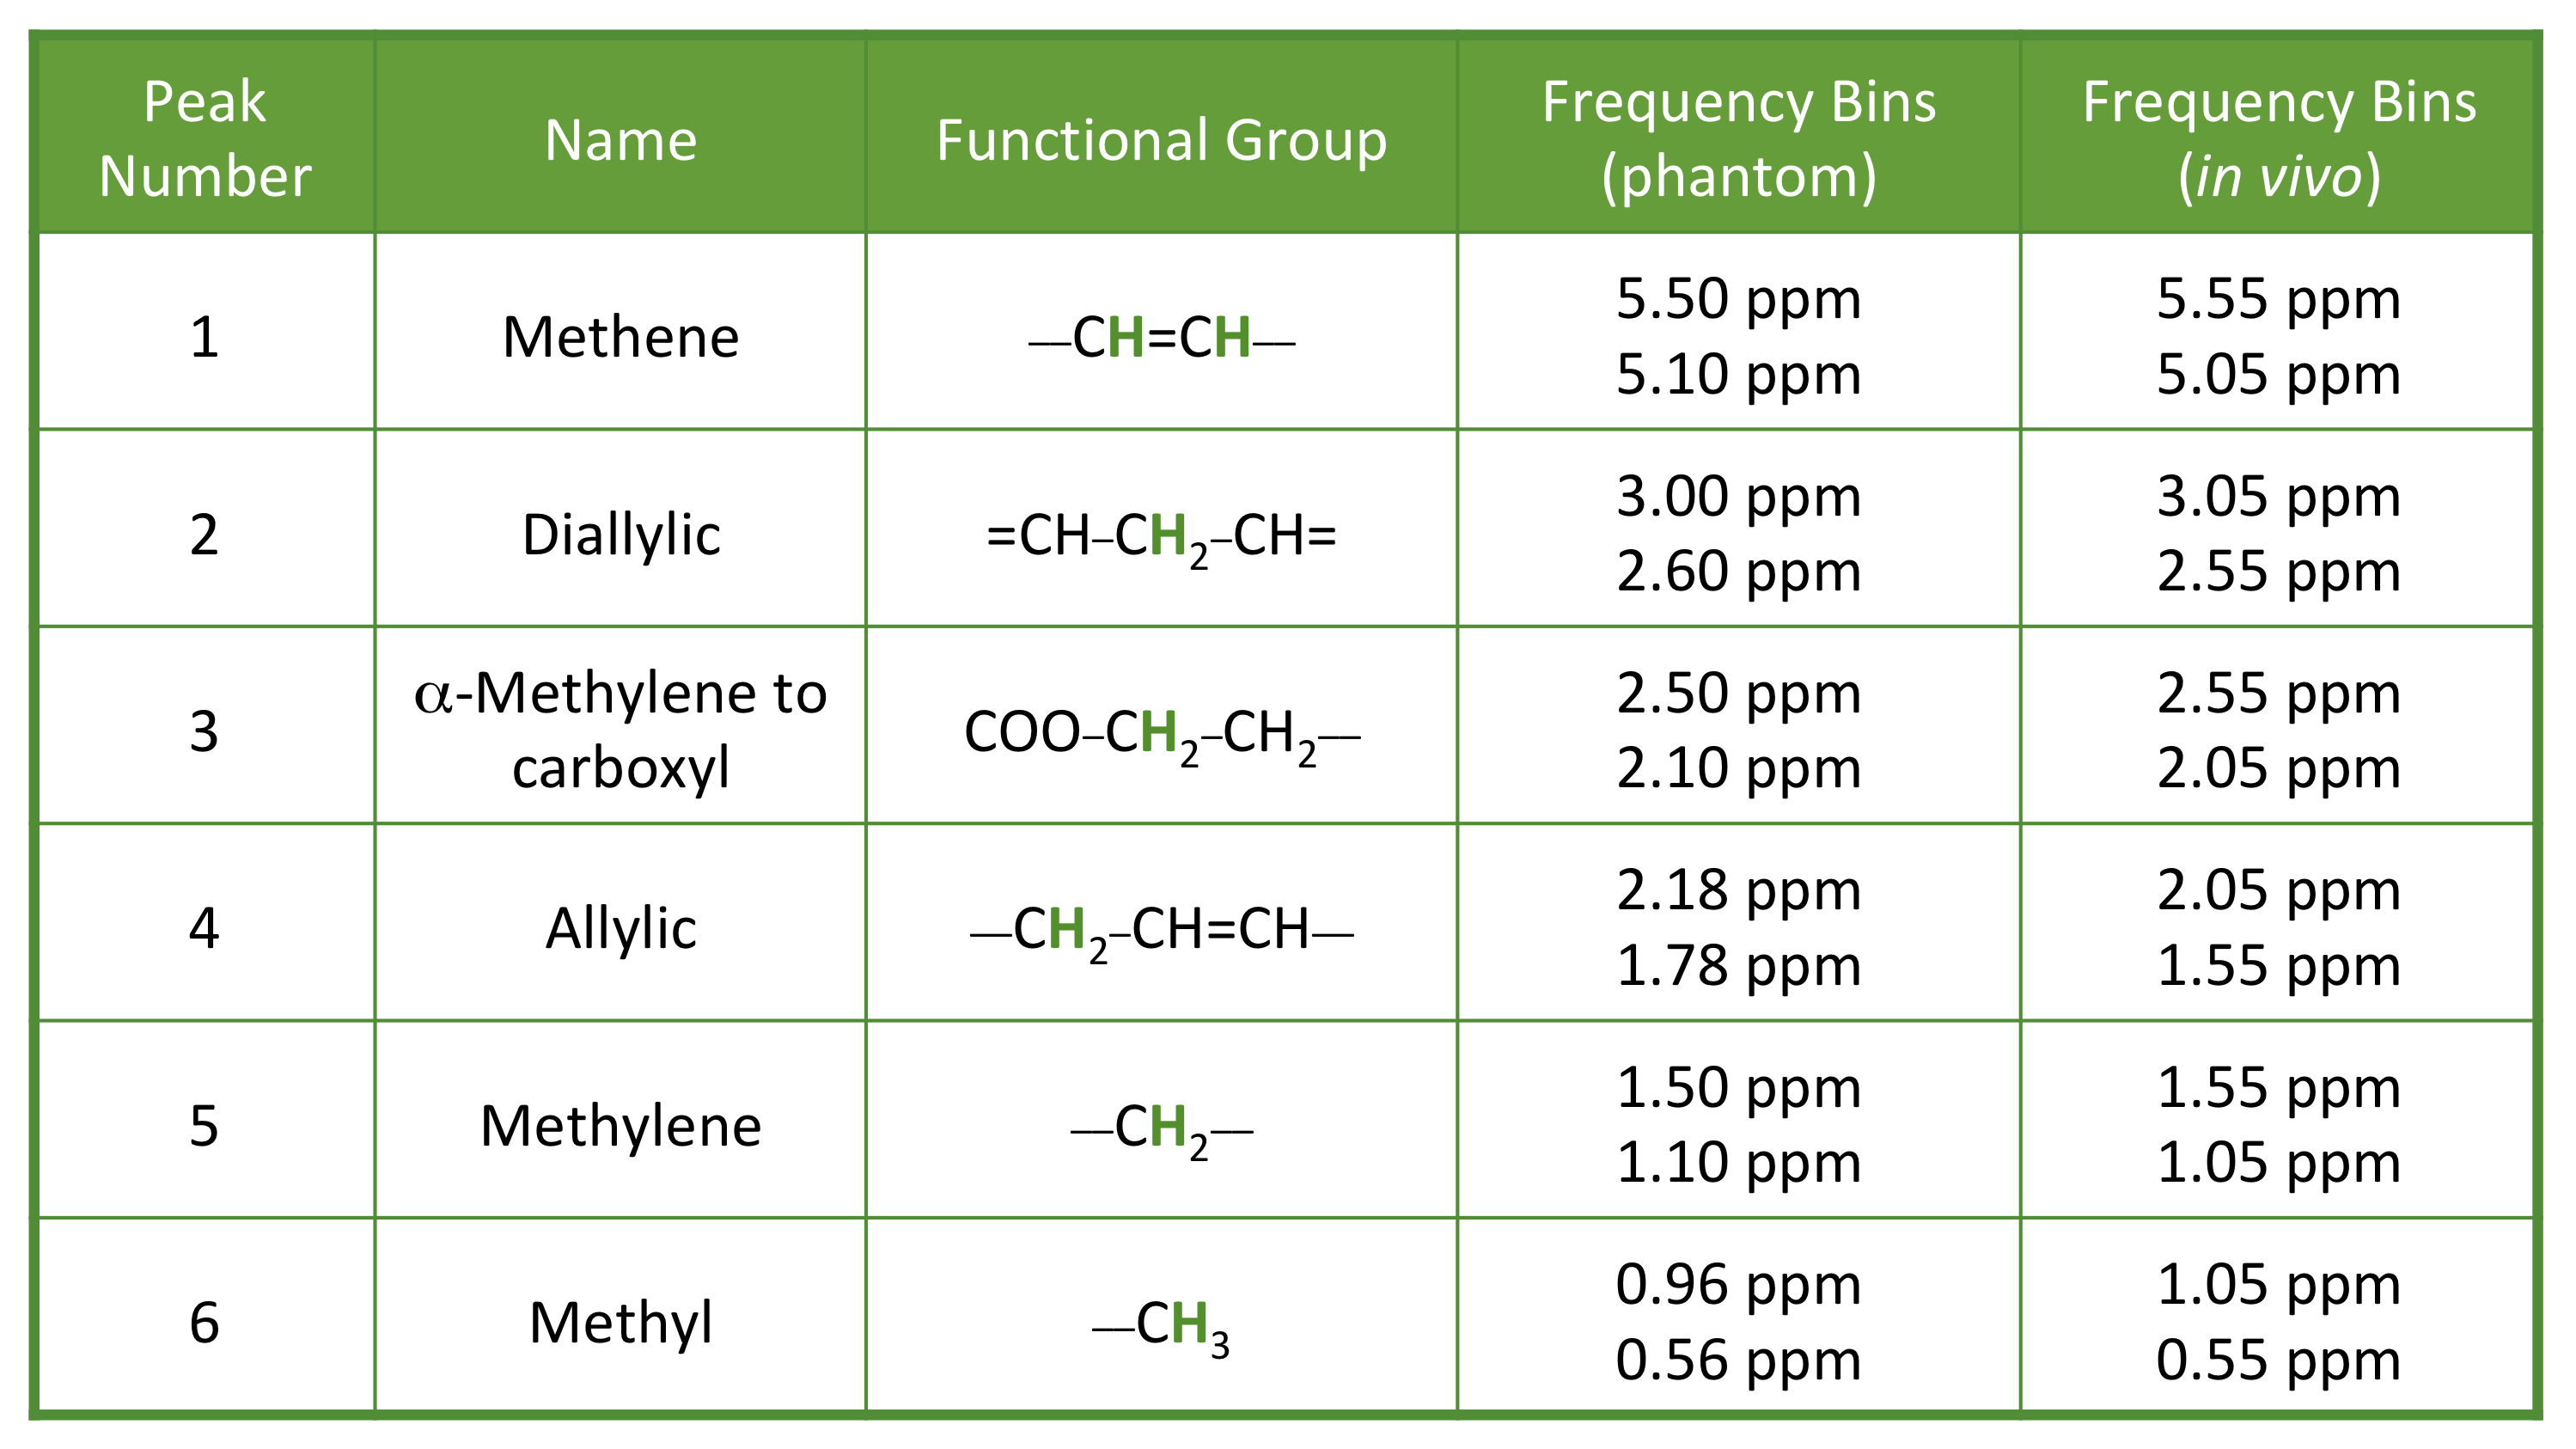
To accelerate acquisition, multiple under-sampling patterns based on CIRcular Cartesian Undersampling (CIRCUS)6 were acquired sequentially, ensuring oversampling of the k-space center even after removal of motion-corrupted points. Blind compressed sensing (CS) was used for reconstruction.7 Spectra were processed using a Hankel singular value decomposition (HSVD) based binning algorithm that computed the relative amplitudes of six fat peaks, described in Table 1, and the water peak. Fat fraction was computed as the sum of all identified fat peaks divided by the sum of all identified peaks. The unsaturation index (UI), surrogate unsaturation index (UIs), and polyunsaturation index (PUI) were calculated as in Johnson et al.4
CS-SESPI fat composition measurements were evaluated on a 3T preclinical MRI system (Oxford Instruments/Agilent) using a set of oil/water mix phantoms (100%, 20%, 15%, 10%, and 5% soybean oil), and a mouse model of fatty liver disease. SESPI images had TR/TE=200/13 ms and matrix size 64x64 (13.5 min fully-sampled) or 64x64x16 (55 min at 4X under-sampled, ~5.5X under-sampled following respiratory correction). PRESS voxels were acquired for comparison in both cases, with TR matched to SESPI in phantoms and TR=10 s in mice. In the latter case, SESPI-derived fat fractions were corrected for T1 saturation effects to enable direct comparison.
Oil/water phantoms were scanned 5 times to assess reproducibility. Images were retrospectively undersampled 5.5X and reconstructed with Blind-CS to assess the impact on quantification.
For the in vivo study, mice were divided into two groups (each N=4 mice), with one receiving a normal diet (scanned 2X, 1 week apart) and the other a methionine and choline deficient (MCD) diet (scanned 3X, at 0, 4, and 11 days following the start of the diet). Livers were excised following the final scan and ex vivo PRESS measurements of the entire liver acquired for comparison.
Results and Discussion
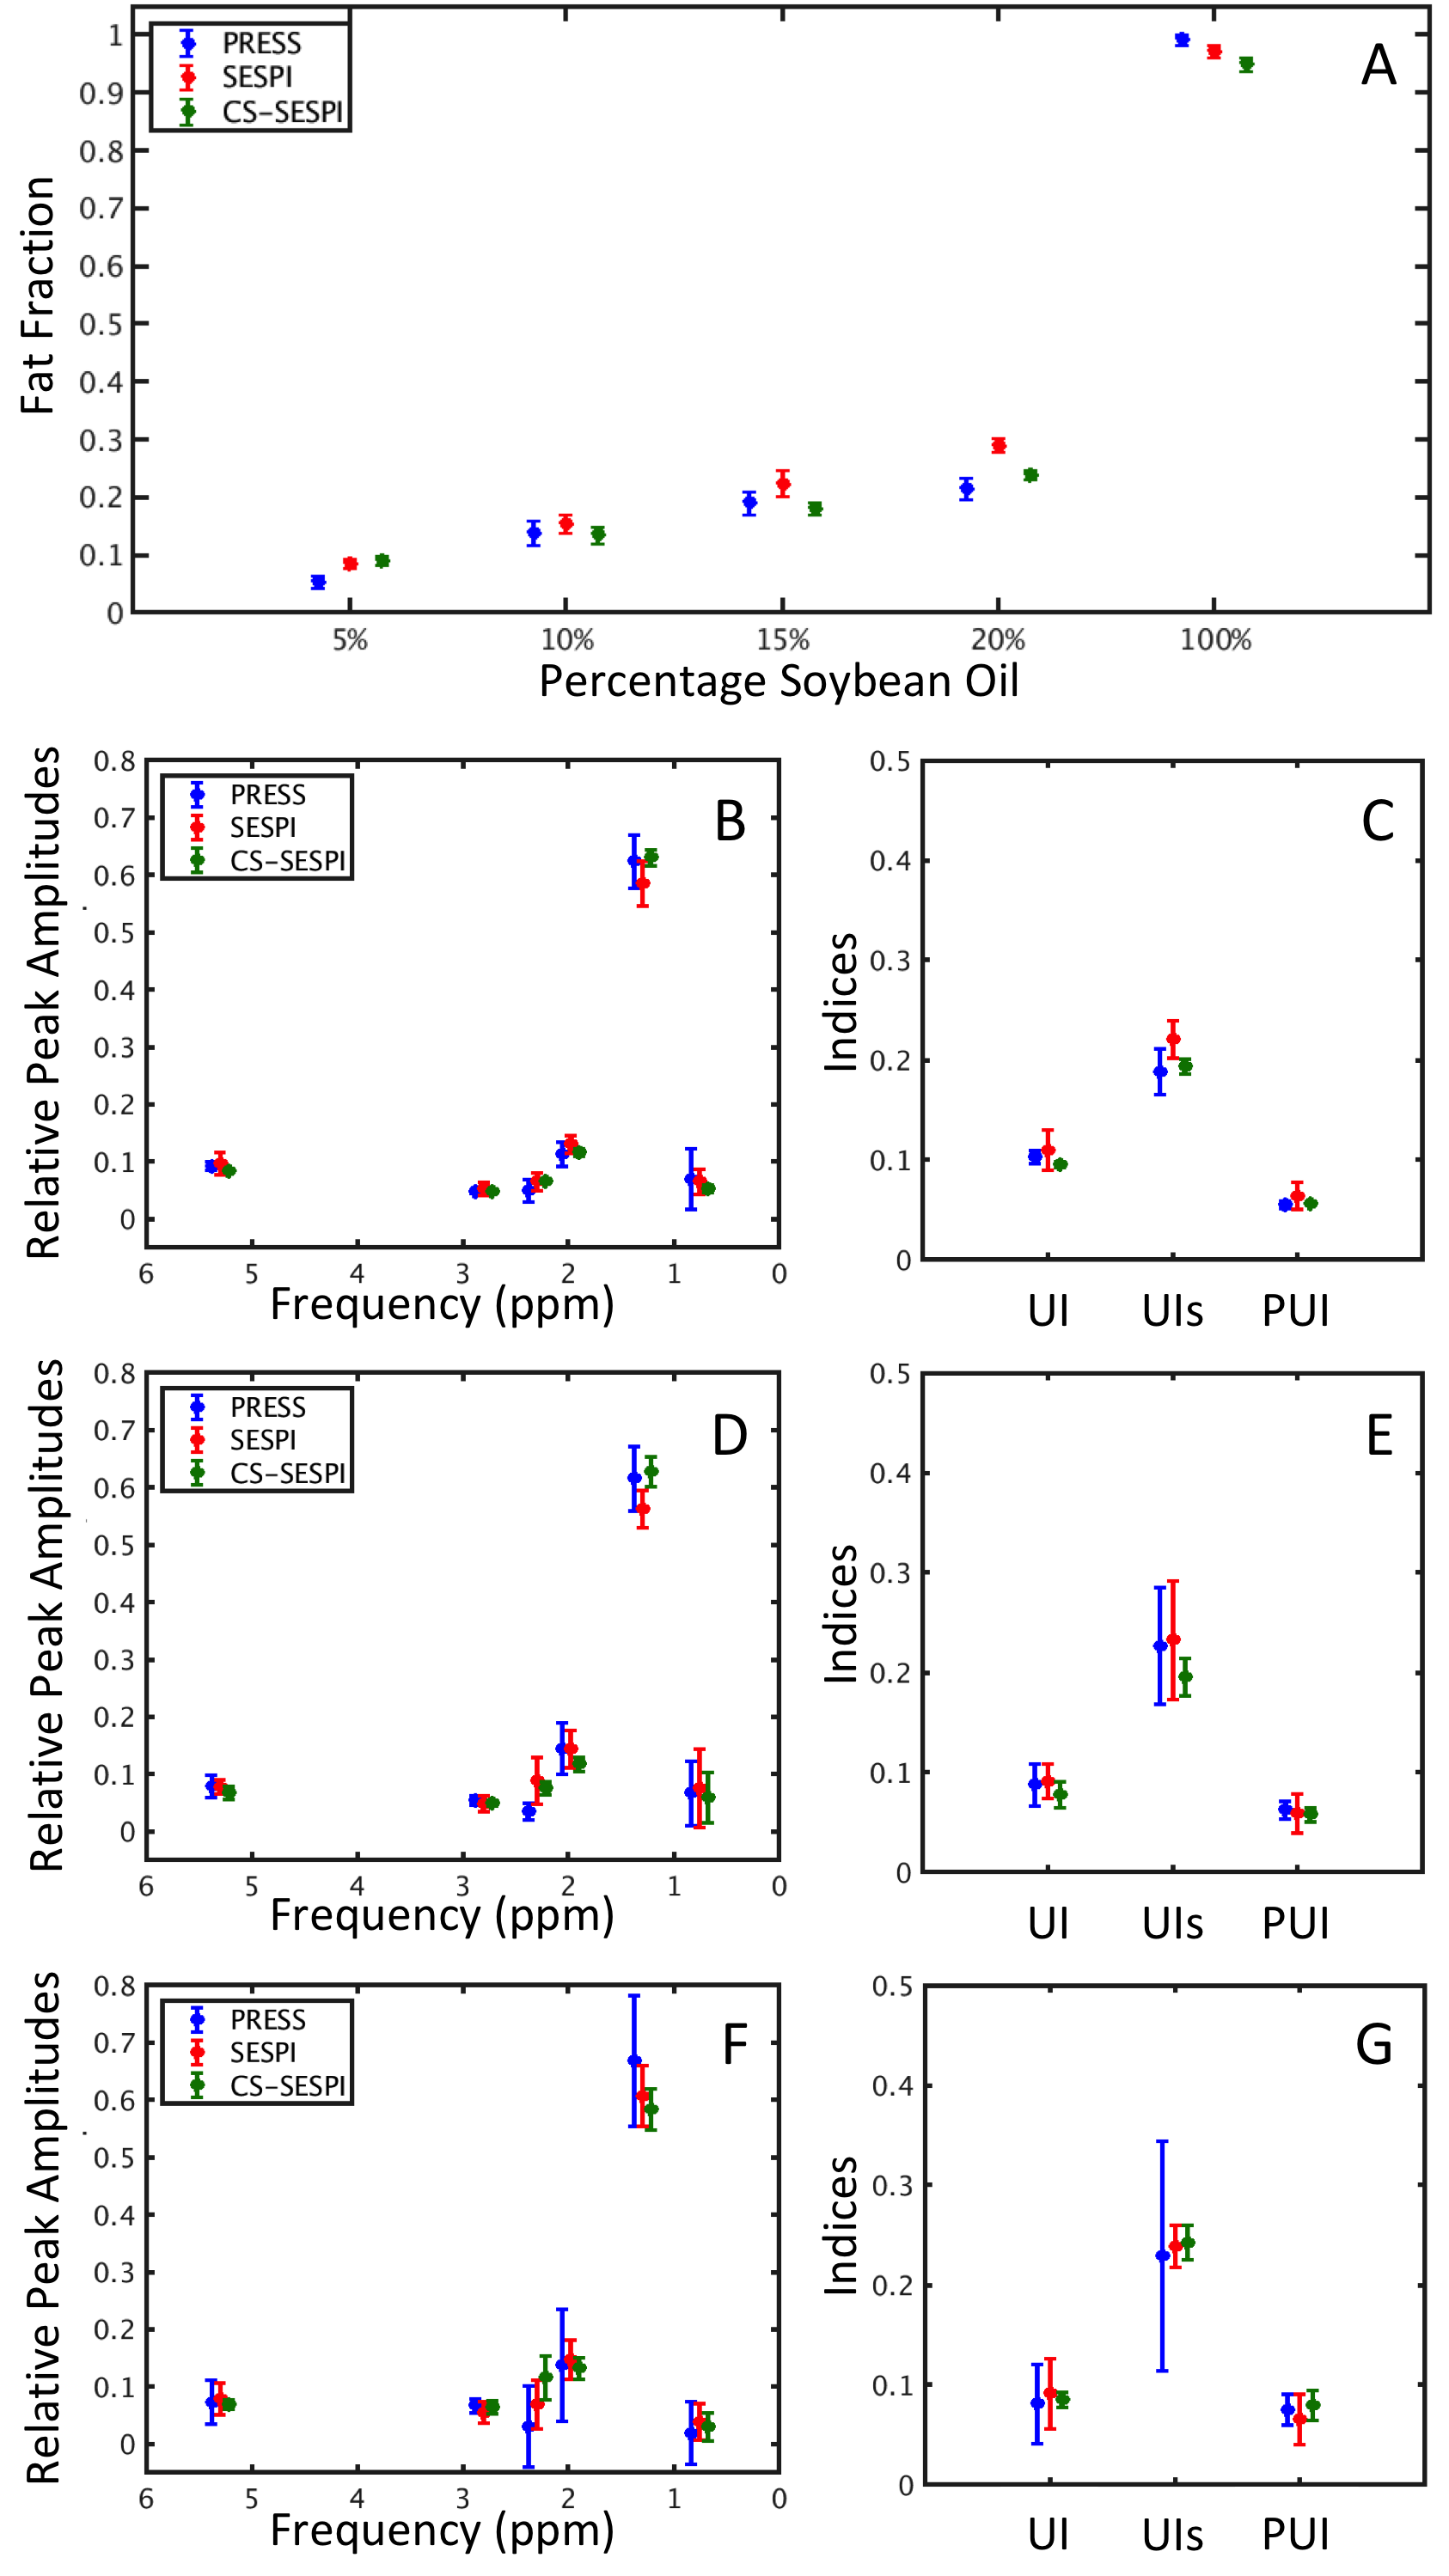
SESPI-derived peak amplitudes and unsaturation indices for oil/water phantoms are given in Figure 1 with corresponding PRESS-derived values. The fat fraction estimate for some tubes differed after acceleration and CS reconstruction (aliased signal from adjacent tubes not fully removed), though remained comparable to PRESS. Fat composition and unsaturation indices measured using the two techniques were not significantly different, even after CS acceleration. Variation between scans was often larger for the PRESS measurements, likely due to higher B0 inhomogeneity in the voxel.
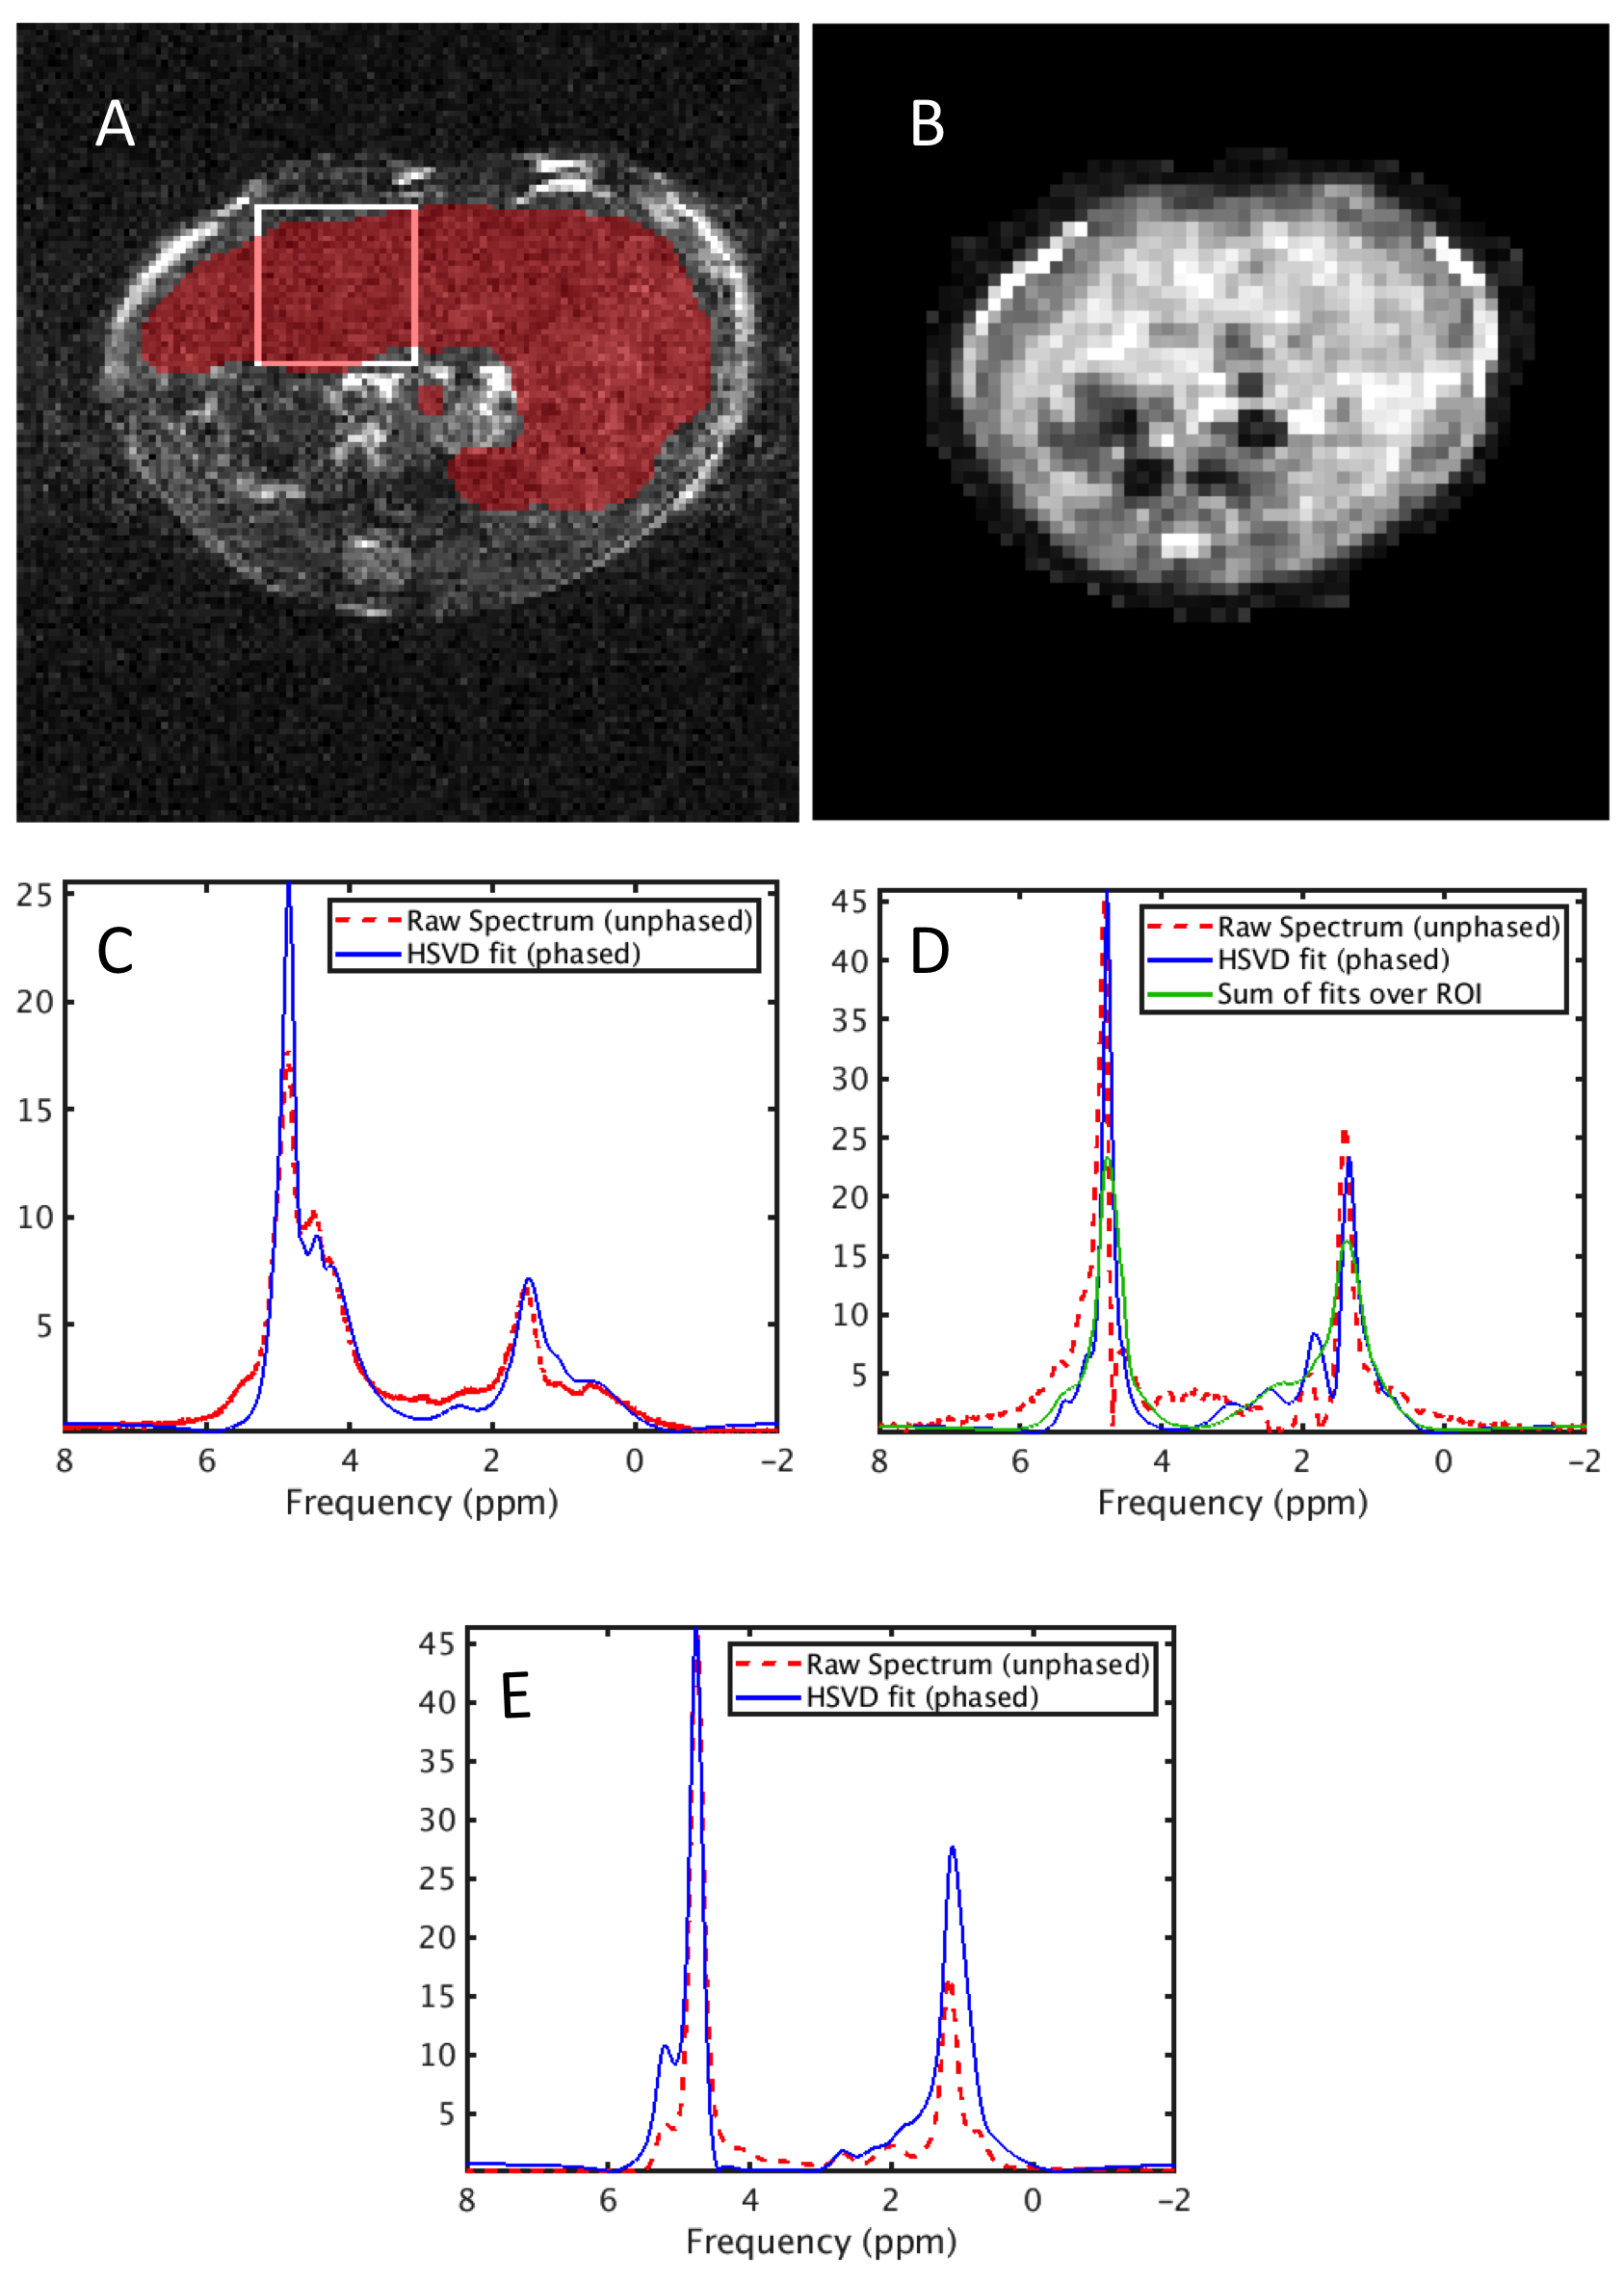
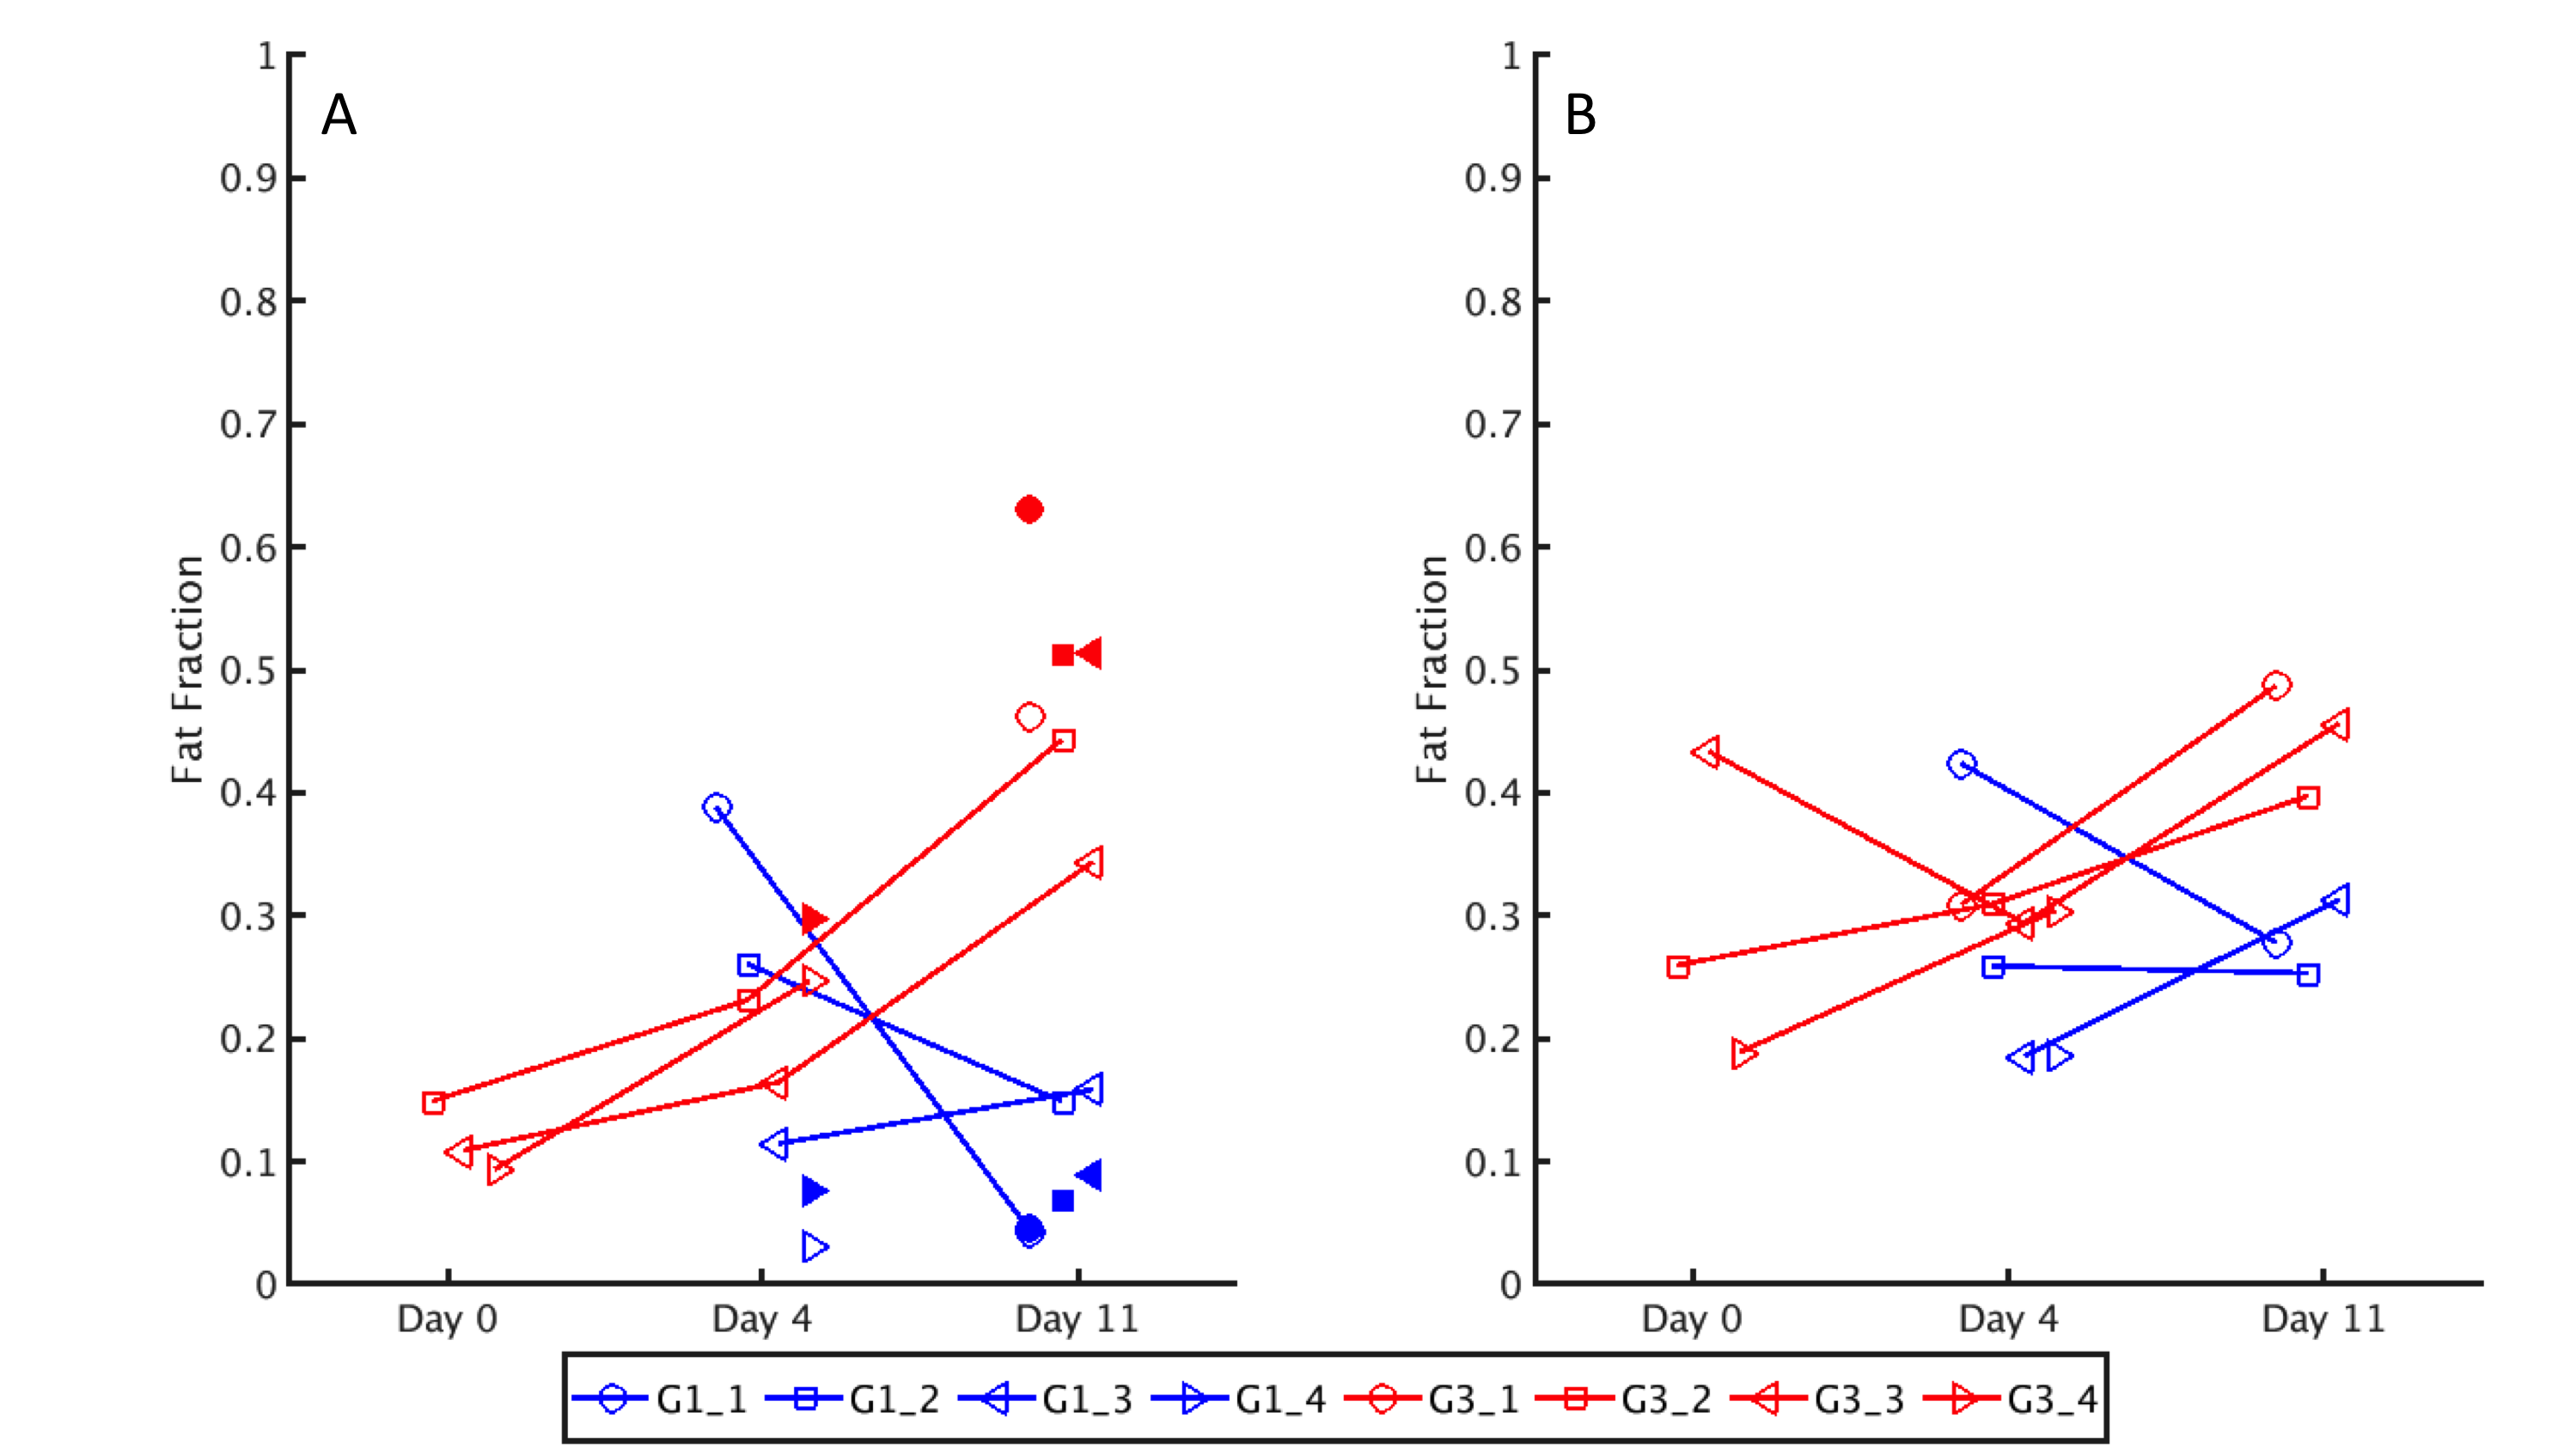
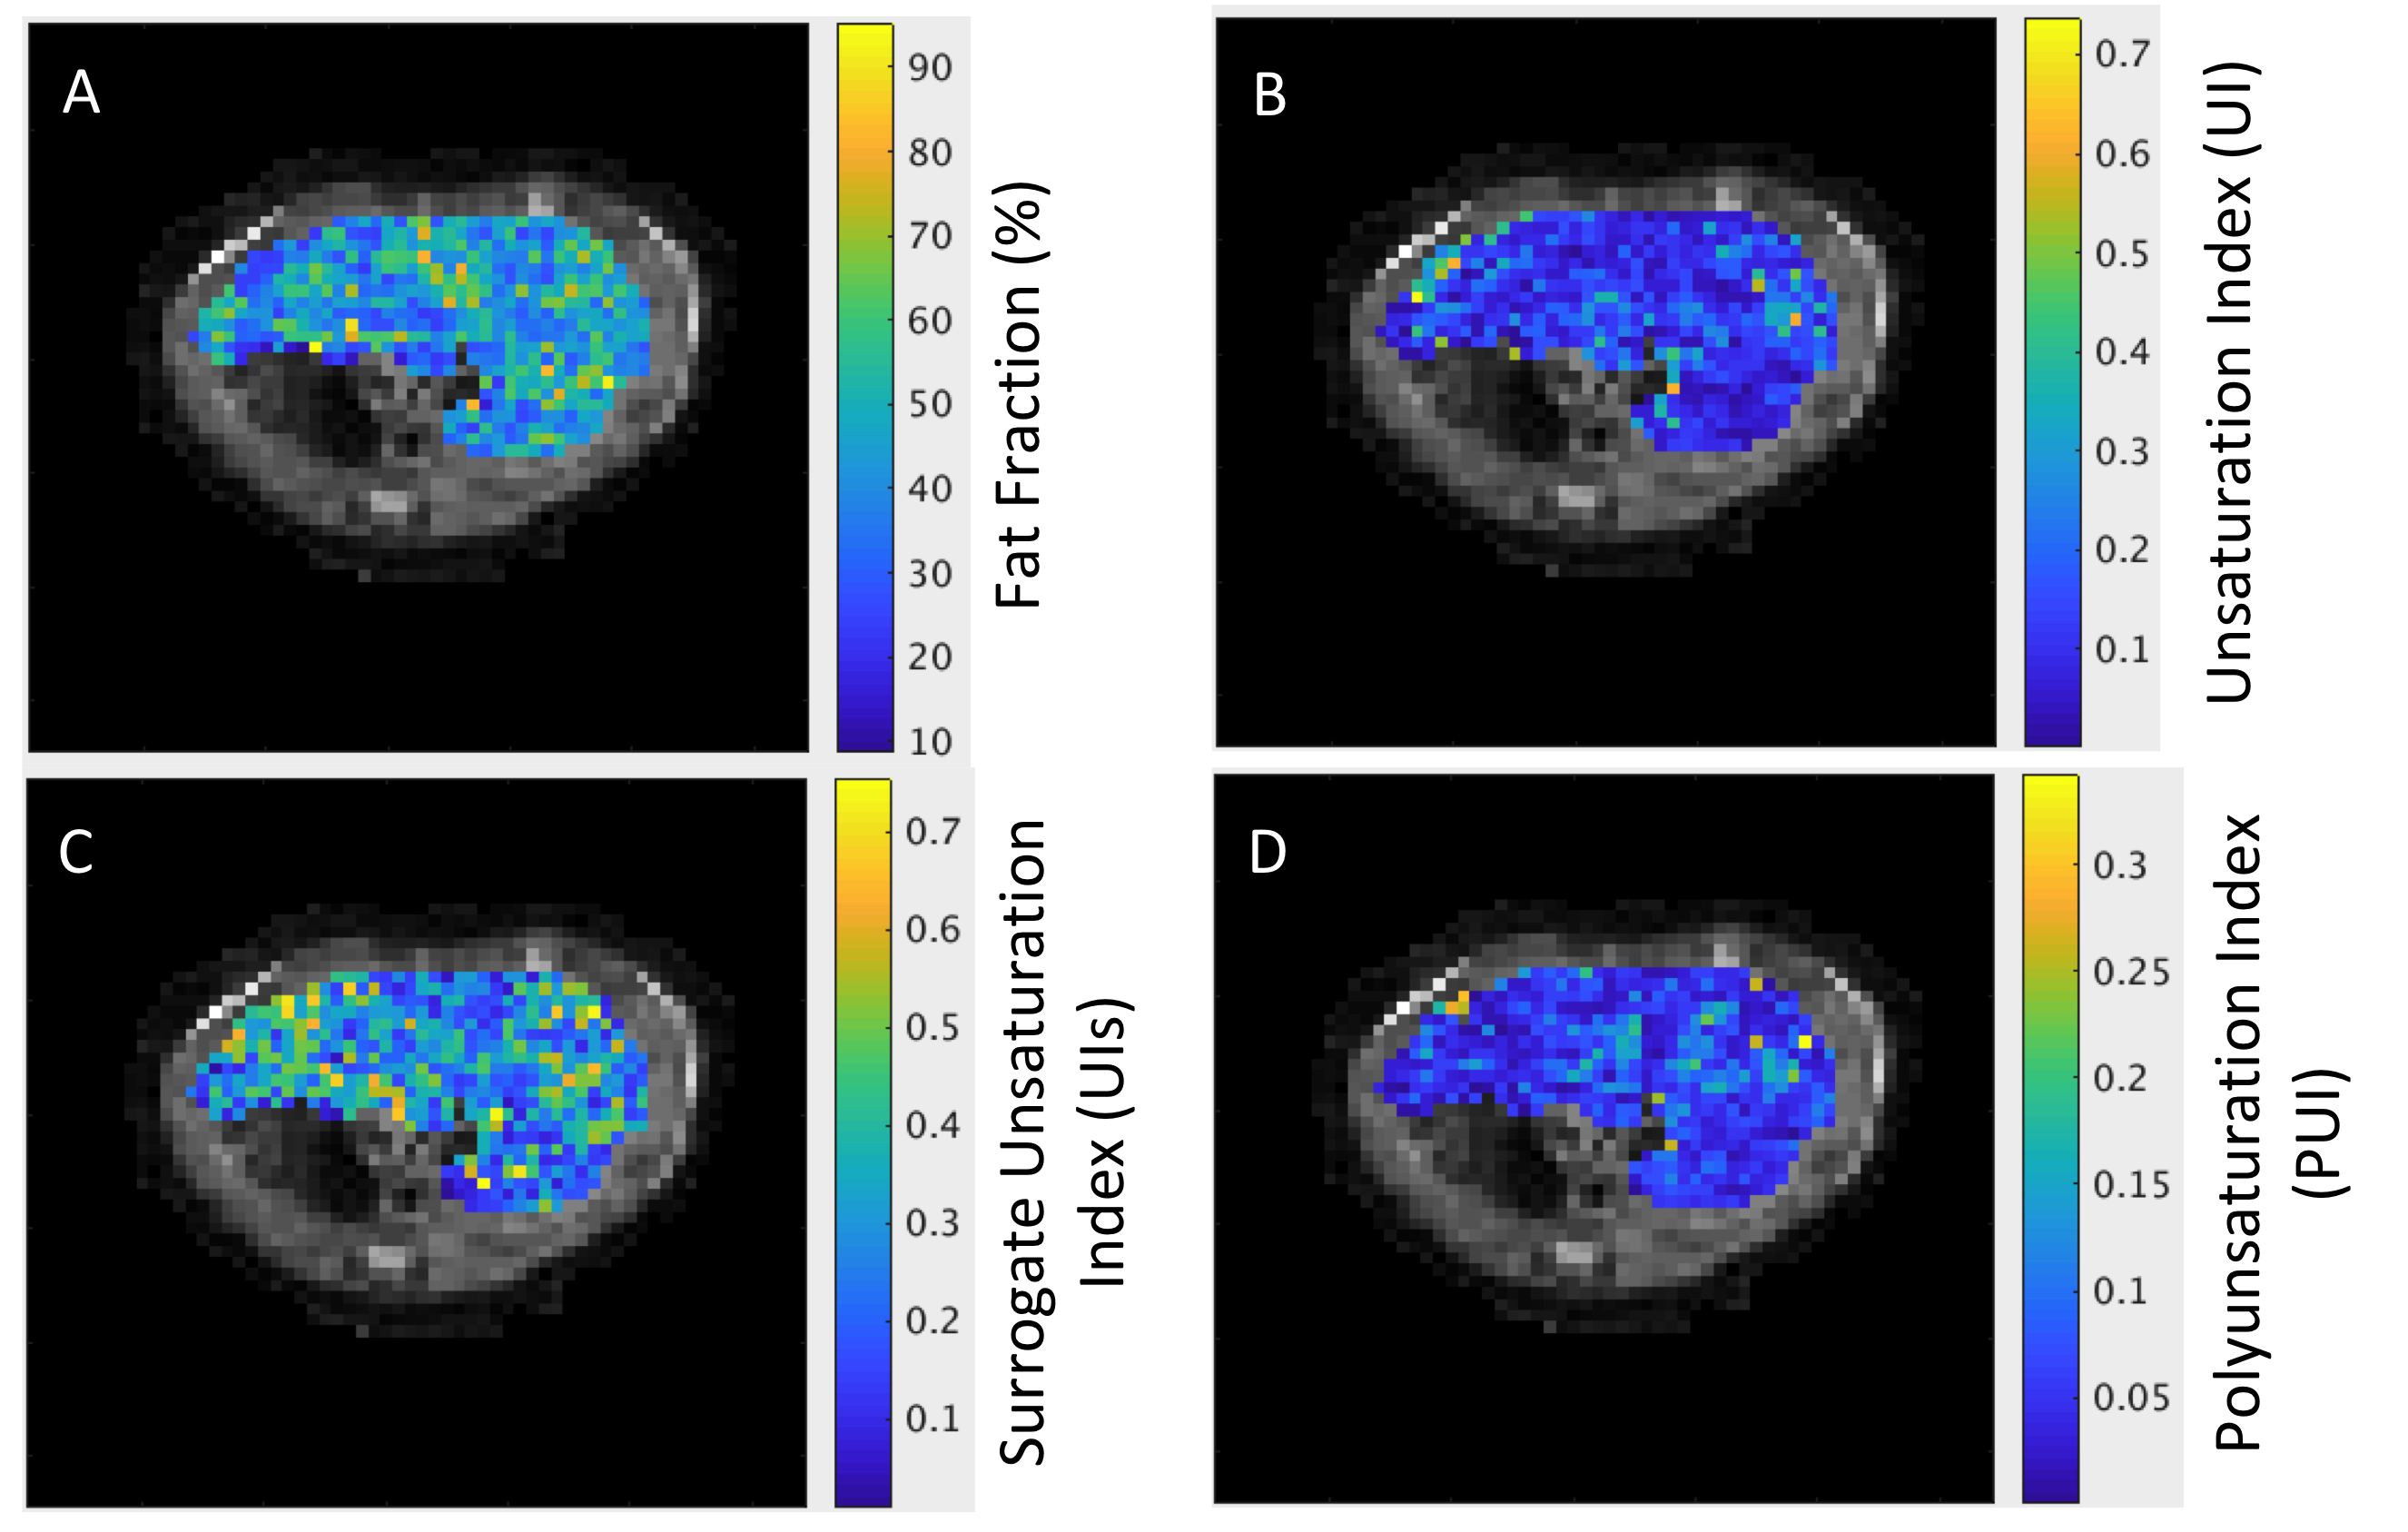
Results for one mouse are shown in Figure 3. As suspected based on phantom data, the quality of in vivo PRESS spectra was often limited by shim, seen here in the form of water peak splitting. Fat fraction results for all mice are given in Figure 4. The expected increase in liver fat in mice that received the MCD diet was observed using all three techniques, although the observed change was largest using ex vivo PRESS measurements and smallest using CS-SESPI. No trends were observed in UI, UIs, or PUI over time; however, this is likely because the MCD diet does not induce the same pathological changes that occur in the progression of naturally occurring NAFLD. SESPI-derived maps of fat fraction and unsaturation indices for one mouse are given in Figure 4, showing some heterogeneity across the liver that remains to be explored.
Conclusion
CS-SESPI provides spatially resolved fat composition information across the liver, including maps of unsaturation indices that could be biomarkers for NAFLD progression. This pre-clinical implementation demonstrates acceptable resolution and resistance to respiratory motion, and the addition of parallel imaging will allow ~10 minute scan times to enable clinical evaluation.Acknowledgements
This work has been funded by GE Healthcare and the Atlantic Innovation Fund. SD Beyea is supported by an NSERC Discovery Grant. M Hewlett is supported by an NSERC Canada Graduate Scholarship (Master's Program) and an Izaak Walton Killam Predoctoral Scholarship.References
- G.C. Farrell, A.J. McCullough, and C.P. Day, Non-Alcoholic Fatty Liver Disease: A Practical Guide, 1st Ed. (John Wiley & Sons, West Sussex, UK, 2013).
- M.E. Rinella, Nonalcoholic Fatty Liver Disease: A Systematic Review, Journal of the American Medical Association 313(22), 2263 (2013).
- T. Okanoue et al., Nonalcoholic fatty liver disease and nonalcoholic steatohepatitis in Japan, Journal of Gastroenterology and Hepatology 26(Suppl. 1), 153 (2011).
- N.A. Johnson et al., Noninvasive Assessment of Hepatic Lipid Composition: Advancing Understanding and Management of Fatty Liver Disorders, Hepatology 47(5), 1513 (2008).
- Chitturi et al., HFE Mutations, Hepatic Iron, and Fibrosis: Ethnic-Specific Association of NASH With C282Y but Not With Fibrotic Severity, Hepatology 36(1), 142 (2002).
- J. Liu and D. Saloner, Accelerated MRI with CIRcular Cartesian UnderSampling (CIRCUS): a variable density Cartesian sampling strategy for compressed sensing and parallel imaging, Quantitative Imaging in Medicine and Surgery 4(1), 57 (2014).
- S. Bhave et al., Accelerated Whole-Brain Multi-parameter Mapping Using Blind Compressed Sensing, Magnetic Resonance in Medicine 75, 1175 (2016).
- M. Bydder et al., Sources of systematic error in proton density fat fraction (PDFF) quantification in the liver evaluated from magnitude images with different numbers of echoes, NMR in Biomedicine 31, e3843 (2018).
Figures