4367
In vivo detection and quantification of plaque rupture using a novel fibrin-binding PET tracer1Athinoula A. Martinos Center for Biomedical Imaging, MGH / Harvard Medical School, Charlestown, MA, United States, 2Department of Medicine, Massachusetts General Hospital, Boston, MA, United States, 3Gordon Center for Medical Imaging, Massachusetts General Hospital, Boston, MA, United States
Synopsis
Detecting high-risk atherosclerotic plaques prone to rupture is still one of the main challenges in cardiovascular imaging that could help save many lives.
This study presents a novel fibrin-binding positron emission tomography (PET) radiotracer, 68Ga-CM246, which allows accurate detection and quantification of plaque rupture in an animal model of atherosclerosis using simultaneous PET/MRI. Our in vivo PET results show that 68Ga-CM246 is highly sensitive and very specific to fibrin clots in ruptured plaques.
Our results confirm the potential of the 68Ga-CM246 to translate into the clinic to identify in humans those plaques at risk of rupture showing intraplaque hemorrhage.
Introduction
Atherosclerosis is one of the leading causes of mortality and morbidity in the world. High-risk plaques have already been shown previously not to correlate with the degree of stenosis, but rather with their composition (fibrous cap, necrotic core, presence of hemorrhage, monocyte/macrophage content, etc) 1-4. Use of positron emission tomography (PET) has previously shown its ability to accurately quantify macrophage content using 18F-FDG tracer to measure inflammation 5-7. However the two most important hallmarks of high-risk plaques are intraplaque hemorrhage and evidence of prior rupture.
We present in this study a novel fibrin-binding PET radiotracer, 68Ga-CM-246, that allows for in vivo detection and quantification of plaque rupture in an animal model of plaque rupture in atherosclerosis.
Materials and Methods
Fifteen (N=15) NZW rabbits were fed with a high cholesterol diet (HCD) for 8 weeks followed by normal chow diet for 2 weeks. All animals underwent balloon endothelial denudation of the abdominal aorta (at week 2) to induce advanced atherosclerotic plaque development. At week 10, animals were randomly assigned to a Control group (N=4) or to a Plaque Rupture group (N=11) in which rupture of plaque was triggered by Russell’s viper venom and histamine. All animals were scanned on a dedicated brain PET/MRI prototype called brainPET (Siemens, Healthineers, Erlangen) following an injection of 68Ga-CM246. In vivo PET images were acquired for one hour in lismode. In order to capture the whole dynamic biodistribution of the radiotracer within the animals the one hour acquisition window was distributed at various time-points ranging from the initial 68Ga-CM-246 injection up to a total of 2h15min post injection (p.i.).
During the PET acquisition MR images were simultaneously acquired using an in-house built surface coil in conjunction with a bird-cage 8 channel head coil (Siemens Healthineers, Erlangen). MR images were used to provide perfectly co-registered high-resolution images of the rabbit anatomy as well as the atherosclerotic plaques. To achieve these goals three MR images were acquired: a magnetization prepared rapid-gradient echo (MPRAGE), used for global anatomical localization and attenuation correction purposes; a dark-blood T2 sequence used to provide high-resolution images of the atherosclerotic plaques, and a time-of-fight (ToF) sequence used to provide good localization of the whole abdominal aorta from the renal to the iliac bifurcations.
Immediately after in vivo imaging, animals were euthanized and their aorta was removed for ex vivo PET imaging (N=10) followed by autoradiography and histology.
Results
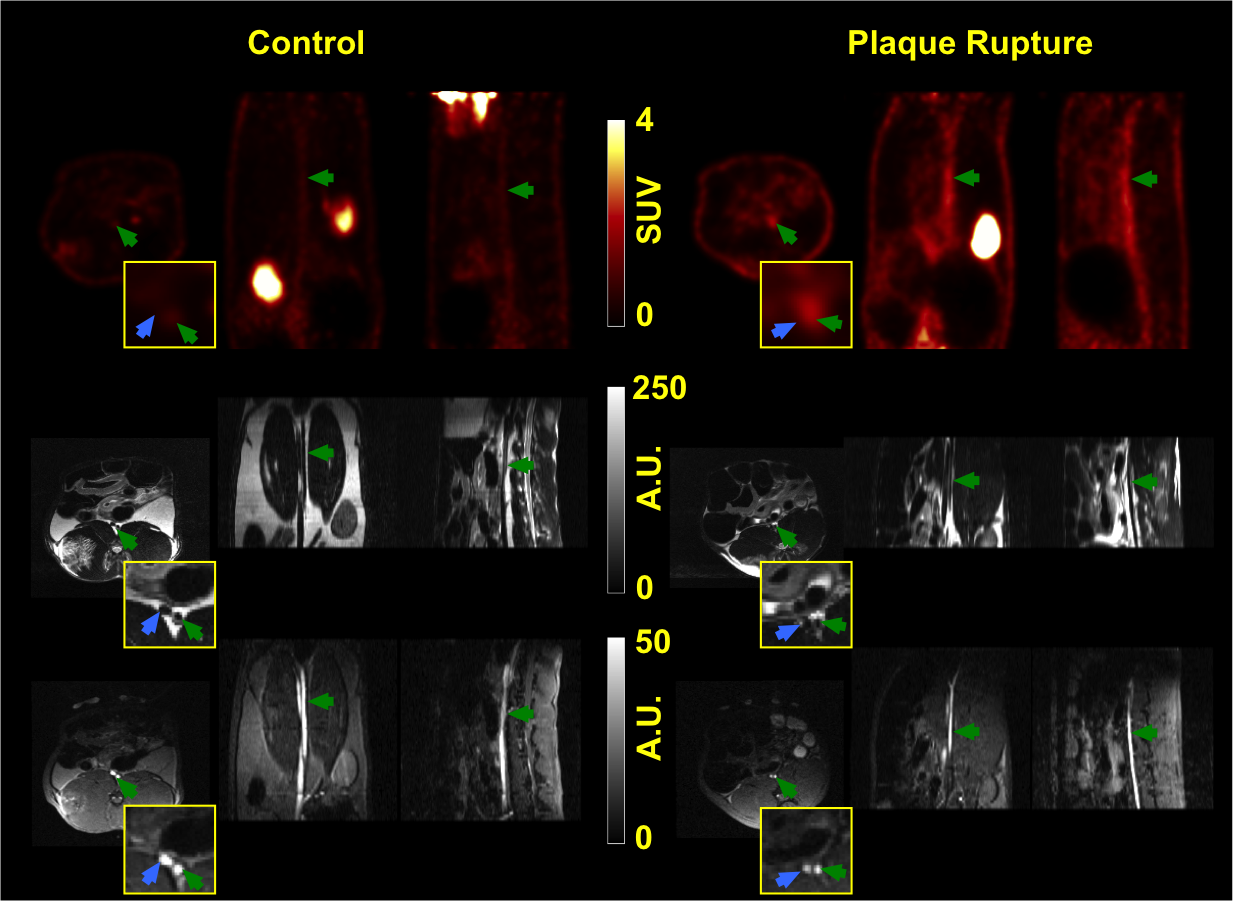
Fig. 1 shows an example of the in vivo PET and MRI images for one representative animal on each group: plaque rupture vs. control. The images show clear specific uptake around the abdominal aorta on specific locations where plaque rupture develops.
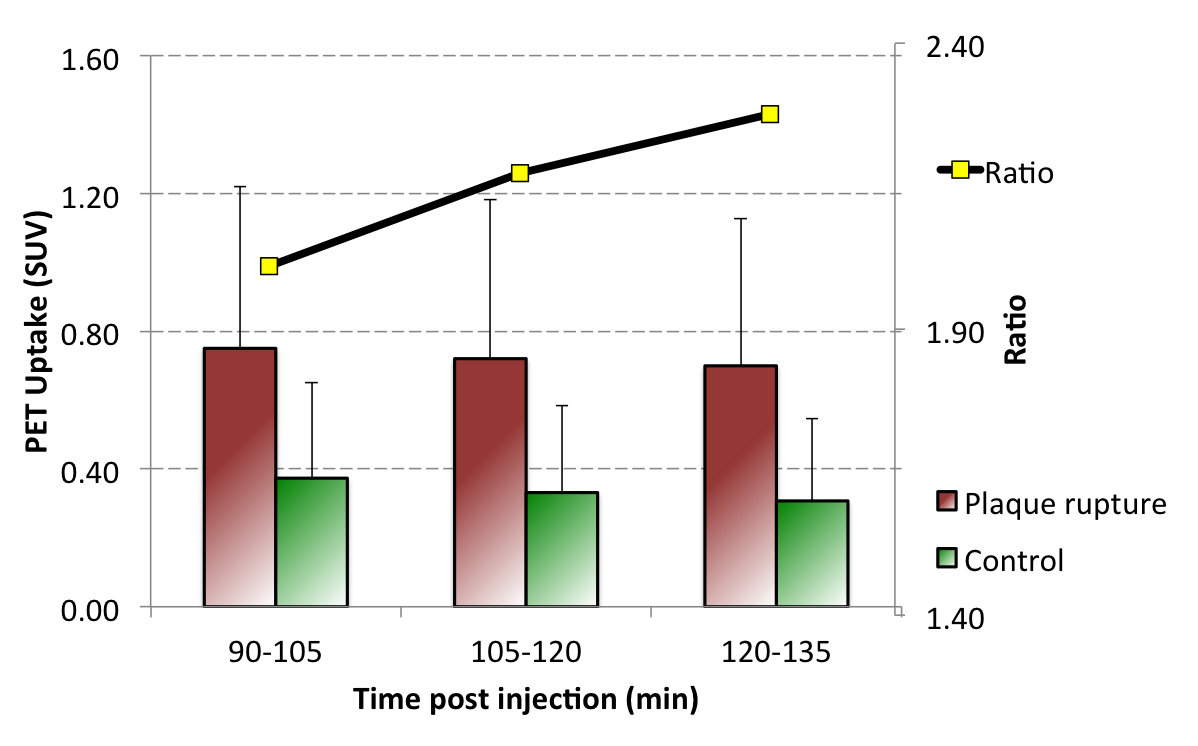
Fig. 2 shows the quantification results for the in vivo PET 68Ga-CM246 uptake on both groups (Plaque Rupture and Control) vs. time post injection. The largest difference between both groups occurs at the latest time point (120min p.i., ratio = 2.28).
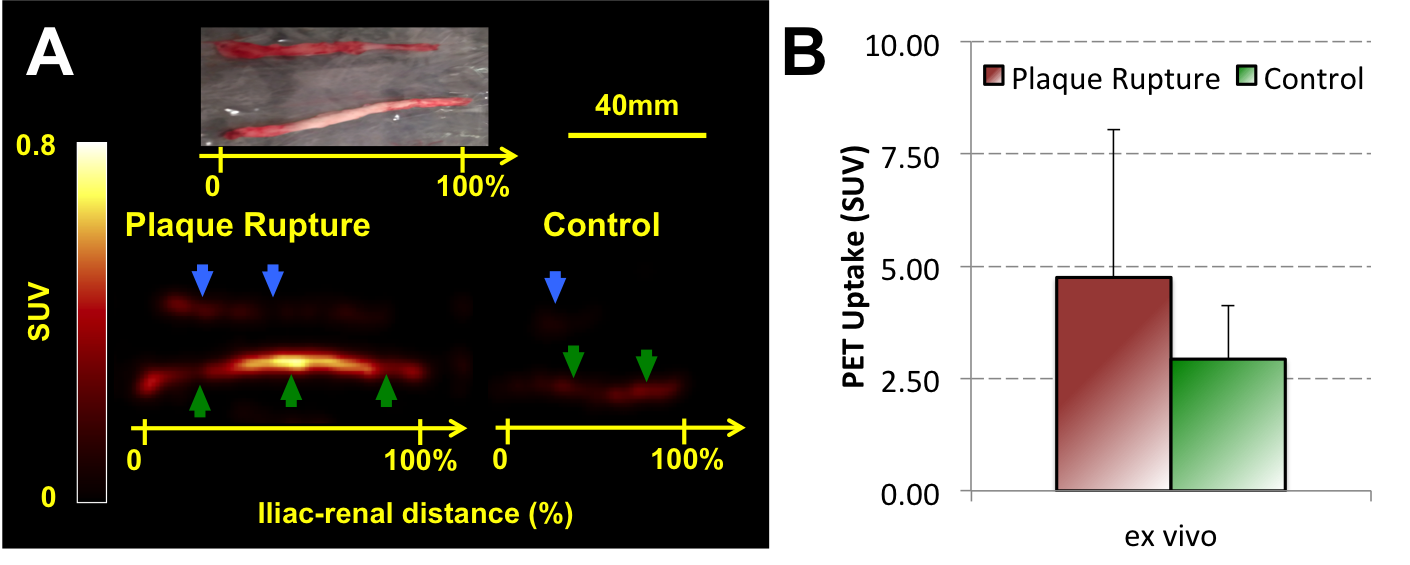
Finally, Fig. 3 shows an example of the ex vivo images for the Plaque Rupture and Control groups as well as the ex vivo PET quantification, showing similar results in group difference to the in vivo quantification in Fig. 2.
Discussion
In this study we have demonstrated the feasibility of in vivo detection and quantification of plaque rupture using a novel fibrin-binding PET radiotracer, 68Ga-CM246, using simultaneous PET/MRI technology. The tracer is highly specific and the technique offers great sensitivity of detection of ruptured plaques in vivo. Ex vivo PET images confirmed the great sensitivity and specificity of the technique. Results are currently being validated with autoradiography and histological sections to confirm the presence of rupture plaques.Conclusion
The use of simultaneous PET/MRI combined with a novel and highly specific fibrin-binding PET radiotracer, 68Ga-CM246, allows in vivo detection and quantification of plaque rupture in an atherosclerotic plaque rupture animal model. The study shows encouraging results for potential future clinical translation and applicability of this technique.Acknowledgements
References
1. Davies, M. J. Stability and instability: two faces of coronary atherosclerosis. The Paul Dudley White Lecture 1995. Circulation 94, 2013-2020 (1996).
2. Jander, S. et al. Inflammation in high-grade carotid stenosis: a possible role for macrophages and T cells in plaque destabilization. Stroke 29, 1625-1630 (1998).
3. Rudd, J. H. F. et al. Imaging atherosclerotic plaque inflammation with 18F-fluorodeoxyglucose positron emission tomography. Circulation 105, 2708-2711 (2002).
4. Izquierdo-Garcia, D. et al. Comparison of methods for magnetic resonance-guided [18-F]fluorodeoxyglucose positron emission tomography in human carotid arteries: reproducibility, partial volume correction, and correlation between methods. Stroke; a journal of cerebral circulation 40, 86-93, doi:10.1161/STROKEAHA.108.521393 (2009).
5. Tawakol, A. et al. Noninvasive in vivo measurement of vascular inflammation with F-18 fluorodeoxyglucose positron emission tomography. J Nucl Cardiol 12, 294-301 (2005).
6. Zhang, Z. et al. Non-invasive imaging of atherosclerotic plaque macrophage in a rabbit model with F-18 FDG PET: a histopathological correlation. BMC Nuclear Medicine 6 (2006).
7. Davies, J. R. et al. FDG-PET can distinguish inflamed from non-inflamed plaque in an animal model of atherosclerosis. Int J Cardiovasc Imaging 26, 41-48, doi:10.1007/s10554-009-9506-6 (2010).
Figures