4361
Optimization of saturation frequency offset step size for CEST asymmetry contrast of human brain at 7T MRI1Center for Biomedical Engineering, Indian Institute of Technology Delhi, New Delhi, India, 2Center for Magnetic Resonance & Optical Imaging, University of Pennsylvania, Philadelphia, PA, United States, 3All India Institute of Medical Science, New Delhi, India
Synopsis
Chemical-exchange-saturation-transfer(CEST) MRI is being used for mapping molecular-information. CEST contrasts such as Creatine-weighted(frequency-offset=2ppm), Glutamate-weighted(frequency-offset=2ppm) and APT-weighted(frequency-offset=3.5ppm) are being explored for potential clinical applications. Computation of contrast(CEST-asymmetry) at a frequency-offset require data acquisition at multiple offset-frequencies either for B0-inhomogenity correction or generating z-spectra. Objective of this study was to evaluate the effect of sampling frequency-offset step-size (0.1, 0.2, 0.3, 0.4, 0.5ppm) on CEST-asymmetry contrast. Standard-deviation, coefficient-of-variation and normalized-mean-sum-squared-errors(nMSSE) increases while correlation decreases with increase in step-size. By considering both scan time and error, step-size of 0.2 to 0.3 is optimum for computing CESTasym.
INTRODUCTION
Chemical-exchange-saturation-transfer(CEST) MRI1 shows great potential in biomolecular imaging. Recent studies have reported various in vivo CEST contrasts such as Creatine-weighted2, Glutamate-weighted3 and APT-weighted4 and their clinical applications are being explored5. In general, CEST-asymmetry is used for computing these CEST contrast. CEST data is acquired at multiple frequency-offsets around frequency of interest, because additional data is required for B0 inhomogenity correction or generating z-spectra curves. Due to these multiple frequency data acquisition, CEST data acquisition takes long time. Scan time in CEST MRI data acquisition mainly depends upon step-size between offset frequencies or sampling. Reported studies on CEST MRI have used different step-size. The choice of step-size depends upon available scan time, width of CEST pool, saturation power and field strength. Therefore, there is need of a systematic study on evaluating effect of step-size on CEST contrast and choosing an optimum step-size for in vivo studies. In this study, optimization of step-size was carried out for computing Cr-weighted, Glutamate-weighted and APT-weighted CEST contrast from human brain at 7T.METHODS
Theory
CEST asymmetry6 analysis is being used to compute CEST contrast
$$CEST_{asym} = \frac{M_{sat(-3.5ppm)} - M_{sat(+3.5ppm)}}{M_{sat(-3.5ppm)}}\times100$$
where, Msat(+3.5ppm) and are the signal intensities with upfield and downfield of water resonating frequencies.
Human studies
MRI imaging was performed on 7T Siemens scanner with a volume coil transmit/32-channel receive proton head phased-array coil using CEST pulse sequence. Seven healthy human volunteers (n=7, M:F=6:1, 37±14.5 years) participated in this study with written, informed consent. Acquisition protocol It consisted of the following steps: a localizer, WASSR7, CEST and B1 map data. WASSR were collected from ±0 to ±1 ppm (step-size=0.1 ppm) with saturation pulse of B1rms = 0.29 µT and 200 ms duration. CEST-weighted images were acquired with varying offset frequencies (∆ω) from ±0 to ±5 ppm at 0.1, 0.2, 0.3, 0.4 and 0.5 ppm step-size with pulse duration of 800 ms and at multiple B1rms of 1.17, 2.34, 3.52 and 4.69 µT. CEST data scan time for 0.1, 0.2, 0.3, 0.4 and 0.5 ppm step-size were 10, 5, 2.5, 1.25 and 0.62 mins respectively.
Post-processing
Image processing and data analysis were performed using in-house developed MATLAB R2017. ROI was taken on white matter on all volunteers for analysis of mean, standard deviation (SD), co-efficient of variation (COV), correlation and normalized mean-sum-squared-errors(nMSSE). CESTasym contrast computed for 0.2, 0.3, 0.4, 0.5ppm step-size were compared with CESTasym contrast with 0.1 ppm step-size considering it to be the gold standard.
RESULTS
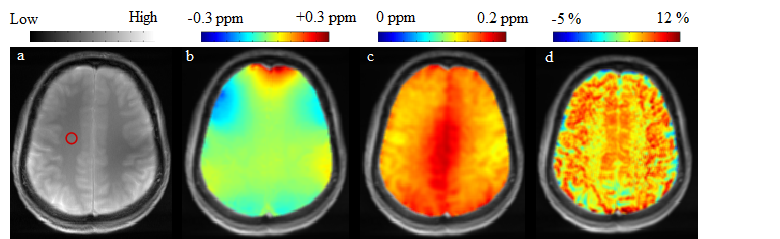
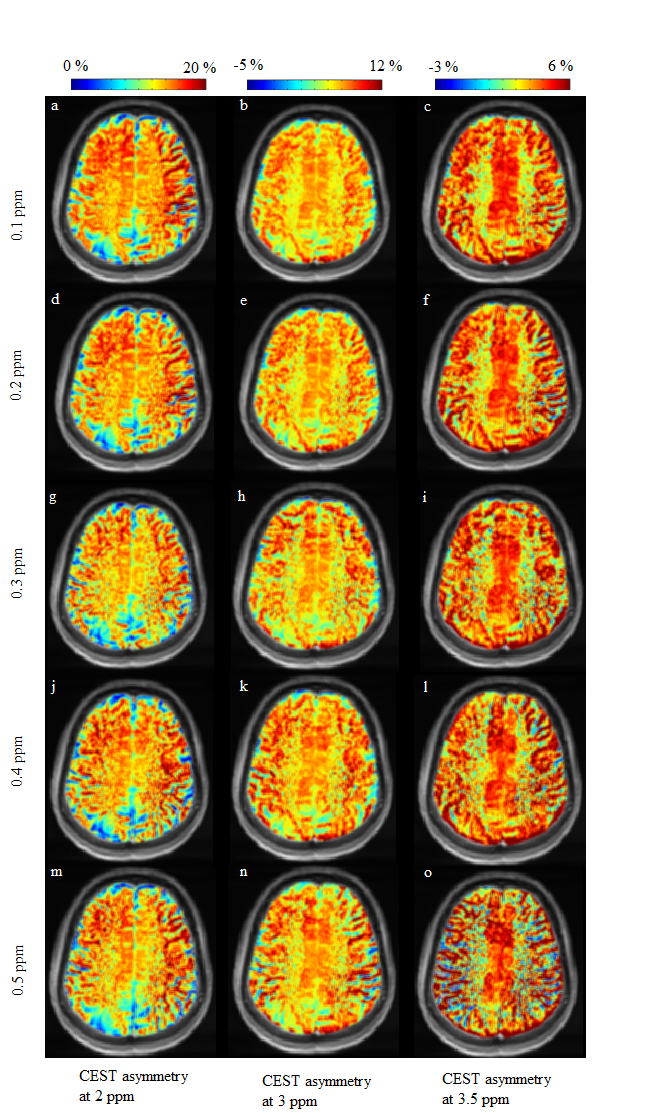
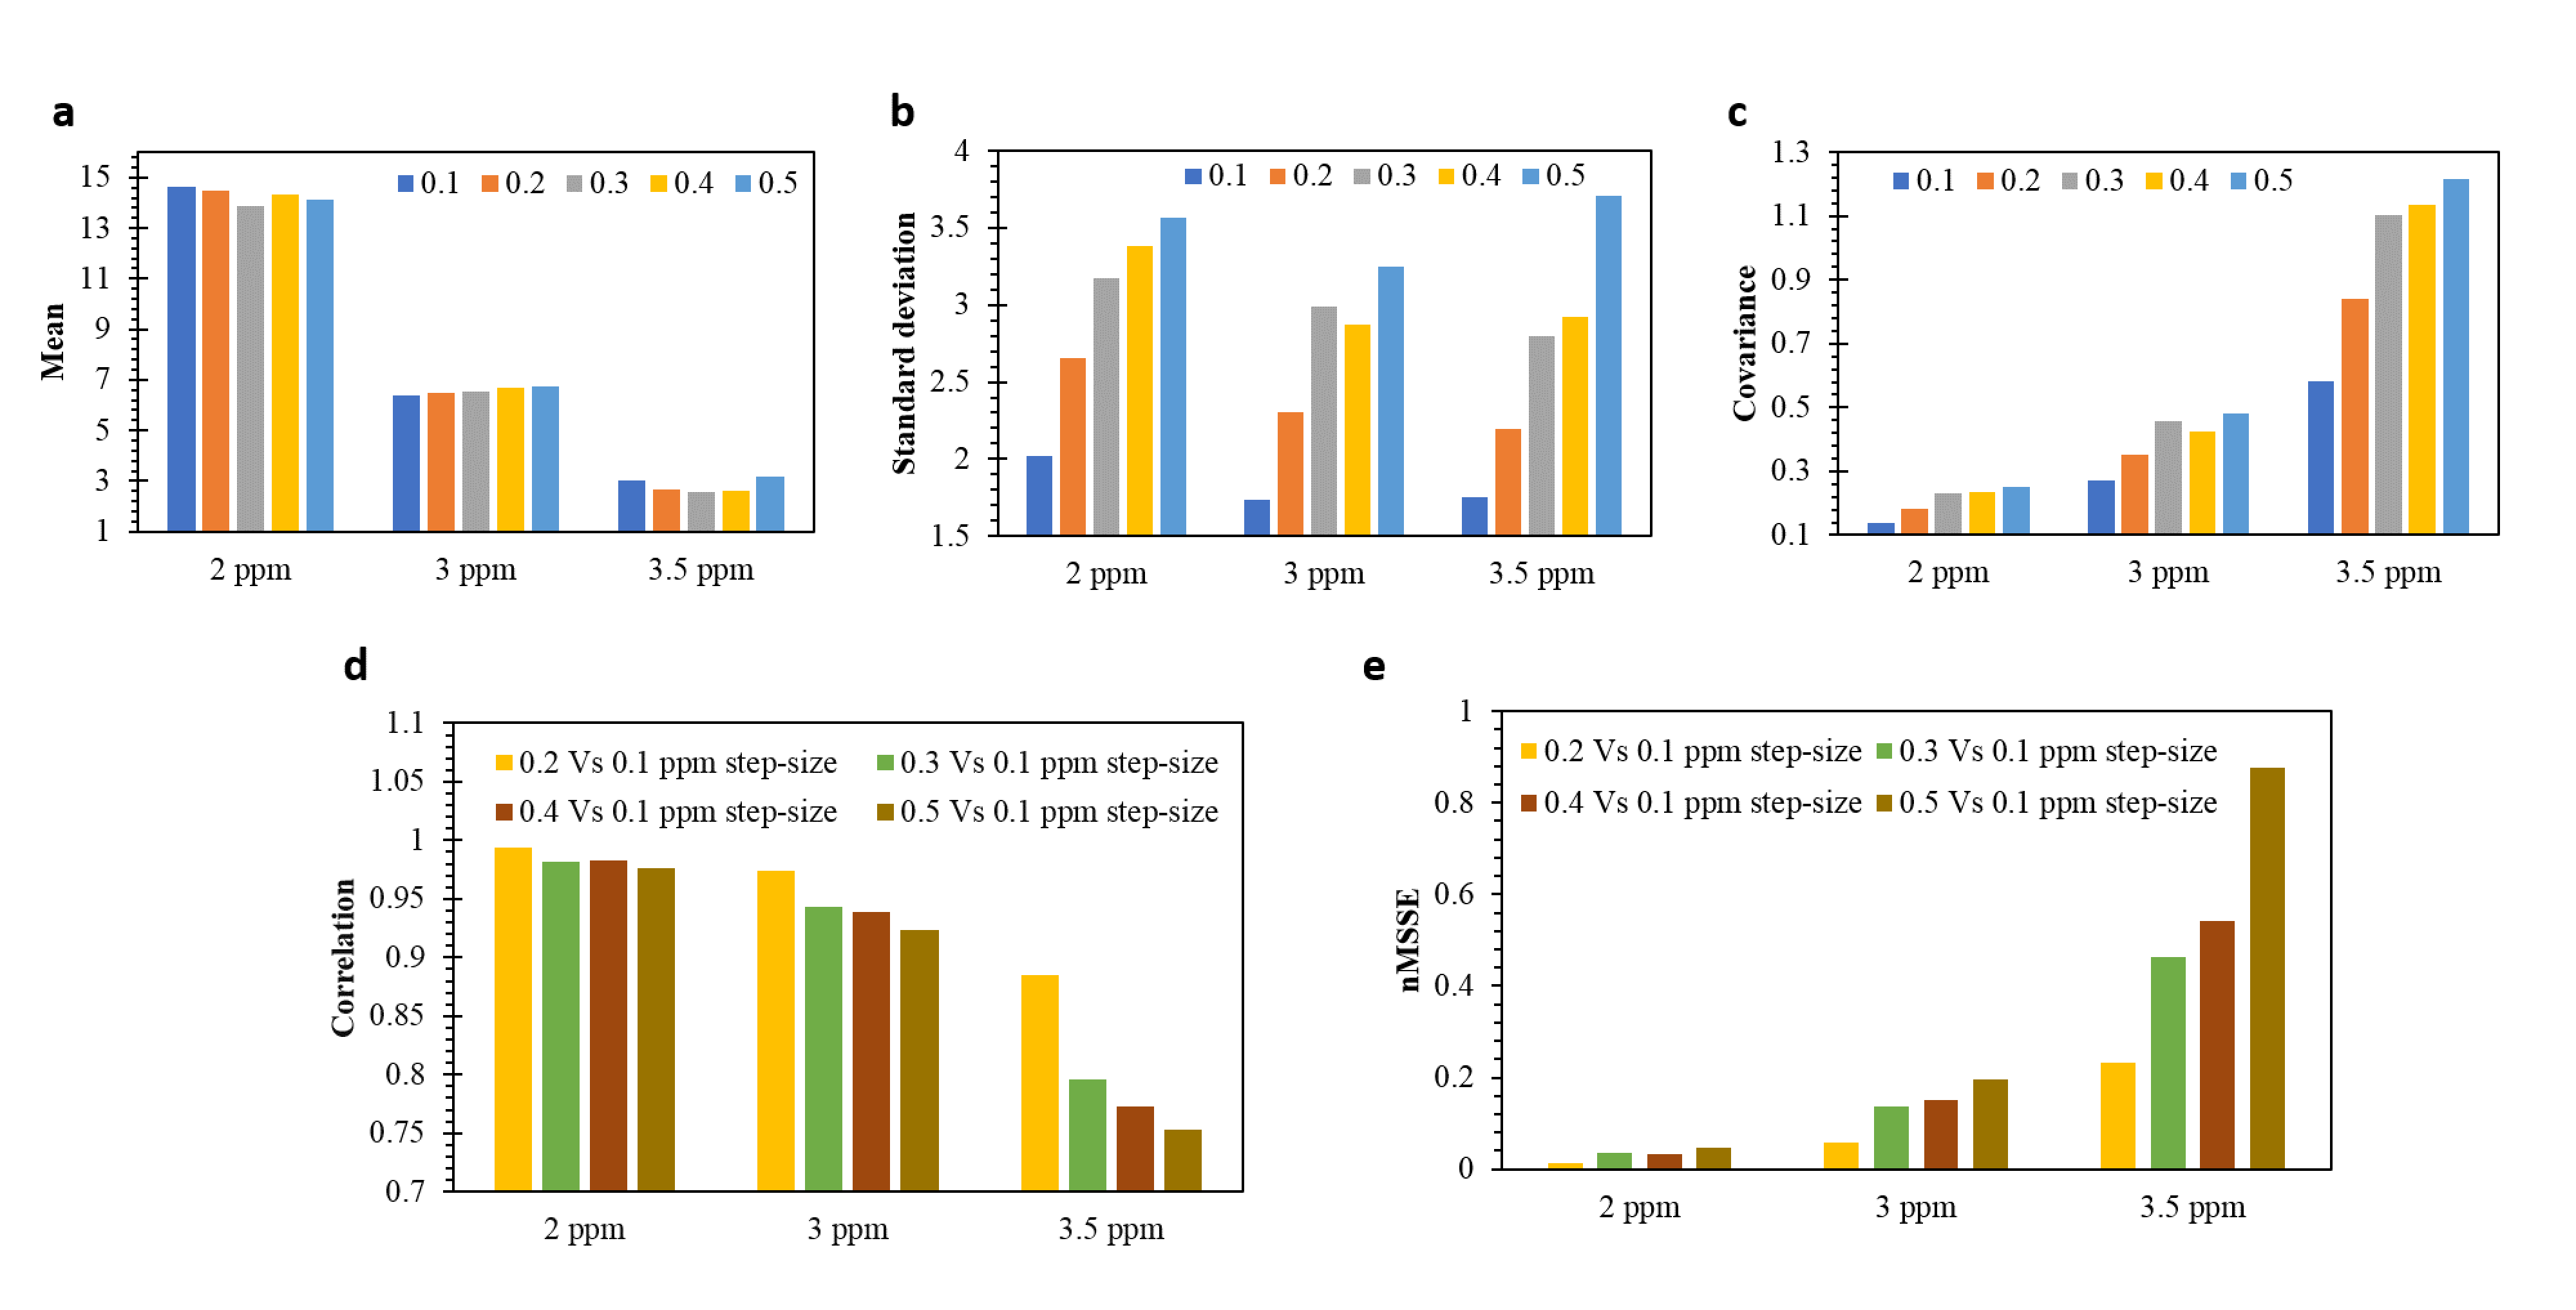
Fig. 1(d) shows B0-B1 inhomogeneity corrected CEST asymmetry map (Glutamate-weighted CEST or GluCEST) at 3 ppm for B1rms 4.69 µT which is acquired at 0.1 ppm step-size from a healthy human brain. GM and WM GluCEST contrast are ~10% and ~6% respectively. Glutamate distribution between WM and GM becomes coarser with the increase in step size (Fig. 2. b,e,h,k,n). CESTasym at 2 ppm (Creatine-weighted CEST or CrCEST) (Fig. 2. a,d,g,j,m) and amide proton CESTasym at 3.5 ppm (Fig. 2.c,f,i,l,o) follow similar trend. Though CESTasym contrast remains almost similar with variation in step-size(Fig. 3.a); SD, COV and nMSSE increases with the increase in sampling frequency step-size (Fig. 3.b,c,e). Contrast with 0.5 ppm step-size provides largest nMSSE (Fig. 3.e). Correlation of CESTasym contrast (computed with 0.2,0.3,0.4,0.5 ppm step-size) with respect to CESTasym contrast (computed with 0.1 ppm step-size) decreases with increase in step-size (Fig. 3.d). CEST data scan time for 0.1, 0.2, 0.3, 0.4 and 0.5 ppm step-size were 10, 5, 2.5, 1.25 and 0.62 mins respectively.DISCUSSIONS
GluCEST map(Fig. 1.d) shows GM-WM distribution pattern similar to reported studies . Sensitivity of CEST-asymmetry contrast highly depends on B0 and B1 inhomogeneity especially at higher fields. Step-size affects interpolation of CEST data required for B0 correction which in turn affects CESTasym8. CESTasym contrast with 0.1 ppm step-size provides best contrast with clear visualization while 0.5 ppm step-size provides worst contrast with bad quality map. Increase in step-size leads to inappropriate B0 correction which generates erroneous CEST contrast. Scan time is least for 0.5 ppm step-size and largest for 0.1 ppm step-size. Finer step-size increases scan time, thus scanning with 0.1 ppm step-size is impractical for clinical settings. Coarser step-size provides low quality maps leading to over or under estimation of contrast. Maps generated with step-size greater than 0.3 ppm are unreliable with high nMSSE. Therefore, scanning with step-size between 0.2 and 0.3 ppm are practically feasible. Moreover, CESTasy contrast at these step-size is close to 0.1ppm step size.CONCLUSION
The choice of optimal sampling depends upon trade-off between accuracy of contrast and scan time. This study show that for clinical applications, step size between 0.2 to 0.3 should be used for computing CrCEST, GluCEST and APT weighted contrast at 7T human brain.Acknowledgements
The Authors acknowledge internal seed grant from IIT-Delhi. This project was partially supported by National Institute of Biomedical Imaging and Bioengineering of the NIH through Grant Number P41-EB015893 and Centre for Magnetic Resonance & Optical Imaging (CMROI), University of Pennsylvania,USA.References
1. Zijl PCM va., Yadav NN: Chemical Exchange Saturation Transfer (CEST): what is in a name and what isn’t? Magn Reson Med 2012; 65:927–948. 2. Cai K, Singh A: CEST Signal at 2ppm (CEST@2ppm) from Z-Spectral Fitting Correlates with Creatine Distribution in Brain Tumor Kejia. NMR Biomed 2016; 28:1–8. 3. Cai K, Haris M, Singh A, et al.: Magnetic resonance imaging of glutamate. Nat Med 2012; 18:304–308. 4. Debnath A, Gupta RK, Singh A: APT MRI of intracranial Mass Lesions at 3T and comparison with perfusion parameters. In Proc Intl Soc Mag Reson Med (24)2016. Singapore; 2016. 5. Liu G, Song X, Chan KWY, Mcmahon MT: Nuts and bolts of chemical exchange saturation transfer MRI. NMR Biomed 2013(August 2012):810–828. 6. Debnath A: Lorentzian Probabilistic Sum based Z-spectrum fitting approach for computing CEST and NOE contrast and its comparison with Lorentzian sum and asymmetry analysis. In Proc Intl Soc Mag Reson Med (25)2017. Hawaii, USA; 2017. 7. Kim M, Gillen J, Landman BA, Zhou J, Van Zijl PCM: Water saturation shift referencing (WASSR) for chemical exchange saturation transfer (CEST) experiments. Magn Reson Med 2009; 61:1441–1450. 8. Krishnamoorthy G, Nanga RPR, Bagga P, Hariharan H, Reddy R: High Quality 3D gagCEST Imaging of In Vivo Human Knee Cartilage at 7T. Magn Reson Med 2018; 77:1866–1873.Figures