4358
Characterization of preclinical PET insert for 7T: beyond NEMA testing.1KU Leuven, Leuven, Belgium, 2Nuclear Molecular Imaging, Bruker BioSpin Preclinical Imaging Division, Bruker Biospin, Ettlingen, Germany, 3Nuclear Molecular Imaging, Bruker BioSpin Preclinical Imaging Division, Bruker BioSpin, Ettlingen, Germany, 4Biomedical MRI group, Department of Imaging and Pathology, KU Leuven, Leuven, Belgium, 5Nuclear Medicine and Molecular Imaging, Department of Imaging and Pathology, KU Leuven, Leuven, Belgium, 6Instituto de Instrumentación para Imagen Molecular (I3M), Universitat Politècnica de València, Valencia, Spain
Synopsis
While we already reported indexes of the performance of one of the first commercially available SiPM-based MR-compatible PET Insert, no NEMA testing has been reported until now. Moreover the NEMA protocol for evaluating the performance of preclinical PET scanner, do not cover the integration and potential interference between PET and MRI. We hereby propose and report an extended NEMA protocol demonstrating the performance of the MRI (Biospec USR 70/30) with and without the presence of the PET Insert as well as the performance of the PET with simultaneous MRI acquisition.
Introduction:
While many preclinical PET insert have already been developed and tested1-5, there is still no consensus in what metrics should be reported to evaluate the performance of the PET and MRI hardware when operated simultaneously. Based on the NEMA NU 4-2008 protocol6 and on the MRI acceptance protocol from the manufacturer, we tested one of the first commercially available SiPM-based MR-compatible high-resolution PET Inserts inside a pre-clinical 7T MRI scanner. Our aim was to report the performance of the aforementioned hardware but also to propose a testing protocol as a guideline for preclinical PET insert testing.Materials and Methods:
MRI performance:
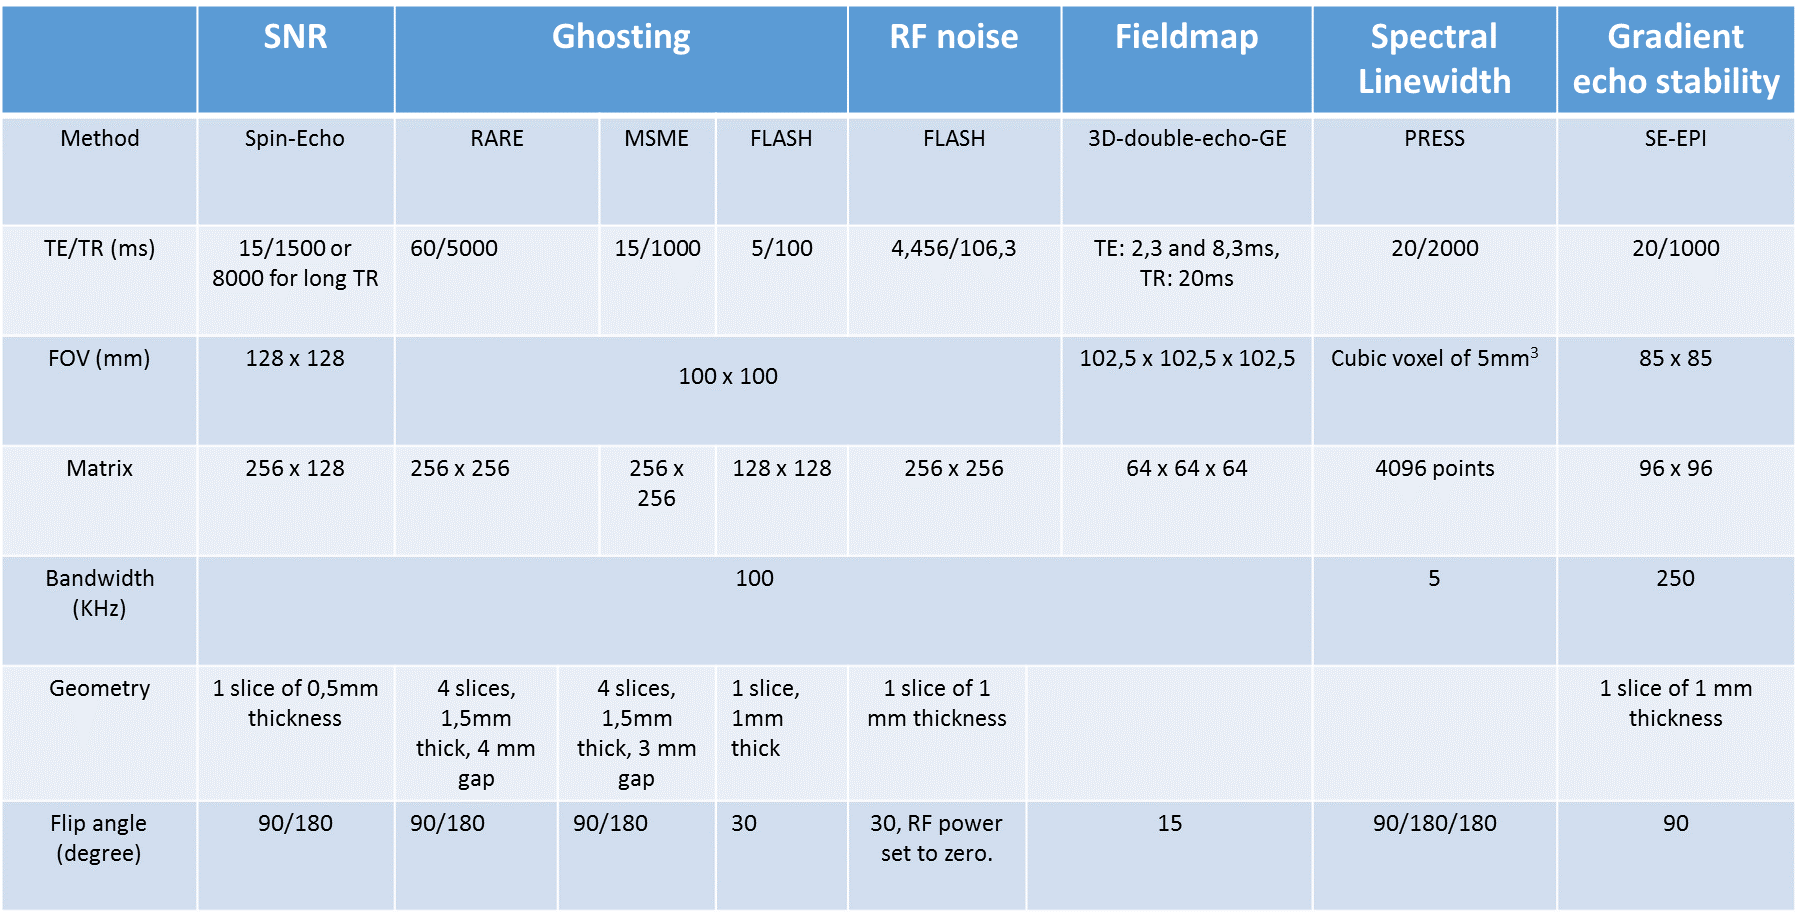
Image quality was assessed with and without the PET Insert. The test performed comprised signal to noise ratio, image ghosting, field homogeneity, radiofrequency noise and signal stability. All MRI sequences and parameters are summarized in table 1.
PET performance:
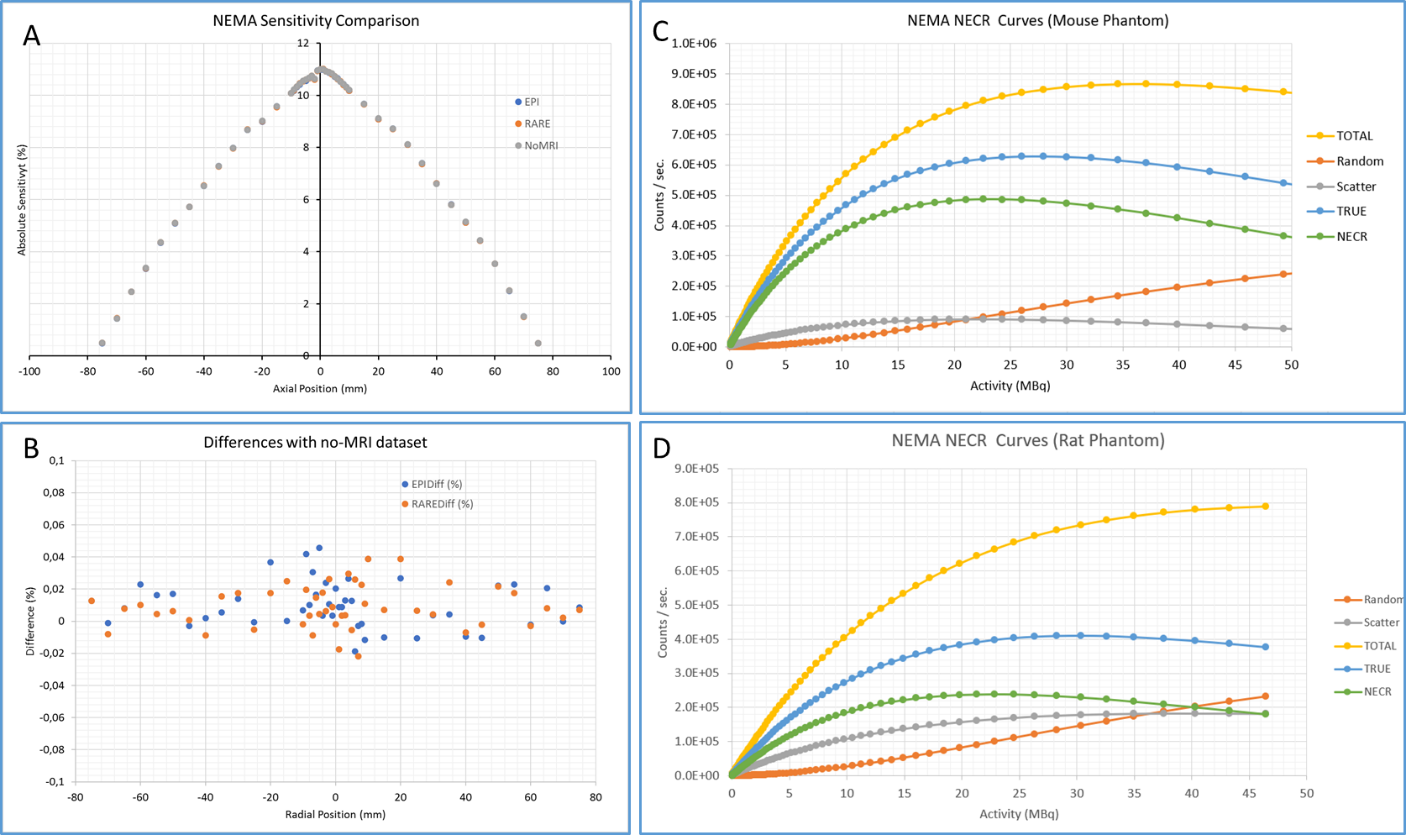
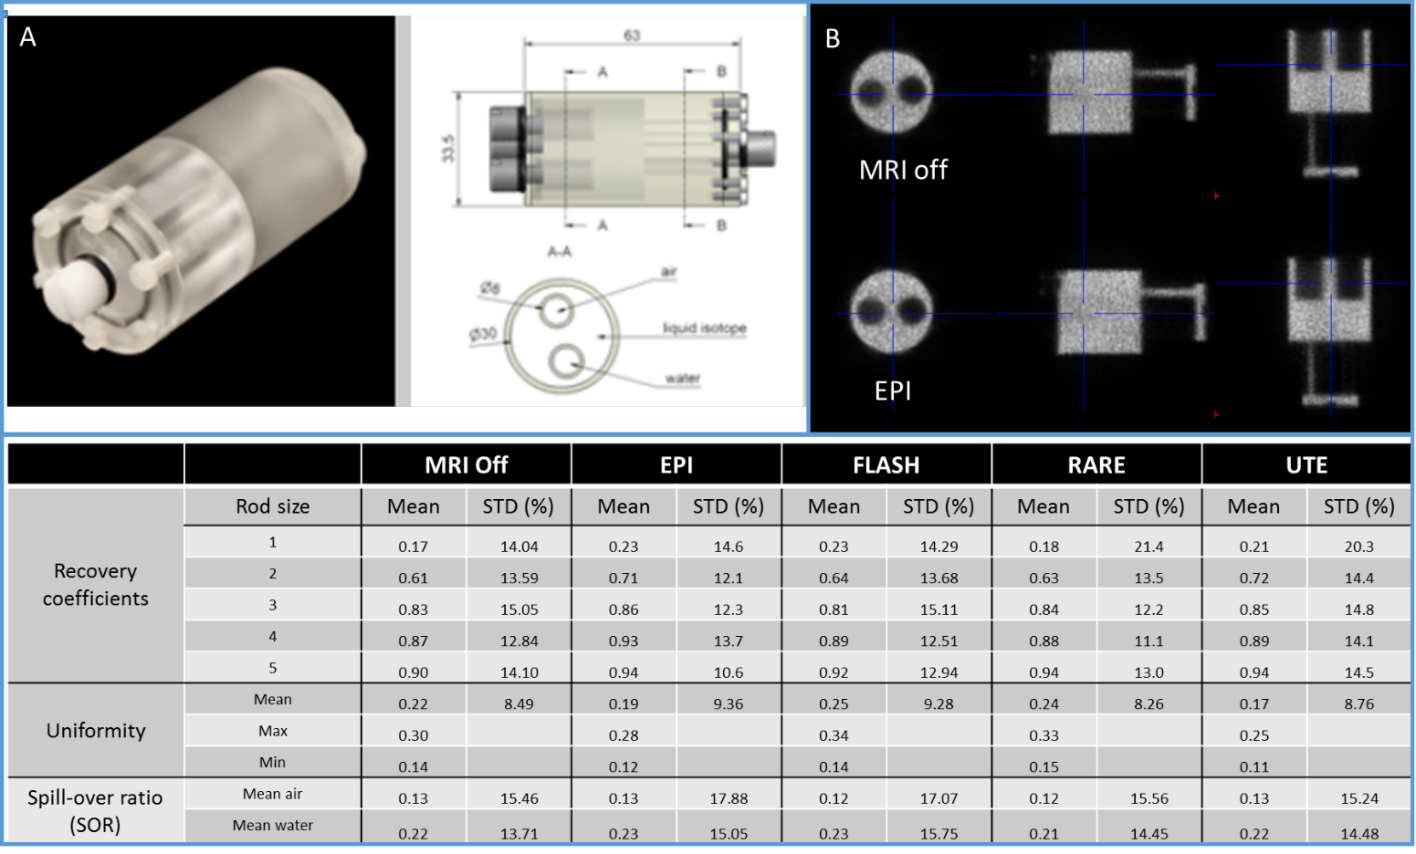
All measurements and processing were performed according to the NEMA NU 4-2008 protocol6. For PET performance characterization, the Quad86 coil was used for all testing requiring simultaneous PET/MRI acquisitions. Sensitivity: 22Na NEMA compliant point source (234 kBq), sensitivity profile along the axial axis of the FOV was determined with increment steps of 1mm for the first 1 centimeter from the center and then by step of 5mm until the edge of the FOV. Three acquisitions of 1 minute were acquired at each position with (EPI and RARE sequences) and without MRI. Background measurements (with no activity in the PET FOV) were also acquired in the same conditions. Resolution: 22Na point source. Acquisitions of 10 min were performed at FOV center and at 20 mm radial offset. The images were reconstructed using MLEM, 35 iterations, 0.25 mm voxel size and a PSF-based partial volume correction. Work is progress to measure the resolution is all locations as per NEMA standard. Noise equivalent count rate (NECR): mouse- and rat-sized count-rate phantoms. During both acquisitions, the PET insert was in position inside the MRI scanner with gradient powered ON but without radiofrequency coil inside the FOV. PET image quality: NU4 image quality phantom under different conditions: no MRI, FLASH, RARE, UTE and EPI acquisitions.
Results:
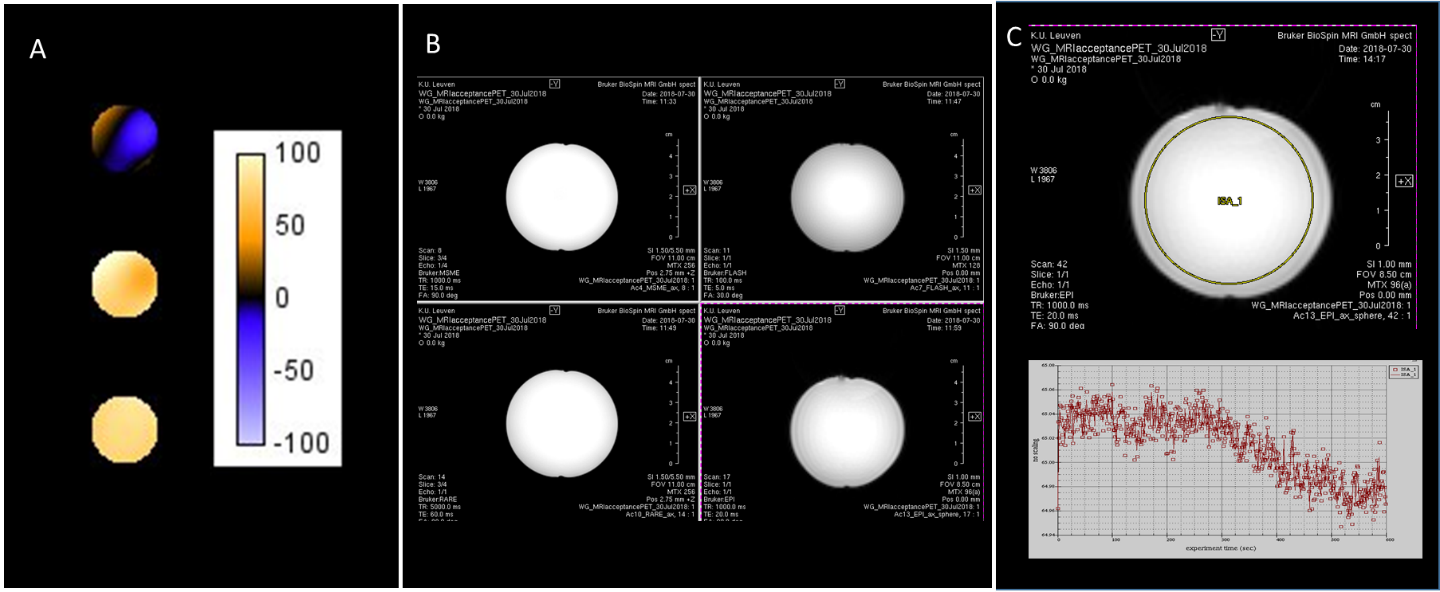
The field homogeneity was well preserved when the PET insert was in the MRI FOV (Fig.1). The FWHM linewidth of the PRESS acquisitions were 6.7 Hz (0.022 ppm) without and with the PET Insert. The SNR measurement showed no major differences. For the rat quadrature volume coil (86mm internal diameter), SNR changed by -5.6% and -2% for the short and long TR spin-echo acquisitions, while for the mouse quadrature volume coil (40mm internal diameter), these values changed by -1.5 and +1.8%. Image ghosting was well within the manufacturer specifications in all cases (<2.5%) and no RF noise was visible. The EPI signal stability was ± 0.11 % in both conditions. Maximum NEMA sensitivity of the PET insert is 11.0 % at the center of the FOV. Sensibly the same performance was achieved while MRI was running simultaneously (11.0 and 11.0% for EPI and RARE respectively). PET spatial resolution (FWHM) in (Transverse; Coronal; Sagittal) planes measured with the NEMA source was (1.09; 1.04; 0.94) mm at the center of the FOV and (1.18; 1.11; 1.09) mm at 20 mm radial offset. For the EPI sequence, running in parallel the results were (0.96; 1.08; 1.03) mm at the FOV center and (1.14; 1.19; 1.11) mm at 20 mm; and (0.94; 1.17; 1.02) mm at the FOV center and (1.14; 1.19; 1.11) mm at 20 mm for the RARE sequence. The peaks for true and noise equivalent count rates were 628 kcps at 28 MBq and 486 kcps at 23 MBq respectively in the mouse phantom whereas for the rat were 410 kcps at 30 MBq and 239 kcps at 23 MBq. Results on the PET image quality are summarized in Figure3. NEMA uniformity was only slightly altered by the MRI with a maximum difference seen for the FLASH sequence (% Std of 6.79% versus 5.87% for the MRI-off condition). Spill-over ratios were similar in all conditions but interestingly the recovery coefficient for the different rod sizes were slightly improved when MRI was ON.Conclusion and Discussion:
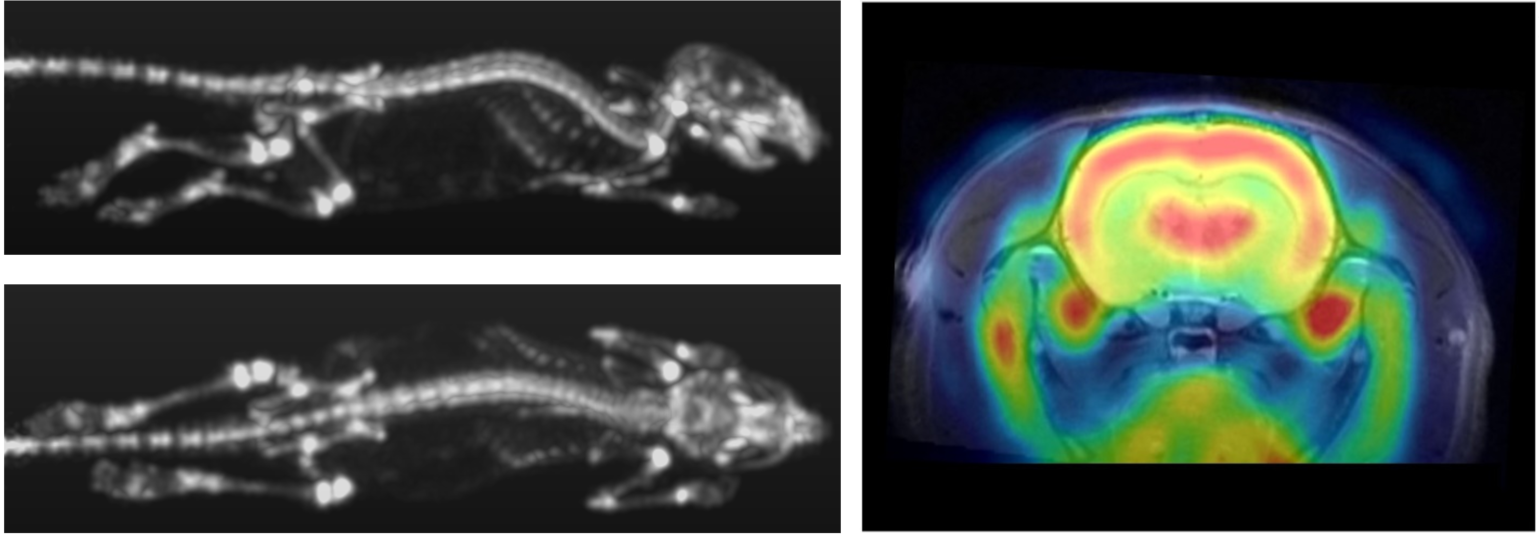
We hereby report the full characterization of the PET and MRI hardware using an extended NEMA protocol. The PET insert has only little effect on the MRI performance which were also only minimally affected by the different MRI sequences retaining a high sensitivity (>11%) and image quality in all conditions leading to high in-vivo image quality (Fig.4). Further investigations are currently ongoing to investigate the quantification accuracy with simultaneous MRI acquisitions.Acknowledgements
No acknowledgement found.References
- Greg Stortz, Jonathan D. Thiessen, Daryl Bishop et al., Performance of a PET Insert for High-Resolution Small-Animal PET/MRI at 7 Tesla. The Journal of Nuclear Medicine • Vol. 59 • No. 3 • March 2018, p 536-542.
- David Schug, Christoph Lerche, Bjoern Weissler et al. Initial PET performance evaluation of a preclinical insert for PET/MRI with digital SiPM technology. Phys. Med. Biol. 61 (2016) 2851-2878.
- Bjoern Weissler, Pierre Gebhardt, Peter M. Dueppenbecker et al. A Digital Preclinical PET/MRI Insert and Initial Results. IEEE Trans Med Imaging. 2015 Nov;34(11):2258-70.
- Parl C., Kolb A., Schmid A. M. et al. A novel optically transparent RF shielding for fully integrated PET/MRI systems. Phys. Med. Biol. 62 (2017) 7357–7378.
- Negar Omidvari, Jorge Cabello, Geoffrey Topping et al. PET performance evaluation of MADPET4: a small animal PET insert for a 7 T MRI scanner. Phys. Med. Biol. 62 (2017) 8671–8692
- National Electrical Manufacturers Association. NEMA Standard Publication NU 4-2008: Performance Measurements of Small Animal Positron Emission Tomographs. Rosslyn, VA: National Electrical Manufacturers Association; 2008.
Figures