4355
Potential strategies to test the sensitivity of iron oxide nanoparticles as a spin-lattice MR relaxation contrast agent in vivo.1Center for Neuroscience and Regenerative Medicine, Henry M. Jackson Foundation, Bethesda, MD, United States, 2Laboratory of Functional and Molecular Imaging, National Institute of Health, Bethesda, MD, United States, 3Neurology, Uniformed Services University of the Health Science, Bethesda, MD, United States
Synopsis
A well designed MR T1 relaxation contrast agent would provide readily detectible MR image contrast without extensive post-processing and superior spatial resolution compared to other MRI derived biomarkers. However, developing effective an T1 contrast agent would require comprehensive in vivo preclinical study. Thus, it would be highly beneficial to have methodology which can provide quantitative assessment on the relaxation effects of the employed contrast agent on living tissue without damaging the tissue integrity. Here we present a potential strategy to test MR sensitivity on T1 contrast agent on living tissue. The digital simulation provided quantitative assessment on T1 relaxation effect.
Introduction
In this study, we propose a methodology to test the MR sensitivity of 3 nm iron oxide nanoparticles (IONP) for both in vivo mouse and human brain. It is well known that small size iron oxide nanoparticles have both spin-lattice and spin-spin relaxation enhancing effects (or so called T1 and T2 shortening effect).1 The spin-lattice relaxation enhancing effect of small IONP is often tested using either phantom studies or by direct injection to living tissue. Yet ultimately the effect of IONP on longitudinal MR relaxation should be tested in living tissue such as in vivo brain. To do this, the employed contrast agent must be delivered to brain tissue by passing through the blood-brain barrier. While there have been many efforts to develop MR contrast agents that pass through the blood-brain barrier, the proposed methods often cause side effects.2 Thus it would be beneficial to test MR sensitivity of the employed MR contrast agents without physically damaging living tissue. Here we present a digital simulation method to test MR sensitivity of 3 nm IONP as a T1 (or R1 = 1/T1) contrast agent.Methods
3 nm Iron oxide nanoparticles (IONP) were synthesized following the methods of Kim et al. and validated using dynamic light scattering and electron microscopy.3 The 3 nm IONP were suspended in 1% agarose with 1x PBS and diluted from 0.01 to 0.1 mM [Fe]. All MRI measurements were performed in a Bruker 9.4 T magnet for in vivo mouse brain and Siemens 3T magnet for in vivo human brain. Both mice and the human subject underwent two independent R1 estimation MR experiments. The R1 (s-1) (or T1 (s)) of 3 nm IONP was estimated from both 9.4T and 3T. MR images at 9.4T had 118 x 118 x 500 µm3 voxel size where 3T MR images had 1.0 mm3 voxel size. The series of images were obtained using modified fast inversion recovery MR pulse sequence.4 The repetition time (TR) was optimized for each magnet to ensure sufficient longitudinal MR signal recovery, 8 s for 9.4T and 3 s for 3.0T. The inversion MR data was collected after passing null point to suppress macro molecule effect on R1 estimation.5 The R1 was estimated using the Bayesian analysis tool box (http://bayesiananalysis.wustl.edu/).Results
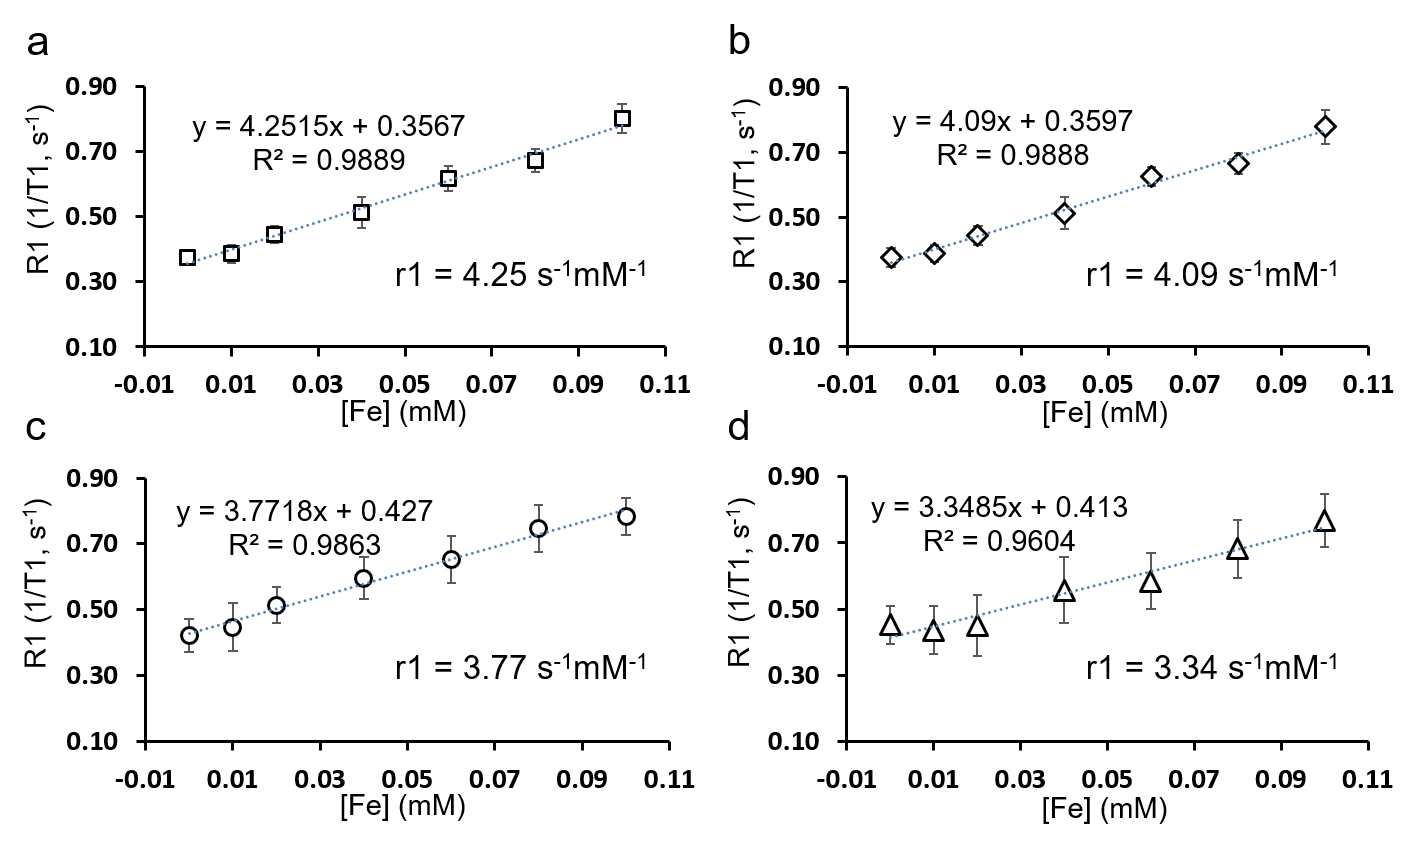
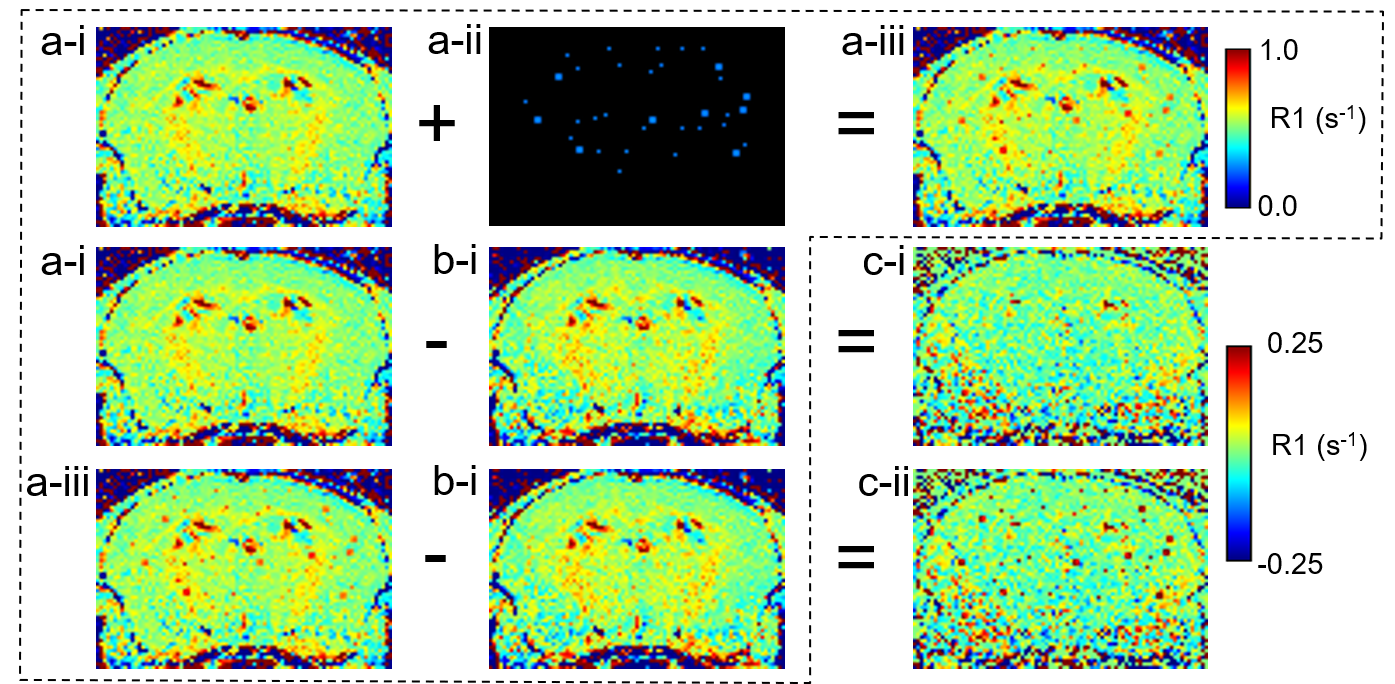
Figure 1 shows R1 of IONPs at various TR. The r1 (R1/[Fe]) significantly decreased with decreasing TR. In addition, the deviation of estimated R1 of IONP phantom increased even for control phantom, 0.0 mM [Fe]. Thus, for R1 estimation MR experiment, TR was optimized for each magnet to ensure sufficient longitudinal MR signal recovery. Figure 2 shows the estimated R1 map of IONPs at various [Fe]. The R1 of control phantom (suspending material only, 0.0 mM [Fe]) was subtracted from the R1 of IONPs producing the seeding R1 maps. Figure 3 shows in vivo mouse brain R1 maps, which were estimated from two independent MR data sets, and digital simulation procedures to test MR sensitivity of employed IONP as spin-lattice enhancing agent. The seeding R1 map was created with various voxel sizes. The subtraction of the 2nd (Fig. 3-b-i) from 1st (Fig. 3-a-i) in vivo mouse brain R1 map provided the reproducibility of employed in vivo R1 mapping (Fig. 3-c-i). The subtraction of the 2nd (Fig. 3-b-i) in vivo R1 map from the seeded map (Fig. 3-a-iii) provided the MR sensitivity of the employed R1 contrast agent (Fig. 3-c-i). Figures 4 and 5 show the MR sensitivity of employed 3 nm IONPs at various [Fe] for both in vivo mouse brain and healthy human subject. High [Fe] (0.1 mM) is readily detectable for both mouse and human brain (Fig. 4-c-v and Fig. 5-c-v). Interestingly, the MR sensitivity on 3 nm IONP tested by digital simulation was not spatially homogeneous. The low sensitivity or visibility was mainly caused by poor reproducibility of R1 mapping.Discussion and Conclusion
These results describe a potential method to test MR sensitivity of employed contrast agents without physical injection into living tissue. The MR sensitivity of any contrast agent will depend on multiple factors including the MR relaxation effects, delivery of the contrast agent to the target, and life time of the contrast agent in living tissue. In addition to factors relating to the contrast agent itself, the test-retest reproducibility of the MR imaging sequence will also play a critical role. Thus, reporting the reproducibility of the MR methodology for all MR-based biomarker studies is recommended.Acknowledgements
This research was funded, in part, by the Intramural Research Program of Center for Neuroscience and Regenerative Medicine, HJF (David L. Brody, Director), and the Intramural Research Program of the NIH, NINDS (Alan P. Koretsky, Scientific Director).References
References
1 Peng, Y.-K., Tsang, S. C. E. & Chou, P.-T. Chemical design of nanoprobes for T1-weighted magnetic resonance imaging. Materials today 19, 336-348 (2016).
2 Kovacs, Z. I. et al. Disrupting the blood-brain barrier by focused ultrasound induces sterile inflammation. Proc Natl Acad Sci U S A 114, E75-E84, doi:10.1073/pnas.1614777114 (2017).
3 Kim, B. H. et al. Large-scale synthesis of uniform and extremely small-sized iron oxide nanoparticles for high-resolution T1 magnetic resonance imaging contrast agents. Journal of the American Chemical Society 133, 12624-12631, doi:10.1021/ja203340u (2011).
4 Gupta, R. K., Ferretti, J. A., Becker, E. D. & Weiss, G. H. A modified fast inversion-recovery technique for spin-lattice relaxation measurements. Journal of Magnetic Resonance 38, 447-452 (1980). 5 Meinerz, K. et al. Bayesian Modeling of NMR Data: Quantifying Longitudinal Relaxation in Vivo, and in Vitro with a Tissue-Water-Relaxation Mimic (Crosslinked Bovine Serum Albumin). Applied Magnetic Resonance 49, 3-24 (2018).
Figures