4354
Calibrated fMRI as a Complementary Diagnostic Method for Epilepsy1iHuman Institute, ShanghaiTech University, Shanghai, China, 2School of Life Science and Technology, ShanghaiTech University, Shanghai, China, 3Department of Nuclear Medicine, Ruijin Hospital, Shanghai Jiao Tong University School of Medicine, Shanghai, China, 4Department of Functional Neurosurgery, Ruijin Hospital, Shanghai Jiao Tong University School of Medicine, Shanghai, China, 5MR Collaboration, Siemens Healthcare Ltd., Shanghai, China, 6Institute of Neuroscience, CAS Center for Excellence in Brain Science and Intelligence Technology, Chinese Academy of Sciences, Shanghai, China
Synopsis
Epilepsy, one of the most common neurological disorders, is a chronic and recurrent disorder of the brain characterized by unprovoked seizures. Unfortunately, conventional diagnostic methods are limited due to the difficulties of precise localization of the epileptogentic zone. Here, we introduce the calibrated functional MRI (fMRI) to calculate the oxygen to glucose index (OGI) with a combined PET/MR system. With this approach we were able to observe large decreases in relative OGI within the affected hemisphere of epileptic patients. Our method, if proven to locate epileptic foci better than glucose-PET methods alone, will represent an important new diagnostic tool for epilepsy.
INTRODUCTION
Epilepsy is a chronic and recurrent disorder of the brain characterized by unprovoked seizures,1 that are related to the abnormal firing of cortical neurons. Epilepsy is one of the most common neurological disorders, affecting approximate 50 million people worldwide of all ages.2 However, the pathological mechanisms of the disease are still largely unknown and thus current clinically available treatments are often unsuccessful.3 Here, we introduce the calibrated functional MRI (fMRI) as a promising complementary diagnostic method for epilepsy, which may possess better sensitivity and specificity over conventional methods like semiology, electroencephalography (EEG), PET, and structural and functional imaging. 4,5,6METHODS
In our approach, we measured the cerebral metabolic rate of oxygen consumption (CMRO2) using MRI together with the cerebral metabolic rate of glucose consumption (CMRglc) using PET, to give the oxygen to glucose index (OGI).7 OGI reflects the quantity of glucose that has undergone both glycolysis and aerobic respiration, as opposed to glucose that has only undergone glycolysis. Since mitochondrial function and (non-respirated) lactate efflux are commonly altered in epilepsy patients' brains, 8 epileptic foci can thus be potentially identified.
At Ruijin Hospital, 5 patients clinically diagnosed with epilepsy and 1 healthy volunteer underwent brain scans with 18F-FDG PET/MRI (Biograph mMR, Siemens Healthcare, Erlangen, Germany). The study was conducted in accordance with the Helsinki Protocol, as approved by the Ruijin Hospital Ethics Committee, Shanghai Jiao Tong University School of Medicine, and for all included patients, written informed consent was provided. Masked T1 maps, T2 maps, T2* maps, as well as cerebral blood flow (CBF) and fluorodeoxyglucose (FDG) images were calculated using MATLAB R2018a, BioImage Suite 3 (Section of BioImaging Sciences, Dept. of Diagnostic Radiology, Yale School of Medicine) and SPM12 (Trust Centre for NeuroImaging, UCL). The CBF map was based on arterial spin labeling (ASL), and the relative cerebral metabolic rate of oxygen (rCMRO2) was calculated using the independent mapping of R2’ and CBF, where R2’ is directly measurable by the difference between 1/T2* (transverse relaxation rate measured by gradient-echo) and 1/T2 (transverse relaxation rate measured by spin-echo).9,10 In this study, rCMRO2 and relative cerebral metabolic rate of glucose (rCMRglc) were scaled to known results from Hyder et al. (2016)7 and thus are relative and not absolute. Relative OGI was calculated as rOGI = rCMRO2 / rCMRglc.7 Although most calibrated fMRI requires at least CO2 exposure, our CMRO2 method does not require any gas exposure9,10.
RESULTS
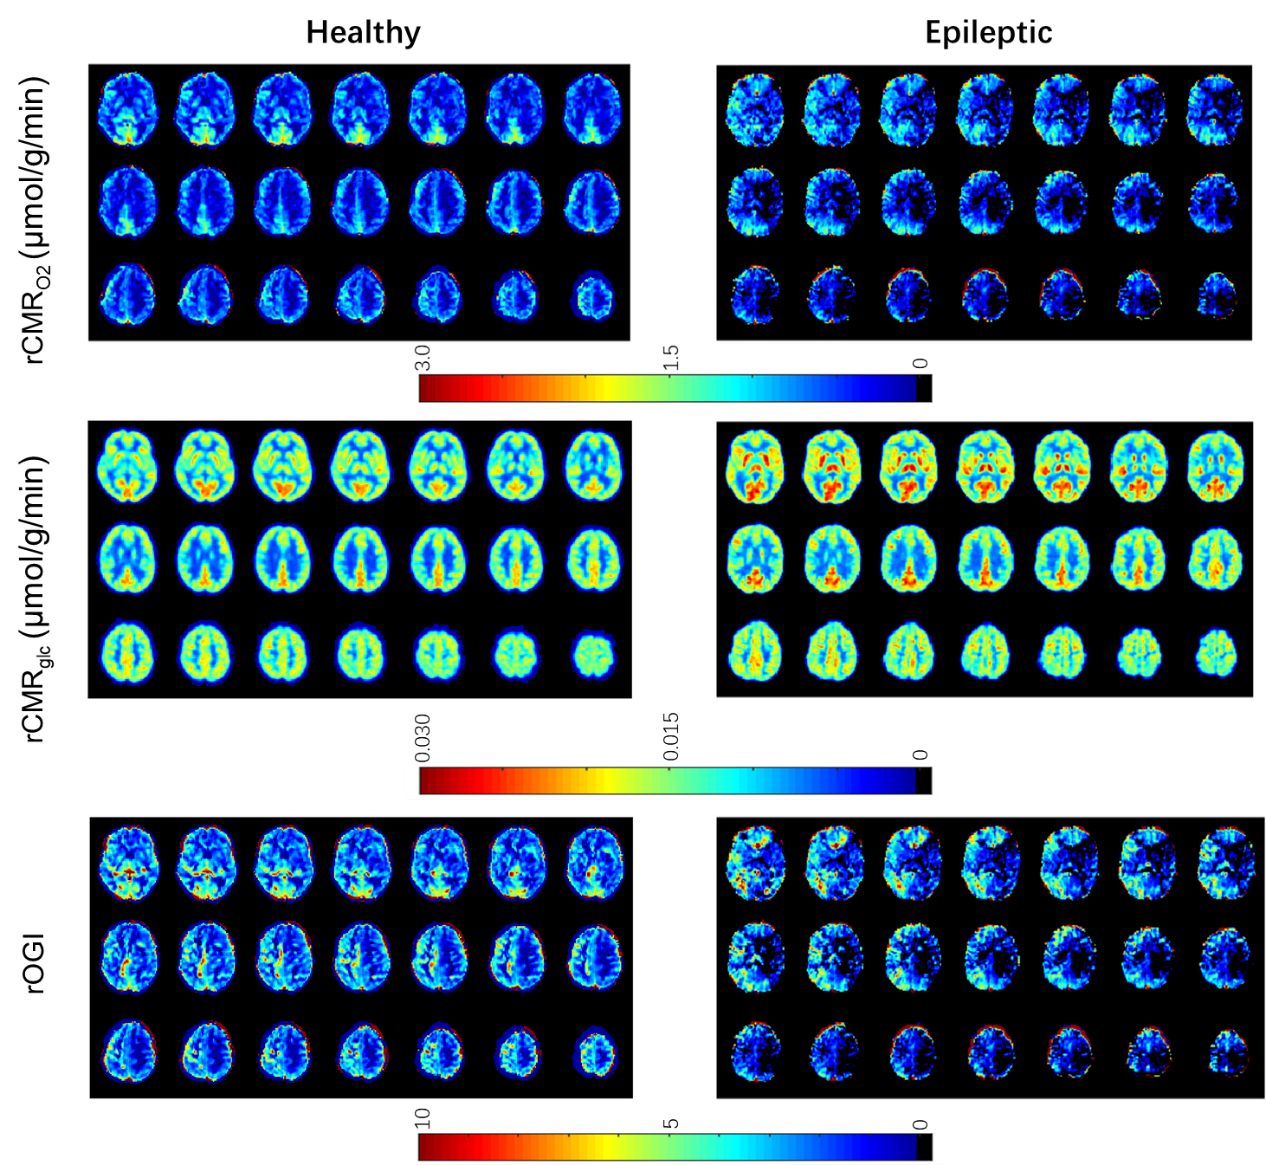
The healthy subject demonstrated relatively consistent rOGI across the neocortex7 with slightly lower values in the precuneus and slightly higher values in the somatomotor cortex, as has been reported previously.11 No lateralization was observed in the healthy subject. However, all five epileptic patients displayed a large reduction in rOGI at a focal point on the affected hemisphere. This focal point was also usually observed in rCMRO2 and rCMRglc but was always highly visible on rOGI. Results from the healthy subject and a representative epileptic patient are shown in Figure 1.DISCUSSION
The degree of glucose oxidation, as represented by OGI, is necessary to assess regionally variable ATP regeneration rates.7 While it has previously been demonstrated that epileptic foci show locally reduced metabolic activity,8 the addition of CMRO2 data in the rOGI metric appear more strongly visible than CMRglc or CBF alone. We hypothesize that rOGI is highly sensitive to the underlying changes in local metabolism seen in epilepsy.8 While it is currently under debate whether OGI is consistent across healthy neocortices or whether it differs locally,7 we observed significant decreases in rOGI that are far larger than the proposed healthy variation (if it does exist).CONCLUSION
Beyond the reduced metabolism seen in epilepsy with CBF and CMRglc, we have provided preliminary evidence that the relative levels of metabolic reduction are asynchronous, thus leading to a decrease in rOGI. This finding corresponds to the proposed mechanisms of increased glycolysis and lactate efflux in epilepsy. Our results demonstrate a promising marker, rOGI/OGI, with clear pathophysiological grounds, to spatially pinpoint epileptic foci in clinical patients more precisely than using CMRglc PET methods alone. Future work will focus on improved quantification of CMRO2 model parameters and the CMRglc input function to enable fully quantitative OGI use with combined PET/MRI.
Acknowledgements
This project is supported by grants from ShanghaiTech University, Shanghai Municipal People’s Government, the National Key R&D Program of China (No. 2017YFC1310400), the Strategic Priority Research Program of Chinese Academy of Science (No. XDBS01000000) and Shanghai Hospital Development Fund (16CR3110B).We thank Dr. Zhifeng Liang, from Institute of Neuroscience, Chinese Academy of Sciences, and Mengyang Xu, Lu Qu, Hui Li, Jing Yu, from iHuman Institute, ShanghaiTech University, Dr. Fahmeed Hyder and Dr. Peter Herman from Yale University, and Timothy James for helpful discussions.References
1. Fisher R S, Acevedo C, Arzimanoglou A, et al. ILAE official report: a practical clinical definition of epilepsy. Epilepsia. 2014; 55(4): 475-482.
2. World Health Organization. Epilepsy. February 8, 2018. http://www.who.int/en/news-room/fact-sheets/detail/epilepsy. Accessed November 1, 2018.
3. Wahab A. Difficulties in Treatment and Management of Epilepsy and Challenges in New Drug Development. Pharmaceuticals. 2010; 3(7):2090-2110.
4. Fisher R S, Stein A, Karis J. Epilepsy for the neuroradiologist. American journal of neuroradiology. 1997; 18(5): 851-863.
5. Duncan J S. Imaging in the surgical treatment of epilepsy. Nature Reviews Neurology. 2010; 6(10): 537.
6. Rosenow F, Lüders H. Presurgical evaluation of epilepsy. Brain. 2001; 124(9): 1683-1700.
7. Hyder F, Herman P, Bailey C J, et al. Uniform distributions of glucose oxidation and oxygen extraction in gray matter of normal human brain: No evidence of regional differences of aerobic glycolysis. Journal of Cerebral Blood Flow and Metabolism. 2016; 36(5): 903-916.
8. Yang H, Wu J, Guo R, et al. Glycolysis in energy metabolism during seizures. Neural Regeneration Research. 2013; 8(14): 1316-1326.
9. Shu C Y, Sanganahalli B G, Coman D, et al. New horizons in neurometabolic and neurovascular coupling from calibrated fMRI. Progress in Brain Research. 2016; 99-122.
10. Shu C Y, Herman P, Coman D, et al. Brain region and activity-dependent properties of M for calibrated fMRI. NeuroImage. 2016; 848-856.
11. Vaishnavi S N, Vlassenko A G, Rundle M M, et al. Regional aerobic glycolysis in the human brain. Proceedings of the National Academy of Sciences. 2010; 107(41): 17757-17762.
Figures