4352
Tracking nanoparticle mediated colorectal cancer liver metastasis ablation therapy using R2* magnetic resonance imaging1Medical College of Wisconsin, Milwaukee, WI, United States
Synopsis
We developed sub-100nm optical/MR/X-ray contrast-bearing theranostic nanoparticles (TNPs) based on Gold nanorod cores and Gd3+ oxide shells for interventional image-guided photothermal therapy (PTT). In this study, we explore the value of MRI for tracking TNP-mediated PTT response and distinguishing tumors from normal surrounding tissues in preclinical colorectal liver metastases (CLRM). The results showed that tumors with TNPs depict higher R2*-relaxivity compared to normal liver post-TNP mediated PTT, and this increase persists ten days post-therapy. Therefore, MRI contrast can be used for specifically targeting CRLM tumors, which enables delivering sufficient amount of light to the tumor and tracking the therapy response.
INTRODUCTION
Surgical intervention is only possible in less than one third of colorectal liver metastases cases. Various chemotherapies and hyperthermia achieved by radiofrequency or microwave ablation are the only other clinically available treatment options, each having their own non-specific side effects. In this respect, detecting accurate tumor location and tracking the tumor boundary during the therapeutic procedures is essential to effective treatment, but this remains a nontrivial task using current imaging techniques, in which imaging and treatment are separate steps.
Nanomaterials with image-guided photothermal therapy (PTT) capabilities and MRI contrast can play a significant role in tracking the boundaries of the tumor using MRI R2* relaxometry. We developed sub-100nm optical/MR/X-ray contrast bearing theranostic nanoparticles (TNPs) for interventional image-guided photothermal therapy. In this study, we explore the value of MRI relaxometry for identifying the tumor response to TNP mediated PTT and distinguishing it from normal surrounding tissues, which is important for enabling high-efficiency PTT by allowing estimation of the therapeutic light dose and tracking the PTT-induced damage to the tumor.
METHODS
Au nanorods resonant at 830nm were synthesized, and encapsulated with Gd2O3:Yb/Er shell and PEGylated, resulting in formation of sub-100 nm theranostic nanoparticle (TNP). TNPs were characterized using scanning transmission electron microscopy (STEM) and zeta potential measurements. Assessment of TNPs T1/T2 relaxivity and tumor R2* relaxometry in rats with colorectal cancer liver metastasis (CLRM) tumors was conducted on a small-animal Bruker 9.4T MRI scanner using standard inversion-recovery, spin-echo, and gradient-echo sequences respectively.
Three WAG/RijCmcr rats (350-450g) implanted with CRLM tumors were scanned after obtaining institutional animal care and use committee approval. TNPs (0.5 mL, 1013 NP/mL) were locally injected into the liver via hepatic portal vein. The rats were imaged to determine MRI R2* relaxometry immediately after TNPs injection through the portal vein followed by three-minute laser ablation (~700 mW/cm2), as well as at 10 days post procedure.
R2* relaxometry was assessed using a gradient-echo T2* mapping sequence to acquire axial and coronal stacks of 6-12 images covering the liver. Nine echoes were acquired for each image with echo times (TE) ranging from 4ms to 48ms in 5.5ms increments. Imaging parameters were as follows: repetition time (TR)=800ms, flip angle=45⁰, matrix=128x128, field of view (FOV)= 50x50 mm2, slice thickness=1mm, slice gap=2mm, acquisition bandwidth=586Hz/pixel, #averages=3, scan time ~1 minute/slice.
The acquired T2*-weighted images were analyzed using Circle cvi42 software, where signal intensity of different echoes was fitted to a mono-exponential decaying curve to derive T2* value (in ms), from which R2* (in 1/s units) was measured for each pixel as 1000/T2*, and the results were used to generate color-coded R2* maps. Regions of interest were drawn over the tumor and surrounding normal tissues in different slices, where R2* values were measured and represented as mean ± standard deviation (SD). Statistical t-test was conducted to investigate the signal intensity difference between normal and tumorous tissues (P<.0001 considered significant).
RESULTS
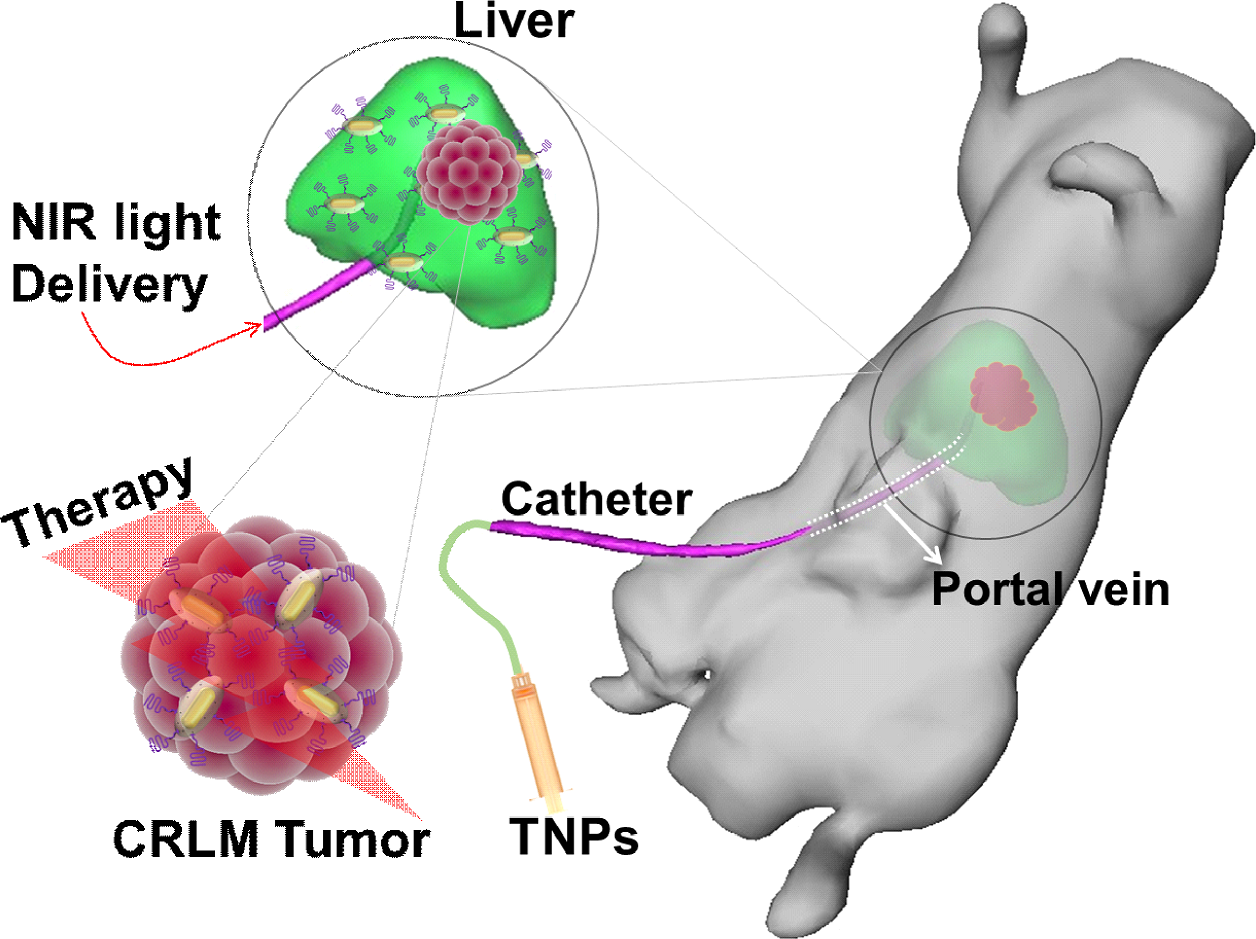
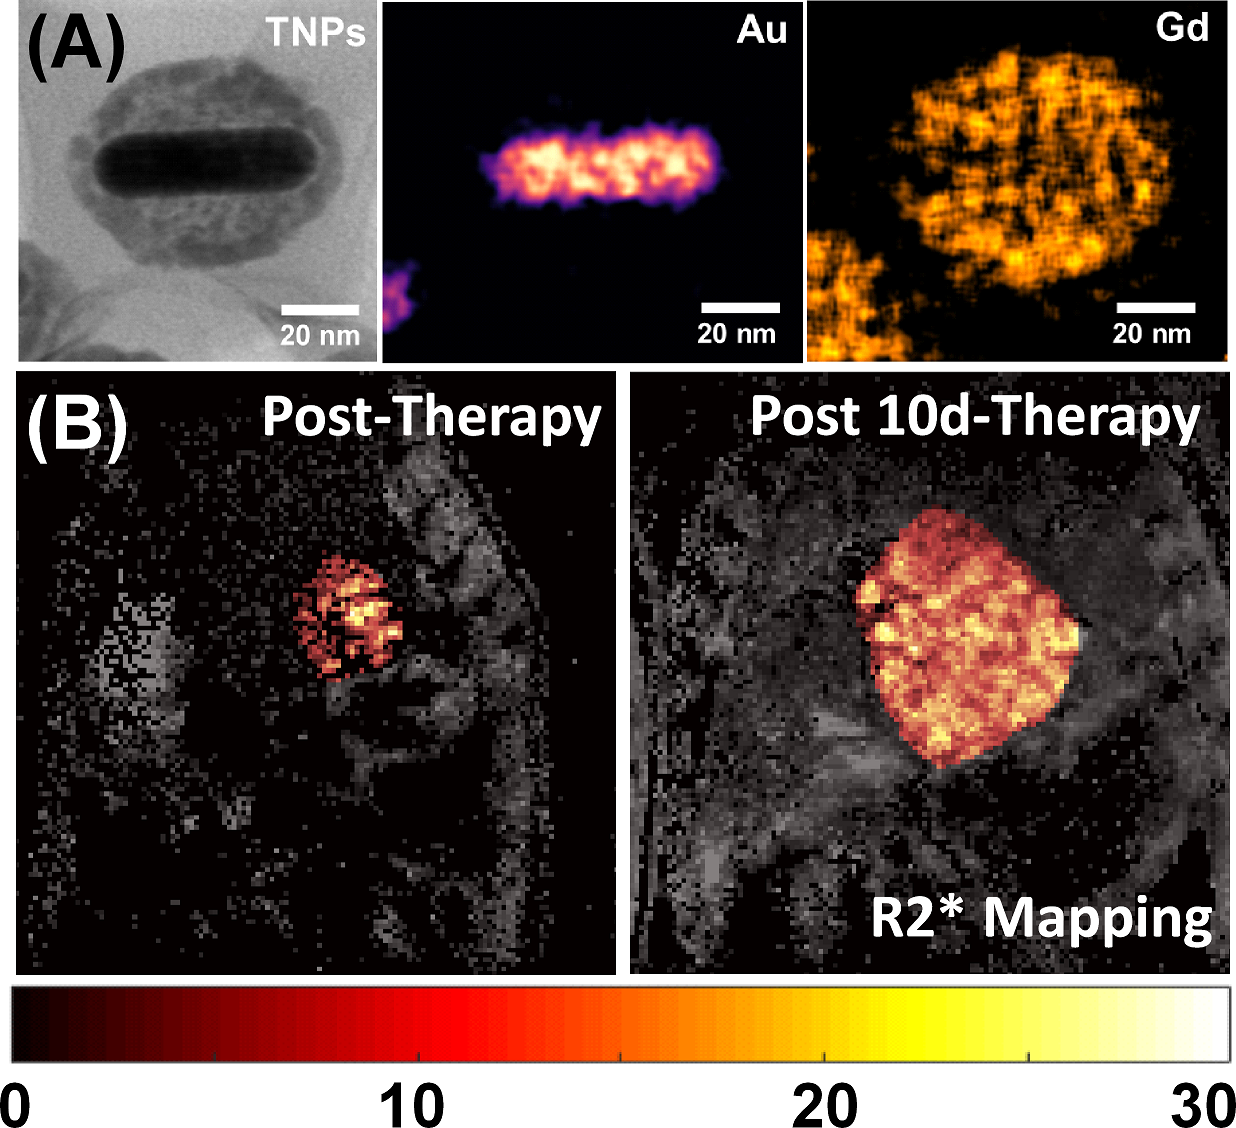
Schematic illustration of the site-selective delivery of TNPs via the hepatic portal vein and PTT using a catheter-based 808 nm near infrared (NIR) laser is depicted in Figure 1. Scanning size and elemental composition of TNPs using transmission electron microscopy is shown in Figure 2A. The longitudinal and transverse relaxivity of TNPs at 9.4T were R1 = 1.1 × 10⁸ mM−1 s−1 and R2 = 4.8 × 10⁸ mM−1 s−1, respectively. The CLRM tumor R2* relaxivity was 25.2±0.6 s-1 in post-PTT rats, which is ~5 times higher than normal liver R2* relaxivity (5.9±0.6 s-1). The tumor R2* relaxivity decreased to 15.3±0.9 s-1 at 10-days post therapy, which is ~3 times higher than normal value in the liver (5.9±0.6 s-1), as shown in Figure 2B. Statistical t-test results showed significant (P<.0001) difference between R2* values in tumor and normal tissues at the two imaging timepoints.DISCUSSION and CONCLUSION
CLRM tumor R2* relaxometry confirms that tumors with TNP mediated PTT treatment exhibit higher relaxivity compared to normal liver which persists up to 10 days post interventional TNP mediated ablation procedure. This contrast can be used as an imaging biomarker to distinguish between tumor and normal surrounding tissues, and it can potentially be developed as a marker of thermal damage to tumor tissue.
In conclusion, inclusion of MRI contrast in gold nanoparticles with plasmon resonance in near-infrared optical region can play a significant role in precise image-guided PTT by accurately tracking the tumor boundaries, which enables high-efficiency PTT by delivering a sufficient amount of light to the tumor.
Acknowledgements
No acknowledgement found.References
1. Parchur et al, ACS Nano; 12:6597-6611
2. Wahidiyat et al, Hematology; 22: 501-507
3. Garbowski et al, J Carduiovasc Magn Reson; 16:40
4. Kirk et al, J Magn Reson Imaging; 32:315-319
Figures