4351
MR Visualization of Macrophages’ Damage in Response to X-Irradiation by Detecting Intracellular SPIO Deposition1Division of Functional Imaging, National Cancer Center, Kashiwa, Japan, 2Division of Radiation Oncology and Particle Therapy, National Cancer Center, Kashiwa, Japan
Synopsis
The MR visualization of radiation treatment margins may be helpful during radiotherapy for liver cancer to monitor early response of the tumor and acute damage in non-tumor liver parenchyma. To demonstrate that MR signals from SPIO-labelled Kupffer cells may be changed in direct relation to the cellular response to x-irradiation, we examined the changes in transverse relaxation rates, R2’ (R2’=R2*-R2) of cell phantoms containing SPIO-labelled and x-irradiated macrophage-like J774A.1 cells in vitro. We found that x-irradiation to macrophages can cause SPIO deposition and R2’ elevation in a dose range of 0 to 10 Gy.
INRTODUCTION
In radiotherapy planning for liver tumors, the large margins are generally introduced in the planning target volume around the clinical target volume. The visualization of the actual treatment margins may be helpful during radiotherapy to monitor early response of the tumor as well as radiation-related acute tissue damage.1 Recently, treatment margins surrounding x-irradiated experimental liver tumors have been clearly visualized on T2*-weighted MR images recently after x-irradiation using superparamagnetic iron oxide (SPIO)-labelling technique.2 While undegradated SPIO particles in resident macrophages, or Kupffer cells, are attributed to the in vivo MR signal changes in treatment margins, it is necessary to perform in vitro experiments to demonstrate that MR signals from SPIO-labelled macrophages may be changed in direct relation to the cellular response to x-irradiation.
METHODS
We labelled macrophage-like J774A.1 cells (American Type Culture Collection, TIB-67TM; doubling time, 17 hrs) with ferucarbotran at a concentration of 10 µg iron/mL in culture medium for 16 hours according to a previous report3 and confirmed that almost 100% of cells were labelled. Subsequently, we performed x-irradiation to the labelled cells at doses of 0, 2, or 10 Gy using a low-energy x-ray unit (MBR-1605R-BE; Hitachi). Dose rate was typically 1.9 Gy/min. Growth inhibition were observed up to 3 days and more than 7 days at doses of 2 and 10 Gy in another experiment. On day 3, we harvested irradiated cells, fixed them with formalin-based fixatives, and suspended the cells in 1% agarose gel doped with 1 mM gadoteridol to prepare cell phantoms at a concentration of 2 × 10⁶ cells/mL. By using a 3 tesla MR scanner (Signa HDx, GE) and dedicated receiver coil, we acquired multi-gradient echo images (TR, 500 ms; TE, 4.5–25.0 ms [5 different TEs]; FA, 30°) and multi-fast spin echo images (TR, 10,000 ms; TE, 11.8–94.3 ms [8 different TEs; 11.8 ms in step]). After estimating R2* and R2 values in each cell phantom, we calculated the differences between R2* and R2 values (R2’ = R2* - R2) as a surrogate indicator of intracellular concentration of SPIO.4 Tukey’s test was performed to assess the differences in the average of R2’ values among the cell phantoms. Iron contents in another set of irradiated cells were measured using an inductively coupled plasma-mass spectrometer (ICP-MS 7700X; Agilent) and intracellular iron distribution was analyzed using Prussian blue stained cell samples.RESULTS
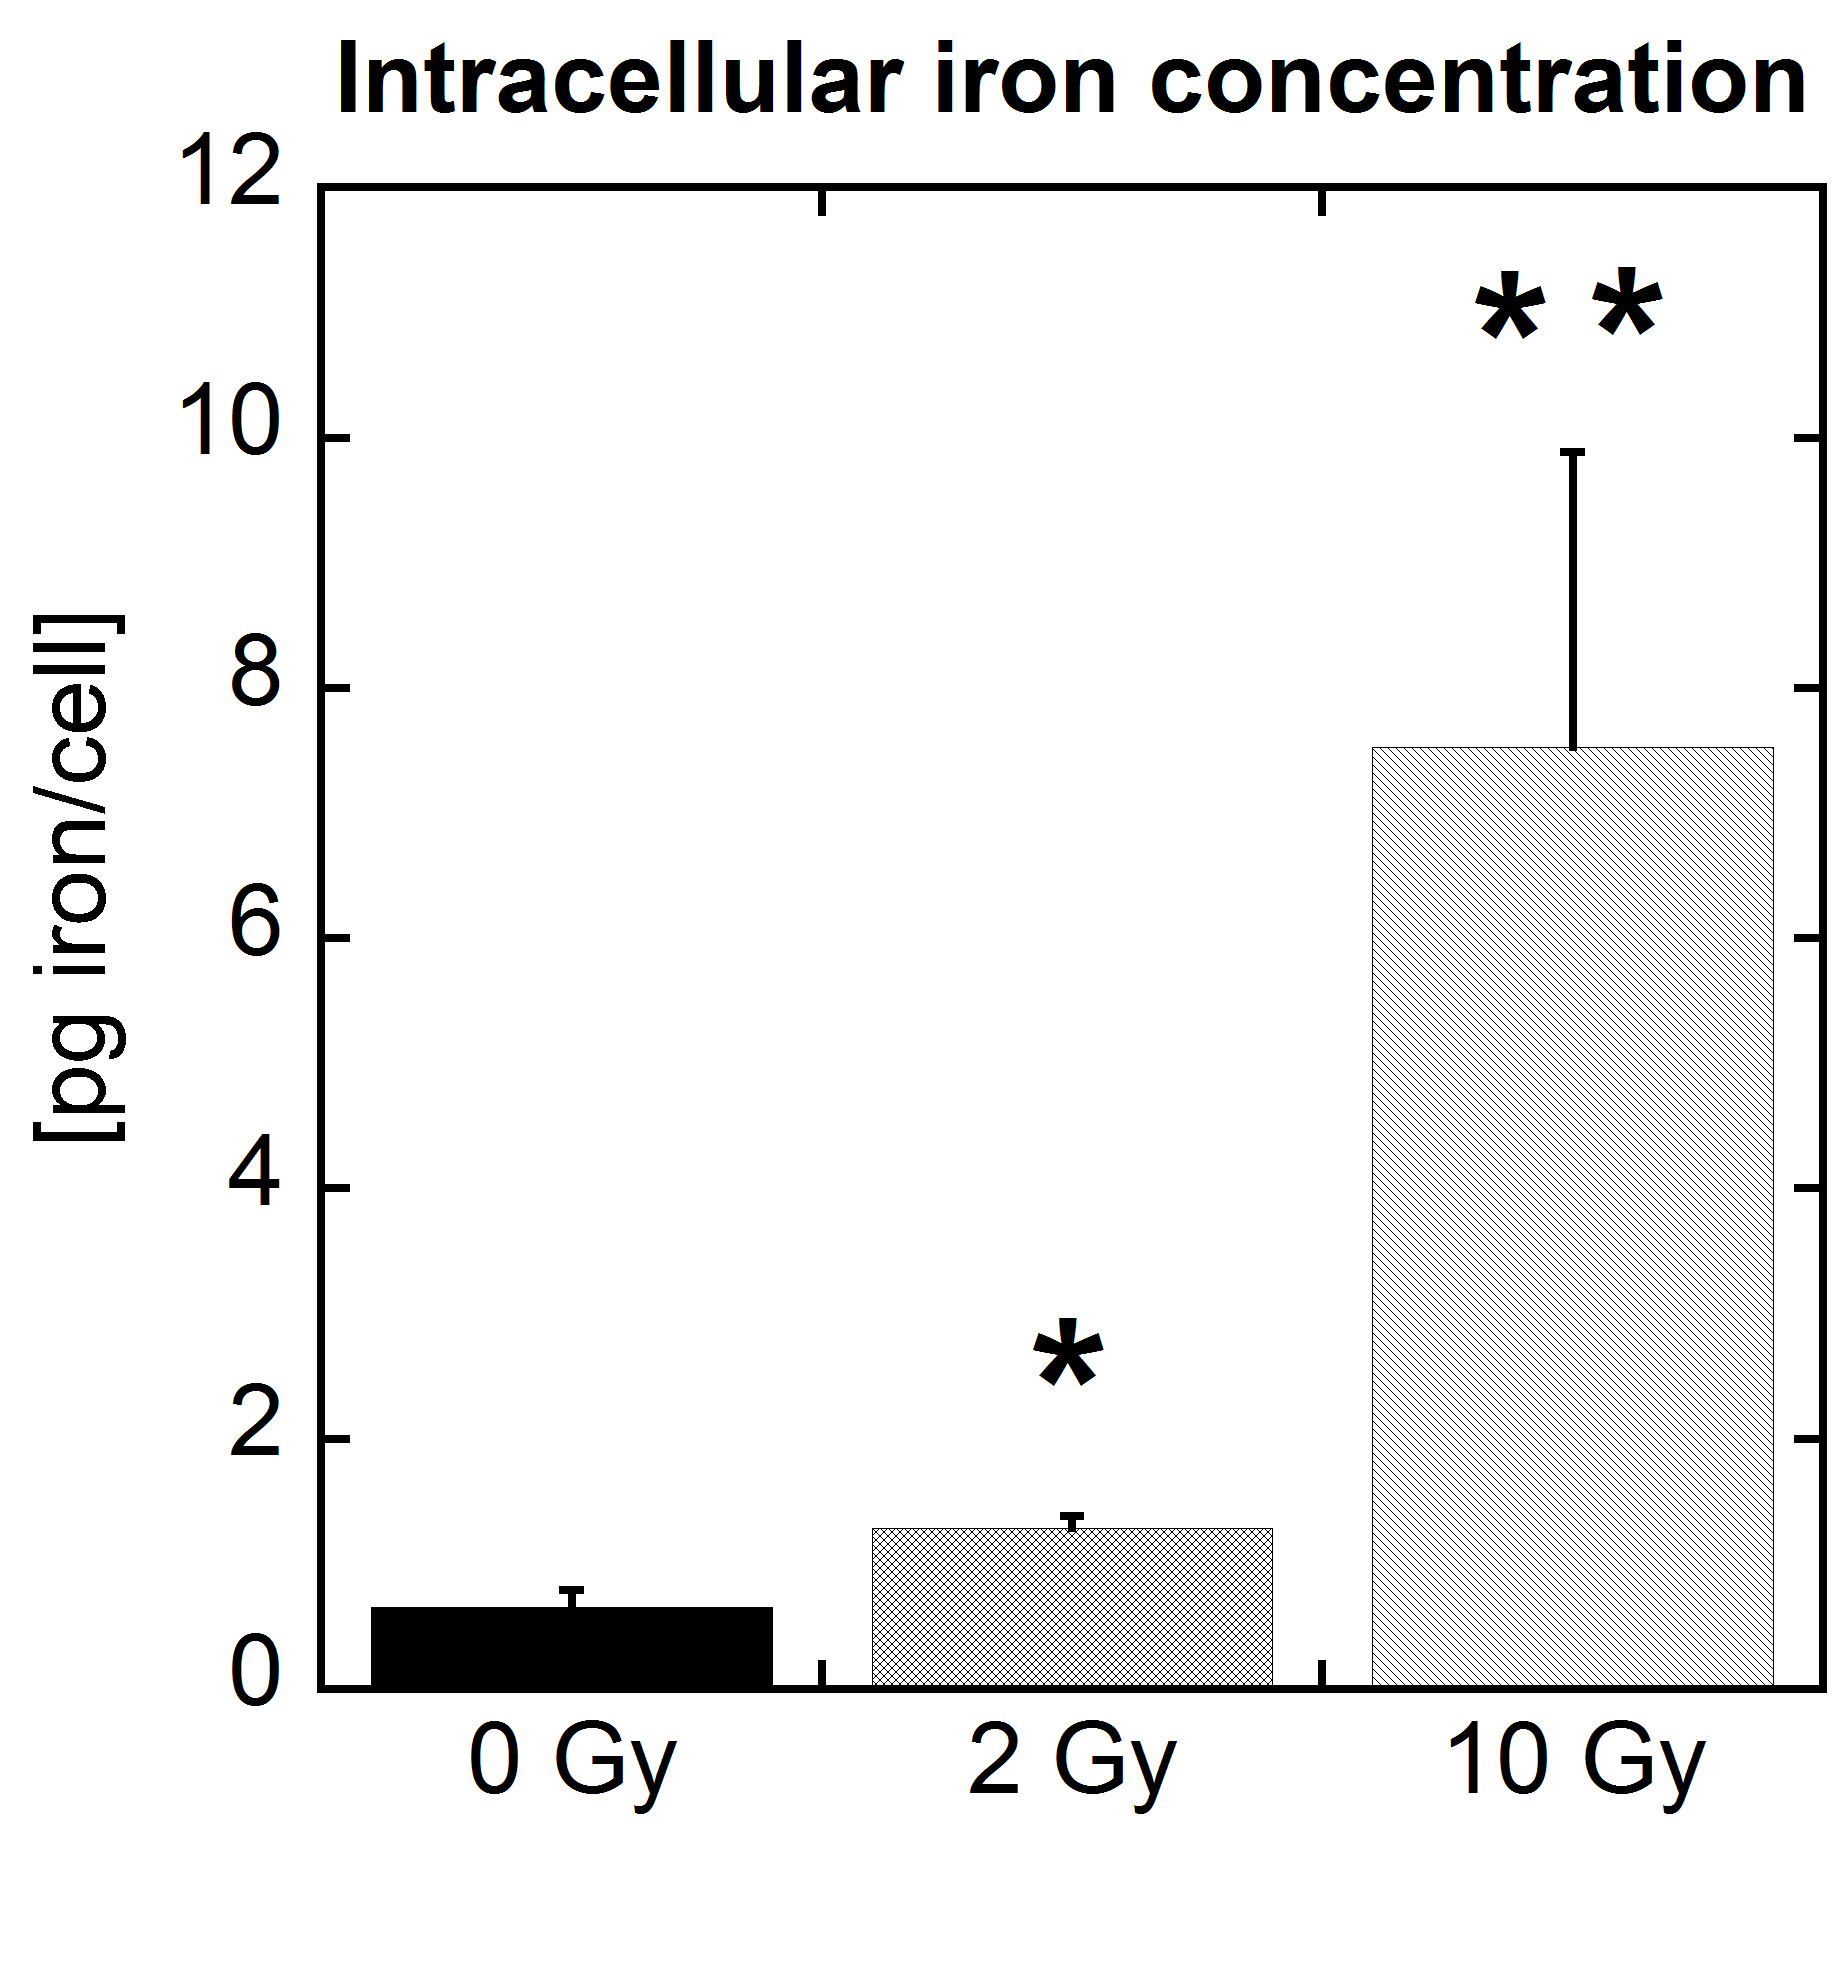
R2’ values were 3 ± 2, 24 ± 5, and 72 ± 5 [/sec] at 0, 2, and 10 Gy (average ± SD, n = 6, P <0.001, Fig. 1). ICP-MS demonstrated intra-cellular iron concentration of 0.65 ± 0.13, 1.28 ± 0.00, and 7.52 ± 2.36 [pg iron/cell] (n=3–6, P <0.001, Dunnett T3 test, Fig. 2), respectively. Prussian-blue staining found the irradiated cells contained a larger number of intracellular iron particles than non-irradiated cells (Fig. 3), while the irradiated cells were larger than non-irradiated cells (13 ± 2, 23 ± 7, and 40 ± 8 µm at 0, 2, and 10 Gy).DISCUSSION
We demonstrated that SPIO-labelled and subsequently x-irradiated macrophages exhibited higher R2’ than SPIO-labelled, but non-irradiated cells during 3 days. Further the increase in R2’ values as a function of radiation dose was significant. This suggests that the concentration of intra-cellular SPIOs can change in SPIO-labelled macrophages in response to x-irradiation, because R2’ is linearly related to the intracellular concentration of SPIOs based on the static dephasing theory.5 We consider that the significant increase in R2’ was caused by the suppression of cell growth as well as the damage in lysosomal degradation. It was also suggested that T2*-weighted MR images are sensitive in the detection of SPIO-labelled macrophages' response to x-irradiation in a particular dose range, because it appears likely that the magnetic susceptibility effect from intracellular SPIO increases R2* in the x-irradiated cells.CONCLUSION
X-irradiation to macrophages can cause intra-cellular SPIO deposition, and therefore dose-dependent elevations in R2’ in these cells in a specific dose range. Our results provide fundamental knowledge regarding SPIO-enhanced MRI as a monitoring imaging tool for radiotherapy for liver tumors.Acknowledgements
This study was supported by JSPS KAKENHI Grant Number JP16K10332 to MY.References
1. Schmidt MA and Payne GS. Radiotherapy Planning using MRI. Phys Med Biol 2015;60:323-361
2. Furuta T, Yamaguchi M, Fujii H, et al. Persistent T2*-hypointensity of the liver parenchyma after irradiation to the SPIO-accumulated liver: An imaging marker for responses to radiotherapy in hepatic malignancies. JMRI. 2017;45:303-312
3. Hsiao JK, Chu HH, Wang YH, et al. Macrophage physiological function after superparamagnetic iron oxide labeling. NMR in biomed. 2008;21:820-829.
4. Bowen CV, Zhang X, Saab G, et al. Application of the static dephasing regime theory to superparamagnetic iron-oxide loaded cells. MRM 2002;48:52-61
5. Yablonskiy DA and Haacke EM. Theory of NMR signal behavior in magnetically inhomogeneous tissues: the static dephasing regime. MRM 1994;32:749-763
Figures