4347
To evaluate the role of APT-w contrast, optimized for normalization and ROIs selection, in differentiating Infective and Neo-plastic Mass Lesions1Centre for Biomedical Engineering, Indian Institute of Technology Delhi, New Delhi, India, 2Center for Magnetic Resonance & Optical Imaging, University of Pennsylvania, Philadelphia, PA, United States, 3Department of Radiology, Fortis Memorial Research Institute, Gurgaon, Haryana, India, 4Department of Biomedical Engineering, All India Institute of Medical Science, New Delhi, India
Synopsis
Differentiation of intra-cranial-mass-lesions (
INTRODUCTION
Amide proton transfer weighted (APT-w) MRI1–3 is used for high-resolution molecular mapping of proteins/peptides and is being explored for different clinical applications4. Differentiation of various types of intra-cranial-mass-lesions (ICMLs) using conventional MRI is challenging5. APT-w contrast has shown potential applications in grading of tumors6,7, and differentiating lymphoma from high-grade-glioma8. Preliminary studies9 reported prospective of APT-MRI on tuberculoma. The objective of the study was to evaluate the potential of APT-w contrast, optimized for different normalizations, in differentiating infective and neoplastic mass lesions. ROI selection was optimized and histogram analysis of APT-w contrast was used in differentiation.METHODS
All the MRI experiments were performed at 3T whole body Ingenia MRI system (Philips) using a 15-channel d-stream head-neck coil for reception using a pulse-sequence reported previously10. Thirty-two patients of varying etiologies with neo-plastic mass lesions [Low Grade (LG) tumor(n=14), High Grade (HG) tumor(n=8), lymphoma (n=3)] and infective mass lesions [Tuberculoma(TBM) (n=6), tubercular-abscess (n=1)] were scanned in the current study. APT-w images were acquired at following frequency offsets: ±2.5, ± 3, ± 3.5, ±4, ±4.5 ppm from water and corrected for B0 inhomogeneity using B0 maps generated by WASSR11 approach (range is -1.5 to +1.5 ppm; interval is 0.125 ppm).
DATA PROCESSING: We used four types of normalizations for computing APT-w contrast:
Type-1: APT-w contrast normalized with M0
$$APT_{M_0} = \frac{M_{sat(-3.5ppm)} - M_{sat(+3.5ppm)}}{M_{0}}\times100$$
where, Msat(+3.5ppm) and Msat(-3.5ppm) are the signal intensities with upfield and downfield of water resonating frequency. M0 is the signal intensity without radio-frequency saturation.
Type-2: APT-w contrast normalized with Msat(-3.5ppm)
$$APT_{Neg} = \frac{M_{sat(-3.5ppm)} - M_{sat(+3.5ppm)}}{M_{sat(-3.5ppm)}}\times100$$
Type-3: APT-w contrast normalized with M0 and NAWM
$$APT_{M_{0}-NAWM} = {APT_{M_0} - M_{NAWM}}$$
where, MNAWM is the mean value of APTM0 in normal-appearing-white-matter(NAWM)
Type-4: APT-w contrast normalized with Msat(-3.5ppm) and NAWM
$$APT_{Neg-NAWM} = {APT_{Neg} - M_{NAWM}}$$
Here, MNAWM is calculated from APTNeg
Different types of ROIs were drawn on lesions of APT-w maps. ROI-1 was drawn on entire lesion region. cROI-2 was placed on contra-lateral region of ROI-1. ROI-2 was placed on inner-most portion of lesion (or necrotic region where lesion has necrosis). cROI-2 was placed contra-lateral to ROI-2. ROI-3 was the region on periphery of lesions with APT-w contrast more than 75th percentiles of periphery area (or ring region for lesions with necrotic tissue). cROI-3 was placed contra-lateral to ROI-3. Histogram analysis12 of APTM0_NAWM and APTNeg_NAWM corresponding to ROI-1 were carried out. Following histogram parameters were calculated : (a) mean, (b) standard deviation (SD), (c) median, (d) mode, (e) kurtosis, (f) skewness, (g) entropy, (h) full-width-at-half-maximum (FWHM), (h) mean of the values greater than 10th, 25th, 50th, 75th, 90th percentile (mtop10, mtop25, mtop50, mtop75, mtop90) of APT-w contrast. Student T-test with two tails, ANOVA with Tukey post-hoc test, receiver-operation-characteristics (ROC) - sensitivity, specificity, accuracy, cut off and area under curve (AUC) were computed to differentiate ICMLs. P<0.05 was considered significant.
RESULTS
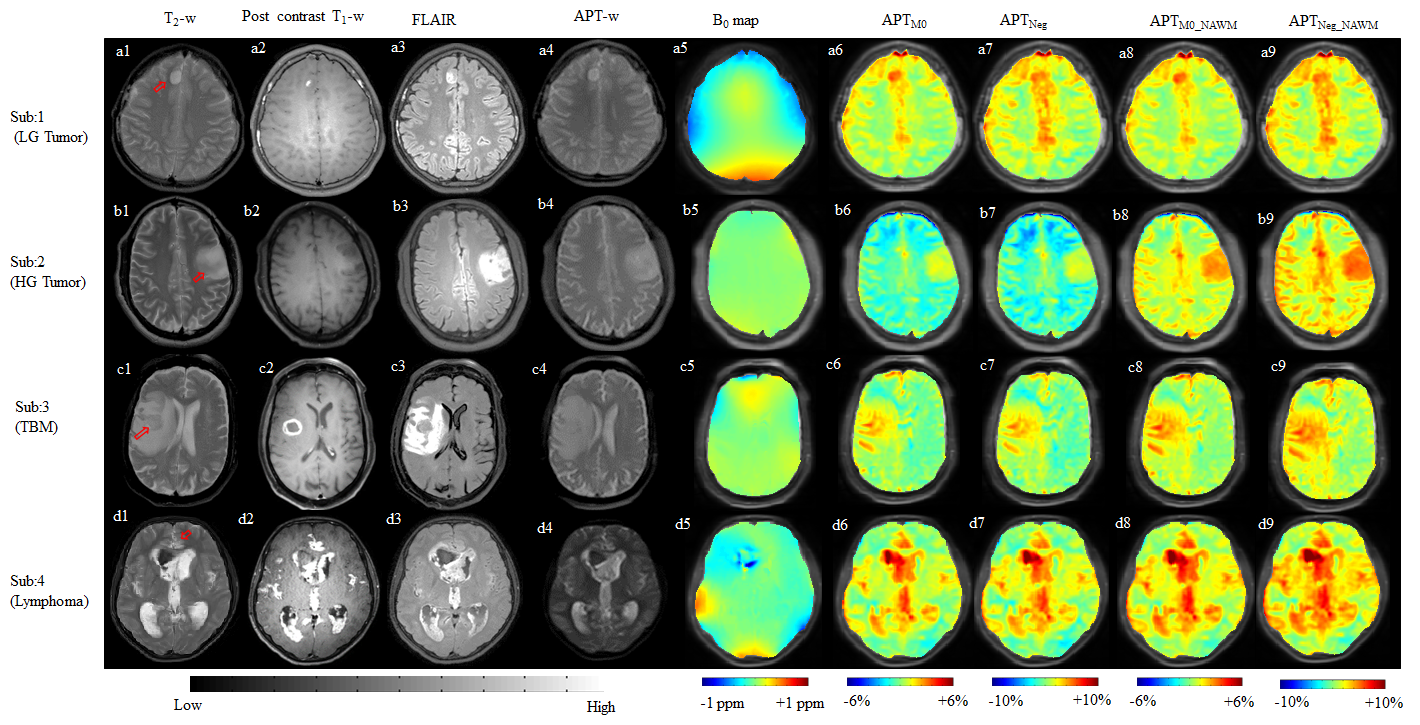
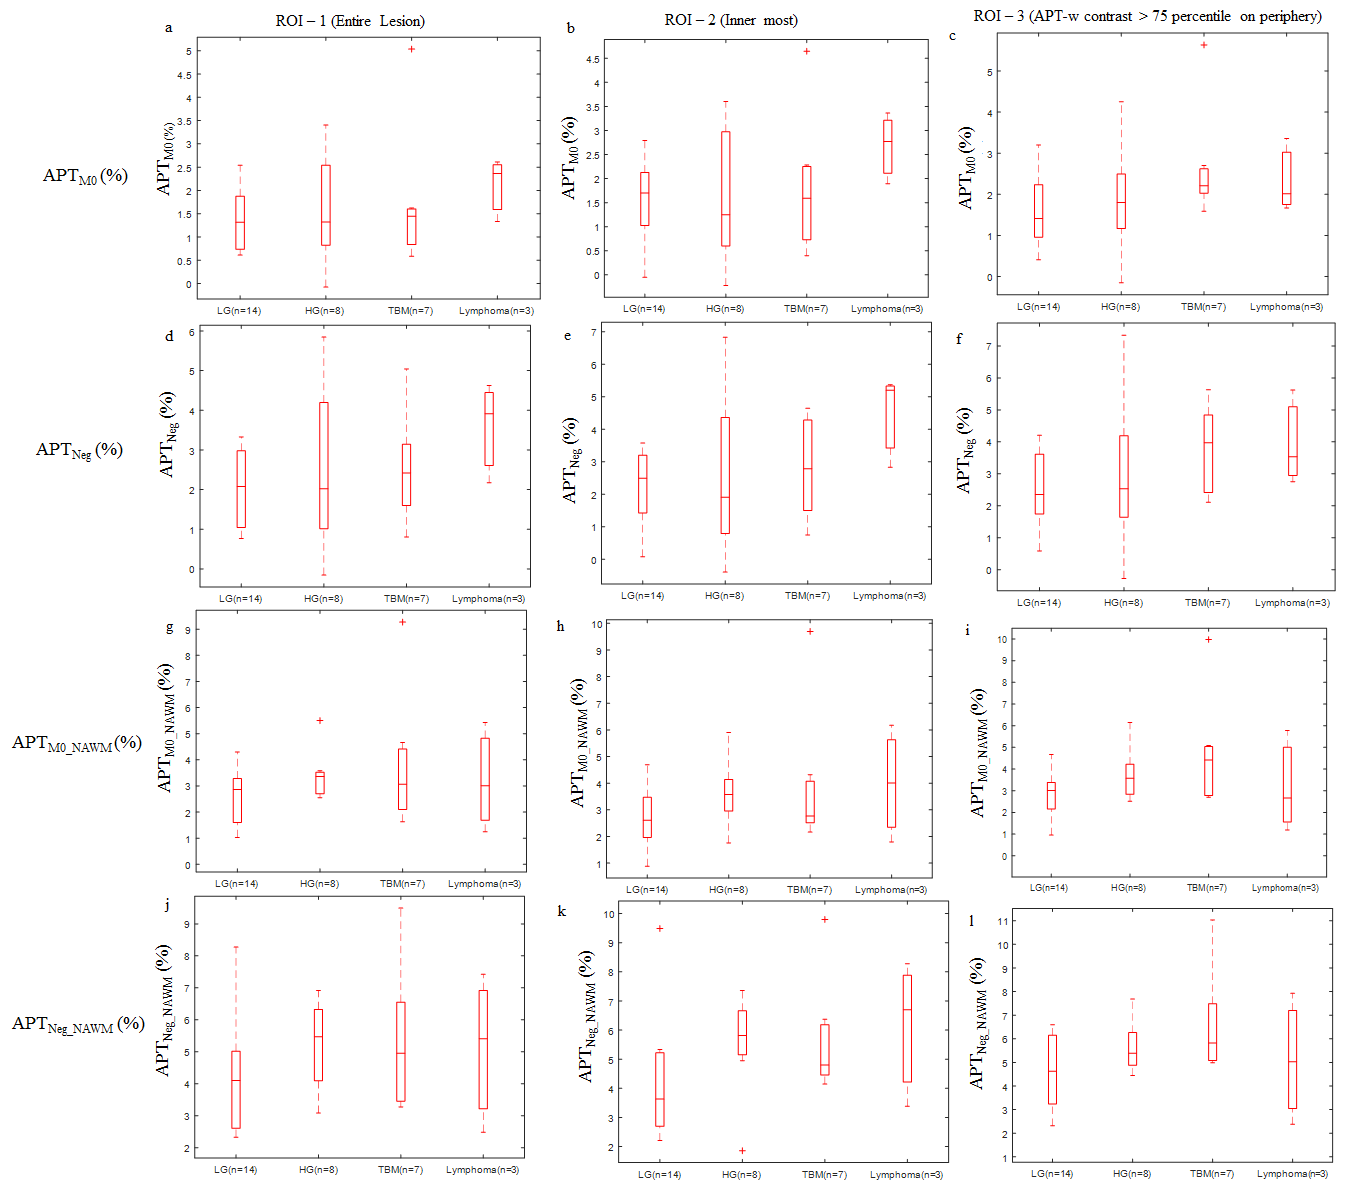
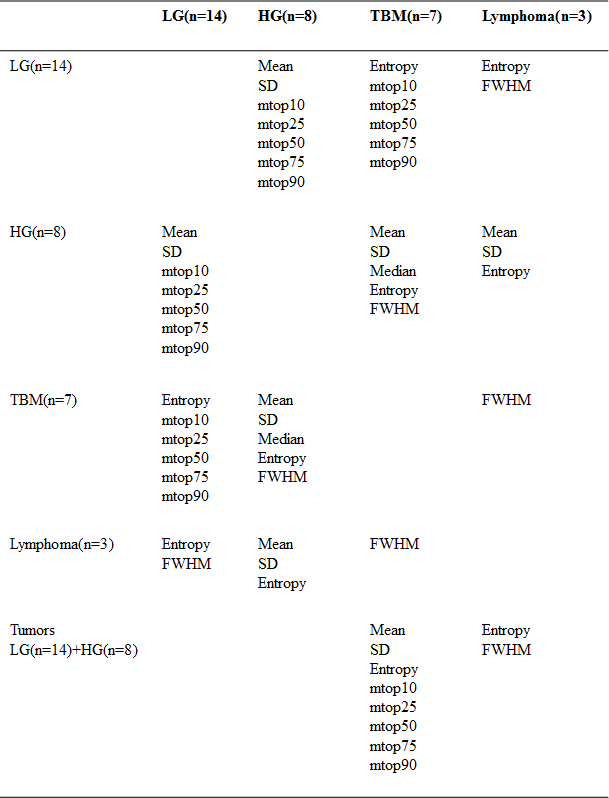
Fig.1 shows APT-w contrast maps, using different normalizations, for different ICMLs. Fig.2 shows there is a substantial overlap between mean APT-w contrast of HG tumors, infective lesions and lymphoma while LG tumors has lowest contrast irrespective of ROIs selection and normalizations. There was a significant difference (P<0.05) of APTNeg contrast between HG tumors (2.2383±1.22%) and Lymphoma (4.47±1.42%) for ROI-2. In the discrimination between them, the sensitivity and specificity of 67% and 100% respectively were observed with accuracy of 90.90% and area under curve (AUC) is 83.33%, when a cut-off value of 4.39% was applied for APTNeg contrast. LG tumors and infective lesions are significantly different (P<0.05) considering type-3 and type-4 normalizations for ROI-3. Table-1 shows those histogram parameters which can significantly differentiate (P<0.05) between two groups of ICMLs for APTM0_NAWM.DISCUSSION
We observed a higher APT-w contrast in HG than LG tumors, for all types of normalizations, which biologically manifest higher concentration of proteins and peptides in HG tumors. Though there was substantial overlap of mean APT-w contrast amongst ICMLs, there was significant difference among them by considering specific normalization and specific ROI. Thus, different types of normalizations are important to compute APT-w contrast to get a comprehensive view for differentiation among ICMLs. A higher SD in HG compared to LG tumors was observed, which manifests that HG tumor has more heterogeneity. APT-w contrast can be combined9 with other MRI techniques such as perfusion and diffusion MRI parameters for further improving differentiation between ICMLs.CONCLUSION
The present study demonstrates that APT-w contrast using appropriate normalization can differentiate infective and neoplastic mass lesions. Appropriate ROI selection and histogram analysis also play an important role in differentiation of lesions.Acknowledgements
The Authors acknowledge internal grant from IIT-Delhi; MATRICS SERB- MTR/2017/001021, NIH grant P41 EB015909 for APT pulse sequence and Philips India Limited for technical support in MRI data acquisition. The authors thanks Drs. Jinyuan Zhou, Yansong Zhao, Peter C.M. van Zijl, Indrajit Saha.References
1. Zhou J, Lal B, Wilson DA, Laterra J, Van Zijl PCM. Amide Proton Transfer (APT) Contrast for Imaging of Brain Tumors. Magn Reson Med 2003; 50:1120–1126.
2. Jones CK, Schlosser MJ, Van Zijl PCM, Pomper MG, Golay X, Zhou J. Amide proton transfer imaging of human brain tumors at 3T. Magn Reson Med 2006; 56:585–592.
3. Amandeep Salhotra, Bachchu Lal, John Laterra, Phillip Zhe Sun, Peter C. M. van Zijl1 JZ. Amide proton transfer imaging of 9L gliosarcoma and human glioblastoma xenografts. NMR Biomed 2008; 21: 489-497.
4. Zhao X, Wen Z, Zhang G, et al. Three-dimensional turbo-spin-echo amide proton transfer MR imaging at 3T and its application to high-grade human brain tumors. Mol Imaging Biol 2013; 15:114–122.
5. Law M, Yang S, Wang H, et al. Glioma Grading: Sensitivity, Specificity, and Predictive Values of Perfusion MR Imaging and Proton MR Spectroscopic Imaging Compared with Conventional MR Imaging. Am J Neuroradiol 2003; 24:1989–1998.
6. Togao O, Yoshiura T, Keupp J, et al. Amide proton transfer imaging of adult diffuse gliomas: Correlation with histopathological grades. Neuro Oncol 2014; 16:441–448.
7. Sakata A, Okada T, Yamamoto A, et al. Grading glial tumors with amide proton transfer MR imaging: different analytical approaches. J Neurooncol 2015; 122:339–348.
8. Jiang S, Yu H, Wang X, et al. Molecular MRI differentiation between primary central nervous system lymphomas and high-grade gliomas using endogenous protein-based amide proton transfer MR imaging at 3 Tesla. J Eur Radiol 2016:64–71.
9. Debnath A, et al. APT MRI of Intracranial Mass Lesions at 3T and Comparison with DCE Perfusion Parameters. Proc. Intl. Soc. Mag. Reson. Med.24(2016); 3712.
10. Zhou J, Zhu H, Lim M, et al. Three-dimensional amide proton transfer MR imaging of gliomas: Initial experience and comparison with gadolinium enhancement. J Magn Reson Imaging 2013; 38:1119–1128. 11. Kim M, Gillen J, Landman BA, Zhou J, Van Zijl PCM. Water saturation shift referencing (WASSR) for chemical exchange saturation transfer (CEST) experiments. Magn Reson Med 2009; 61:1441–1450.
12. Law M, Young R, Babb J, Pollack E, Johnson G. Histogram analysis versus region of interest analysis of dynamic susceptibility contrast perfusion MR imaging data in the grading of cerebral gliomas. AJNR Am J Neuroradiol 2007; 28:761–766.
Figures