4342
Imaging response to Elafibranor treatment in a rat model of non-alcoholic steatohepatitis non-invasively by oxidized-collagen molecular MRI1Athinoula A. Martinos Center for Biomedical Imaging, MGH, Harvard Medical School, Charlestown, MA, United States, 2Division of Surgical Oncology, Massachusetts General Hospital, Harvard Medical School, Boston, MA, United States, 3Institute for Innovation in Imaging (i3), Charlestown, MA, United States
Synopsis
Elafibranor is a dual agonist of the peroxisome proliferator-activated receptor-⍺ and δ (PPAR-⍺ and δ) in Phase III clinical trials for treatment of non-alcoholic steatohepatitis (NASH). Here, we evaluated the drug’s effectiveness in a choline-deficient high fat diet (CDAHFD) NASH model by imaging oxidized collagen as a marker for fibrogenesis in the liver using a Gd-based probe and MRI. Oxidized collagen MRI of the liver showed that Elafibranor successfully reduced fibrogenesis in rats with histologically-confirmed NASH, ex-vivo total collagen quantification by hydroxyproline assay, and histology staining, also confirmed the anti-fibrotic effect of Elafibranor in the CDAHFD-induced NASH model.
Introduction
Non-alcoholic steatohepatitis (NASH) is a complex disease that results from the progression of non-alcoholic fatty liver disease into inflamed fibrotic liver leading to fibrosis, which can further develop into cirrhosis, organ failure, and/or hepatocellular carcinoma.1 Disease management currently focuses on lifestyle changes with no pharmacological alternative, although many treatments are now being evaluated in clinical trials.2 Elafibranor, a drug that acts on both PPAR-⍺ and δ has shown promising outcomes in NASH patients. Here we assess the treatment response of Elafibranor in a CDAHFD rat model of NASH by molecular imaging with Gd-Hyd, a probe that detects oxidized collagen formed during active fibrosis.Methods
Synthesis: Gd-Hyd, an allysine targeted molecular probe for detection of oxidized collagen was synthesized as reported.3
Animal model: Male Wistar rats were fed a choline-deficient, L-amino acid-defined, high-fat diet consisting of 60 kcal% fat and 0.1% methionine by weight. There were 5 groups of rats that received CDAHFD for 6 weeks (N=7); 2) CDAHFD for 9 weeks (N = 8); 3) CDAHFD for 9 weeks, but who were treated with 30 mg/kg p.o Elafibranor daily for 3 weeks starting at week 6 (N=8); 4) CDAHFD for 6 weeks and then switched to a normal diet for 3 weeks (N=8); 5) normal diet (control rats) and who were matched for age and weight (N = 12).
In vivo MRI: Animals were scanned in a 1.5 T Siemens clinical scanner. Three T1-weighted 3D gradient echo (VIBE) scans were obtained as baseline (TE/TR = 1.84/6.28 ms, Avg = 1, flip angle = 11˚), and then sequentially for 20 minutes after animals received Gd-Hyd at a dose of 100 µmol/kg.
Image analysis: Images were analyzed using ImageJ. The change in signal to-noise ratio was quantified and reported as a percentage compared to pre-injection scans. The area under the change in signal to noise curve was calculated for every scan series using GraphPad Prism and every group was compared by a one-way ANOVA and Tukey’s post-hoc test.
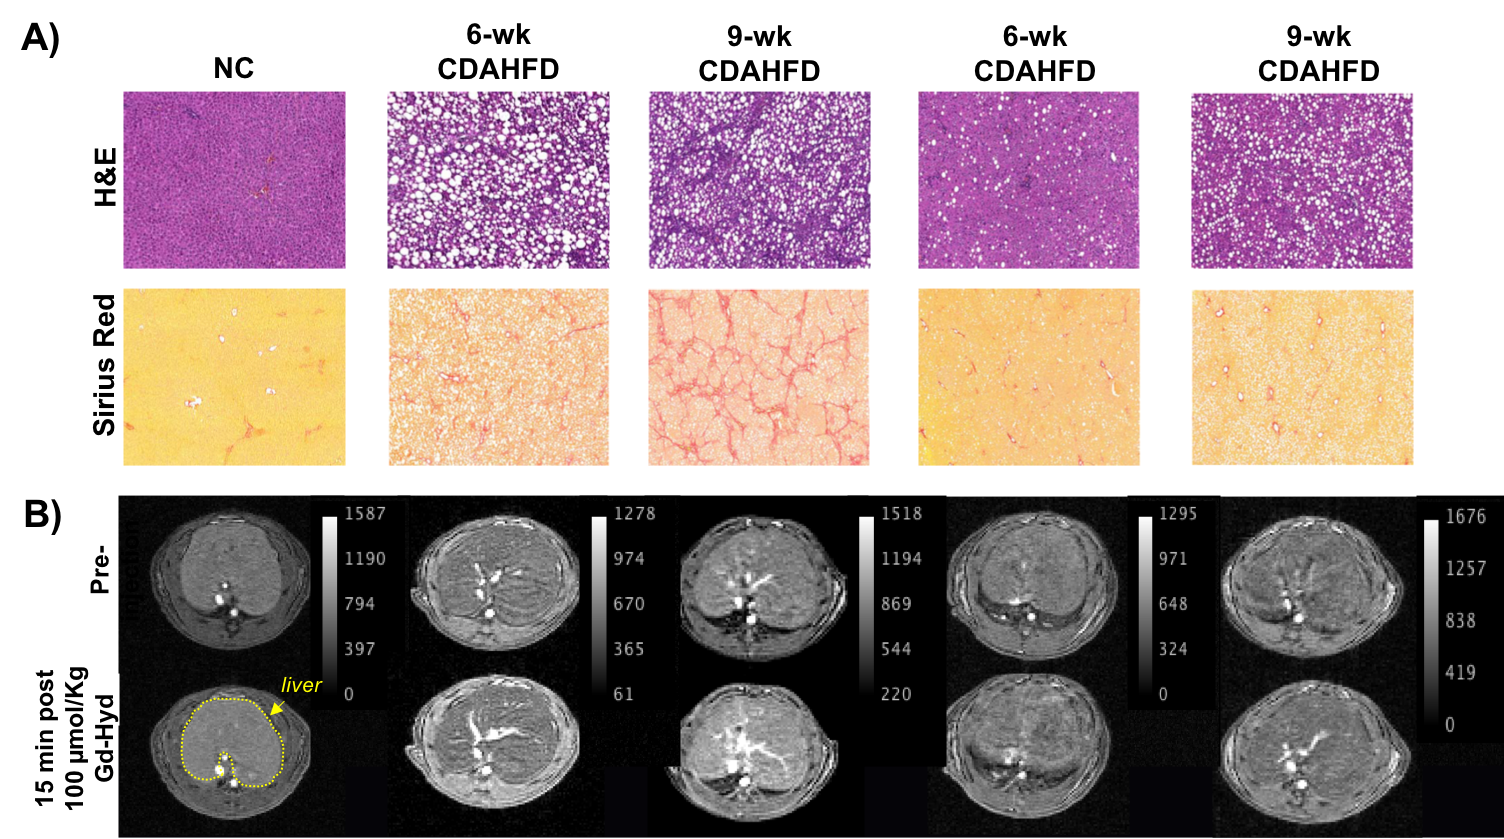
Ex-vivo tissue analyses: After MR imaging, livers were resected, sectioned, and stained with H&E and Sirius Red. Fat content was estimated from morphometric analysis (ImageJ) of the H&E tissue and collagen proportionate area (CPA) from the fraction of red tissue on the Sirius Red stained tissue. Liver was also assayed for hydroxyproline content as a measure of total liver collagen.
Results
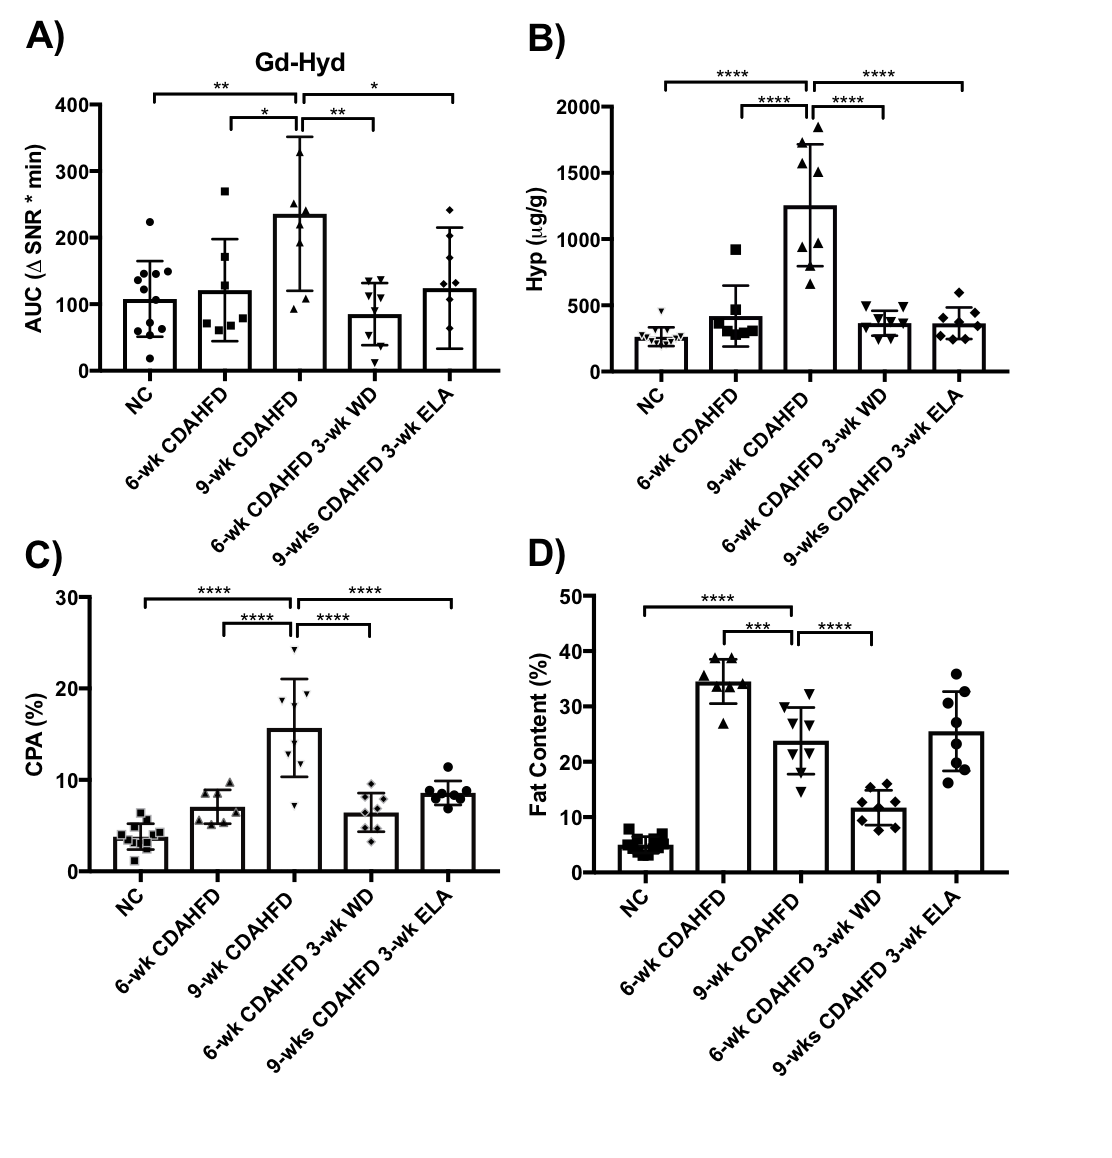
CDAHFD results in rapid formation of liver steatosis apparent as lipid droplets seen in H&E images. Fibrosis is evident as red bridging structures in the Sirius Red images. Steatosis is highest at 6 weeks and decreases at 9 weeks of diet where the fatty liver becomes more fibrotic (Figure 1A). Switching to normal diet for 3 weeks after 6 weeks of CDAHFD resulted in a significant reduction in steatosis (23.8 ± 6.03 vs. 11.7 ± 3.15 %, p < 0.0001 ) and fibrosis (CPA: 15.7 ± 5.35 vs 6.45 ± 2.12 %, p < 0.0001; hydroxyproline: 1256 ± 459.4 vs. 365.4 ± 94.3 µg/g, p < 0.0001) compared to animals who remained on CDAHFD. Elafibranor treatment resulted in a significant reduction in fibrosis compared to untreated animals (CPA: 8.6 ± 1.3 %, p < 0.0001; hydroxyproline: 365 ± 119 µg/g, p < 0.0001) but no significant reduction in steatosis. We assessed liver fibrosis disease activity non-invasively by MRI with Gd-Hyd, a probe previously shown to detect active fibrosis in the lungs and liver by undergoing a reversible condensation reaction with aldehydes found in oxidized collagen.3 After administration of the probe, liver enhancement was observed most markedly in the 9-week CDAHFD group, but was significantly lower in the diet change group (235.8 ± 115.7 vs 85.11 ± 46.6 %*min, p < 0.01.) and in the Elafibranor treatment group (124.2 ± 90.89 %*min, p < 0.05) as illustrated in Figure 1B. The AUC values in the diet change and Elafibranor groups were similar to that measured in control rats with no disease.Discussion and Conclusion
In an effort to recapitulate human NASH, a CDAHFD promoted both liver steatosis, and fibrosis. Both pathological characteristics were confirmed with independent measurements of fat content, and collagen deposition. Molecular MR imaging of oxidized collagen successfully reported the development of active fibrosis and treatment response to Elafibranor as liver enhancements returned to levels similar to normal control animals.
These results indicate that MR imaging of oxidized collagen sensitively detects the fibrotic progression of NASH and also reduction after treatment, highlighting the usefulness of non-invasive oxidized collagen molecular MRI as a tool to assess therapeutic efficacy during drug development for NASH.
Acknowledgements
No acknowledgement found.References
1. Ahmed, M., Non-alcoholic fatty liver disease in 2015. World J Hepatol 2015, 7 (11), 1450-9.
2. Serfaty, L., Management of patients with non-alcoholic steatohepatitis (NASH) in real life. Liver Int 2018, 38 Suppl 1, 52-55.
3. Chen, H. H.; Waghorn, P. A.; Wei, L.; Tapias, L. F.; Schu Hle, D. T.; Rotile, N. J.; Jones, C. M.; Looby, R. J.; Zhao, G.; Elliott, J. M.; Probst, C. K.; Mino-Kenudson, M.; Lauwers, G. Y.; Tager, A. M.; Tanabe, K. K.; Lanuti, M.; Fuchs, B. C.; Caravan, P., Molecular imaging of oxidized collagen quantifies pulmonary and hepatic fibrogenesis. JCI Insight 2017, 2 (11).
4. Gross, B.; Hennuyer, N.; Bouchaert, E.; Rommens, C.; Grillot, D.; Mezdour, H.; Staels, B., Generation and characterization of a humanized PPARdelta mouse model. Br J Pharmacol 2011, 164 (1), 192-208.
Figures