4341
Ultrasmall iron oxide particle-enhanced MR imaging of fibrogenesis and fibrolysis of liver fibrosis in mice1Laboratory of Imaging Biomarkers, UMR 1149 INSERM-University Paris Diderot, Sorbonne Paris cité, Department of Radiology, Beaujon University Hospital Paris Nord, Clichy, France, 2Unité de technologies Chimiques et biologiques pour la santé (UTCBS), ENSCP Chimie-Paristech, UMR 8258, U1022, University Paris Descartes, Paris, France
Synopsis
The aim of our study was to assess if hepatic fibrogenesis and fibrolysis could by differentiated with USPIO-enhanced MR imaging in mice, based on differential uptake of fluorescent USPIO by macrophages. The change in R2* were significantly higher in the fibrogenesis group compared to the healthy group and the regression group 24 hours after the injection of USPIO. Higher USPIO uptake was observed with fluorescence microscopy during fibrogenesis relative to uptake in fibrolysis and healthy livers. Significant correlation was found between R2* and fluorescence intensity. These results suggest that the dynamics of fibrogenesis can be assessed with USPIO enhanced MR imaging.
Introduction
The dynamics of liver fibrosis is governed by different populations of macrophages/monocytes1. During inflammation and fibrogenesis, pro-inflammatory bone derived monocytes stimulate hepatic stellate cell activation and extracellular matrix deposition. In contrast, during regression of inflammation and fibrosis, macrophages adopt a pro-resolution phenotype characterized by expression of anti-inflammatory mediators and matrix degrading metalloproteinases2,3.
Nanoparticle uptake, including uptake of ultrasmall iron oxide particles (USPIO), into macrophages is variable4. Preliminary in vitro studies suggest higher uptake of USPIO in pro-inflammatory than in pro-resolution macrophages4,5. Therefore, the aim of our study was to assess if hepatic fibrogenesis and fibrolysis could by differentiated with USPIO-enhanced MR imaging in mice, based on differential uptake of USPIO in macrophages.
Materials and methods
Animal model
Three groups (fibrogenesis, fibrosis regression and healthy controls, n = 10 per group) of C57BL/6 mice were used. Liver fibrosis was induced by intraperitoneal injections of CCl4 (0.5 mL/kg), twice per week for 6 weeks.
MR imaging
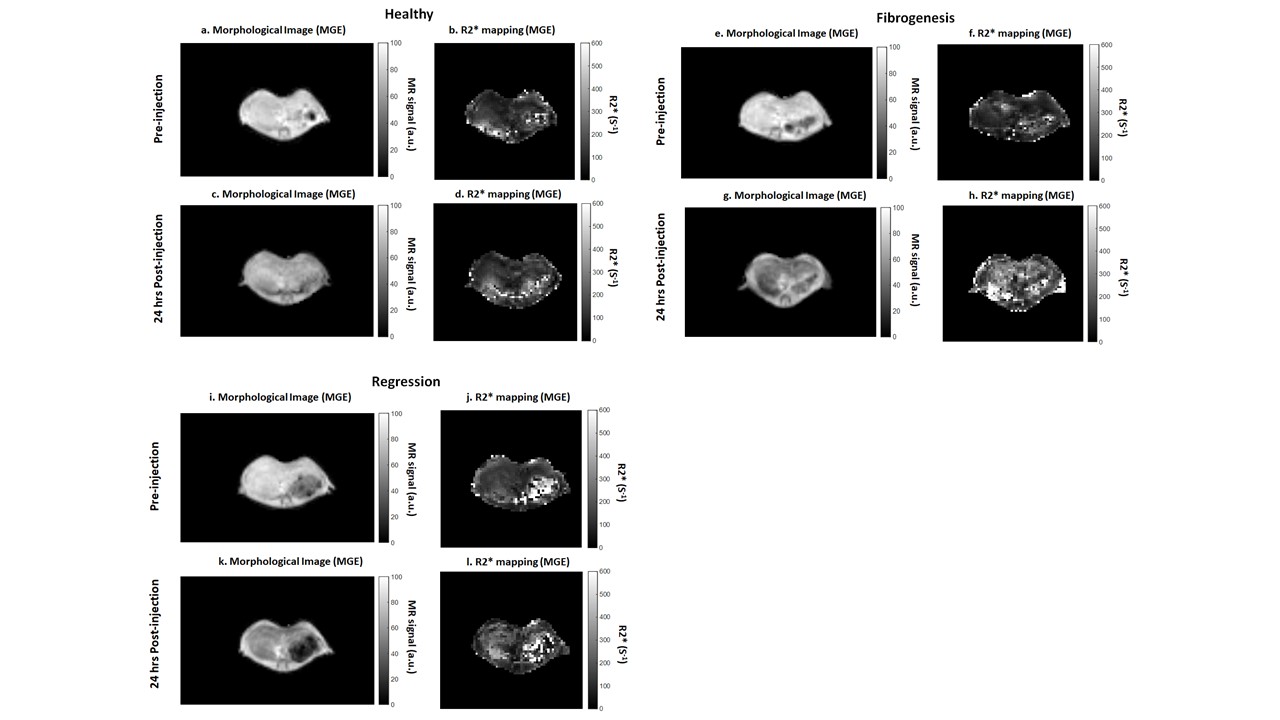
MR imaging was performed on a 7T Bruker system (BioSpec 70/30 USR, Bruker, Germany). Relaxation rates (R2*) were obtained with a multi-gradient-echo (MGE) sequence with TE/TR 1.23/800 ms, 16 echoes, interecho delay 0.8 ms, half-Gaussian pulse (duration of 0.8 ms), flip angle = 19°, field of view 50 x 50 mm2, matrix size 64 x 128, slice thickness = 1 mm, averages = 2, bandwidth 100 kHz, respiratory triggering. P01240 – fluorescent USPIO (hydrodynamic diameter = 25-30 nm; r2 = 94 s-1mM-1 at 7 T; CheMatech, Dijon, France) were used as contrast agent. MR imaging was performed before and 24 hours after intravenous injection of P01240 at 20 µmol Fe/kg. For the fibrogenesis and fibrosis regression groups, imaging was performed at 4 and 24 hours, respectively, following the last CCl4 injection.
Regions of interest were manually placed on the central axial MR image and on a homogenous area of the right hepatic lobe that was devoid of large blood vessels (0.27 ± 0.06 cm2). R2* quantification was performed by fitting {\sqrt{\left[(Ce^{(-TE\times R2^*)})^2+D^{2}\right]}}, against the signal decay with C, D and T2* as free parameters using the lmfit C++ library under Matlab graphical control6 and the changes in R2* (∆R2*) after USPIO were measured.
Confocal microscopy
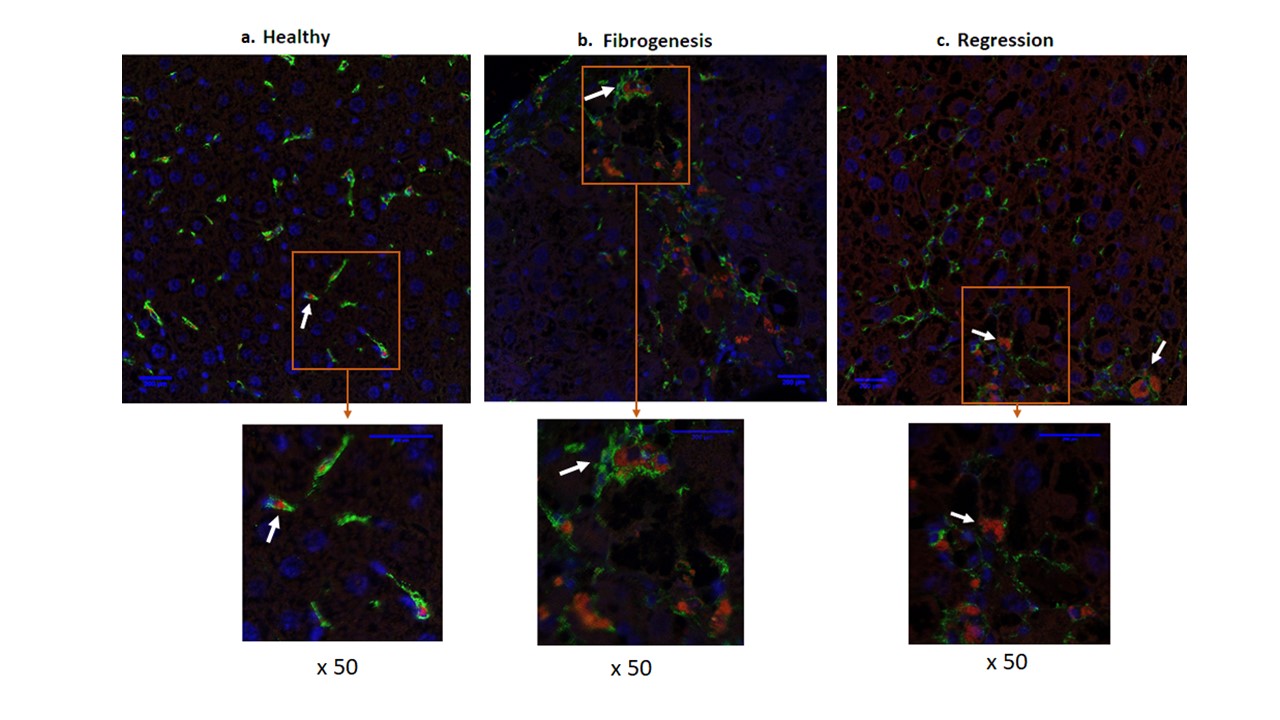
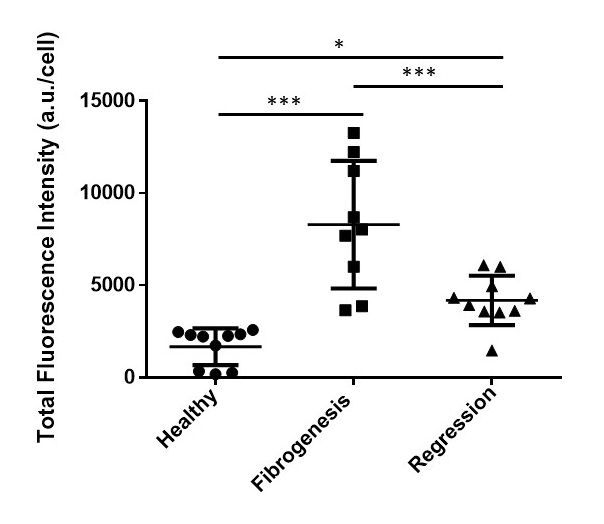
The macrophages of the liver sections were immunostained for the macrophage marker F4/80 and the nuclei were stained with Hoechst dye. The USPIO were detected by their intrinsic rhodamine fluorescence. The total USPIO fluorescence intensity was calculated by multiplying the mean fluorescence intensity by the number of phagocytic macrophages.
Results
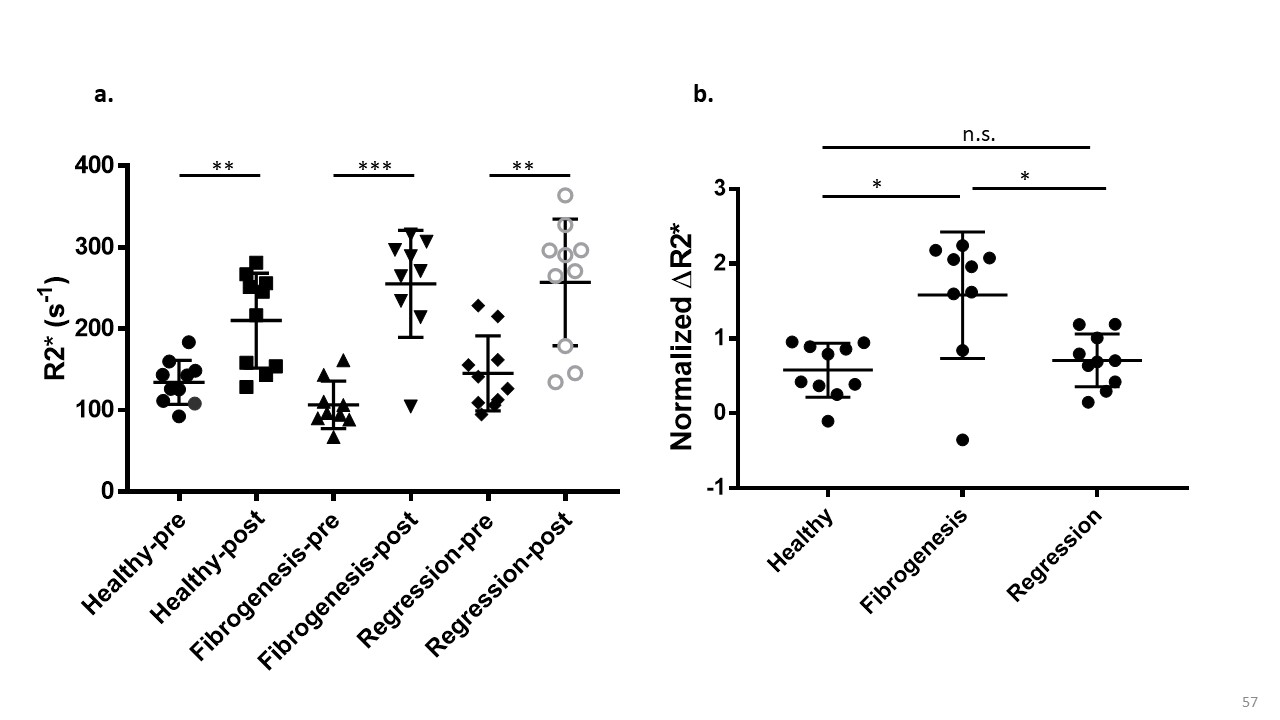
Relative to the precontrast R2*, significantly increased R2* was observed 24 hours after the injection of USPIO in the three study groups (healthy: 106.30 ± 19.91 s-1 before USPIO injection versus 192.90 ± 78.06 s-1 after injection, p < 0.05; fibrogenesis: 66.92 ± 9.99 s-1 versus 230.40 ± 97.42 s-1, p < 0.001; regression: 101.80 ± 14.43 s-1 versus 201.04 ± 66.74 s-1 p < 0.001). The ∆R2* were significantly higher in the fibrogenesis group compared to the healthy group (2.47 ± 1.42 AU versus 0.86 ± 0.77 AU, p < 0.05) and the regression group (1.02 ± 0.74 AU, p < 0.05). No significant difference was found between the healthy and the regression groups (p = 0.99) (Figures 1, 2).
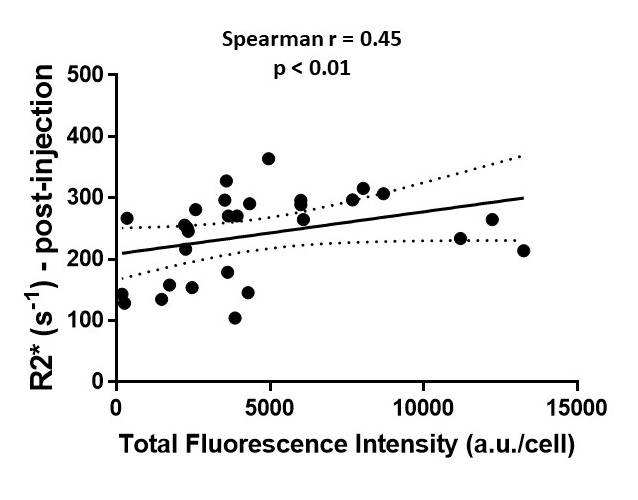
Total fluorescence intensity showed higher uptake of USPIO by macrophages in the fibrogenesis group compared to the healthy group (8293 ± 3460 AU versus 1167 ± 996 AU, p < 0.0001) and the regression group (4180 ± 1338 AU, p < 0.001). Moreover, the mean fluorescence intensity was significantly higher in the regression group than in the healthy group (p < 0.05) (Figures 3, 4). A significant correlation was observed between R2* and fluorescence intensity (Spearman r = 0.45, p < 0.05) (Figure 5).
Discussion
In this study, we showed the feasibility of differentiating between hepatic fibrogenesis and fibrolysis in vivo in mice based on the accumulation of a bimodal contrast agent in differentially activated macrophages. We found significantly higher ∆R2* during fibrogenesis, suggesting increased number and strong endocytosis capacity of pro-inflammatory macrophages. The efficient capability of pro-inflammatory macrophages to take up USPIO was confirmed with fluorescence microscopy and is in accordance with a previously in vitro study5.
Earlier studies using USPIO have reported defective hepatic macrophage uptake in chronic non-alcoholic fatty liver disease7,8 and cirrhosis9. However, the dynamics of fibrogenesis was not assessed in these studies.
Conclusion
During fibrogenesis, we observed increased USPIO uptake in hepatic macrophages relative to uptake in fibrolysis and healthy liver. These results suggest that the dynamics of fibrogenesis can be assessed with USPIO enhanced MR imaging.Acknowledgements
This work was financed by the interdisciplinary program « Imagerie du vivant » of Sorbonne Paris. Thanks to the FRIM imaging platform (University Paris Diderot) for the provision of the infrastructure used in this work.References
1. Tacke F, Zimmermann HW. Macrophage heterogeneity in liver injury and fibrosis. J Hepatol 2014; 60(5): 1090-6.
2. Ramachandran P, Pellicoro A, Vernon MA, et al. Differential Ly-6C expression identifies the recruited macrophage phenotype, which orchestrates the regression of murine liver fibrosis. Proc Natl Acad Sci U S A 2012; 109(46): E3186-95.
3. Tacke F. Targeting hepatic macrophages to treat liver diseases. J Hepatol 2017; 66(6): 1300-12.
4. Weissleder R, Nahrendorf M, Pittet MJ. Imaging macrophages with nanoparticles. Nat Mater 2014; 13(2): 125-38.
5. Khaled W, Piraquive J, Leporq B, et al. In vitro distinction between proinflammatory and antiinflammatory macrophages with gadolinium-liposomes and ultrasmall superparamagnetic iron oxide particles at 3.0T. Journal of Magnetic Resonance Imaging 2018.
6. Girard OM, Ramirez R, McCarty S, Mattrey RF. Toward absolute quantification of iron oxide nanoparticles as well as cell internalized fraction using multiparametric MRI. Contrast Media Mol Imaging 2012; 7(4): 411-7.
7. Asanuma T, Ono M, Kubota K, et al. Super paramagnetic iron oxide MRI shows defective Kupffer cell uptake function in non-alcoholic fatty liver disease. Gut 2010; 59(2): 258-66.
8. Smits LP, Coolen BF, Panno MD, et al. Noninvasive Differentiation between Hepatic Steatosis and Steatohepatitis with MR Imaging Enhanced with USPIOs in Patients with Nonalcoholic Fatty Liver Disease: A Proof-of-Concept Study. Radiology 2016; 278(3): 782-91.
9. Tanimoto A, Yuasa Y, Shinmoto H, et al. Superparamagnetic iron oxide-mediated hepatic signal intensity change in patients with and without cirrhosis: pulse sequence effects and Kupffer cell function. Radiology 2002; 222(3): 661-6.
Figures