4340
A Static Susceptibility Model for MR Images Enhanced by Targeted Magnetic Nanoparticles to Accurately Measure Glomerular Volume in Rat Kidneys1Physics, University of Hawaii at Manoa, HONOLULU, HI, United States, 2Radiology, Washington University in St. Louis, St. Louis, MO, United States
Synopsis
It is believed that under nephron loss, remaining nephrons compensate by undergoing hypertrophy to maintain a constant filtration surface area and thus maintain homeostasis in GFR. Yet, there are no tools in the clinical setting to measure nephron endowment or glomerular size distribution. Here we used CFE-MRI, a good indicator of nephron number, and a classical model of static susceptibility to accurately measure glomerulus size in the kidneys of rats.
Introduction
It is thought that reduced nephron number is the primary cause of reduced kidney function1. Cationic ferritin (CF) enhanced MRI (CFE-MRI) measures glomerular number and individual glomerular volume (IGV) in the excised and perfused kidneys2-4 The IGV distribution may be useful in detecting the early signs of disease. Currently, IGV calculated from MR images is validated with measurements of glomerulus size from histology sections of the same kidney. A physical model of the susceptibility-induced artifact by CF accumulation on the glomerulus will enable accurate quantitative measurement of IGV without the need for stereology. In this work, we use spin echo (SE) and gradient recalled echo (GRE) measurements of glomerular profiles along with a classical model of static susceptibility5-8 to correct IGV measurements in CFE-MRI.Methods
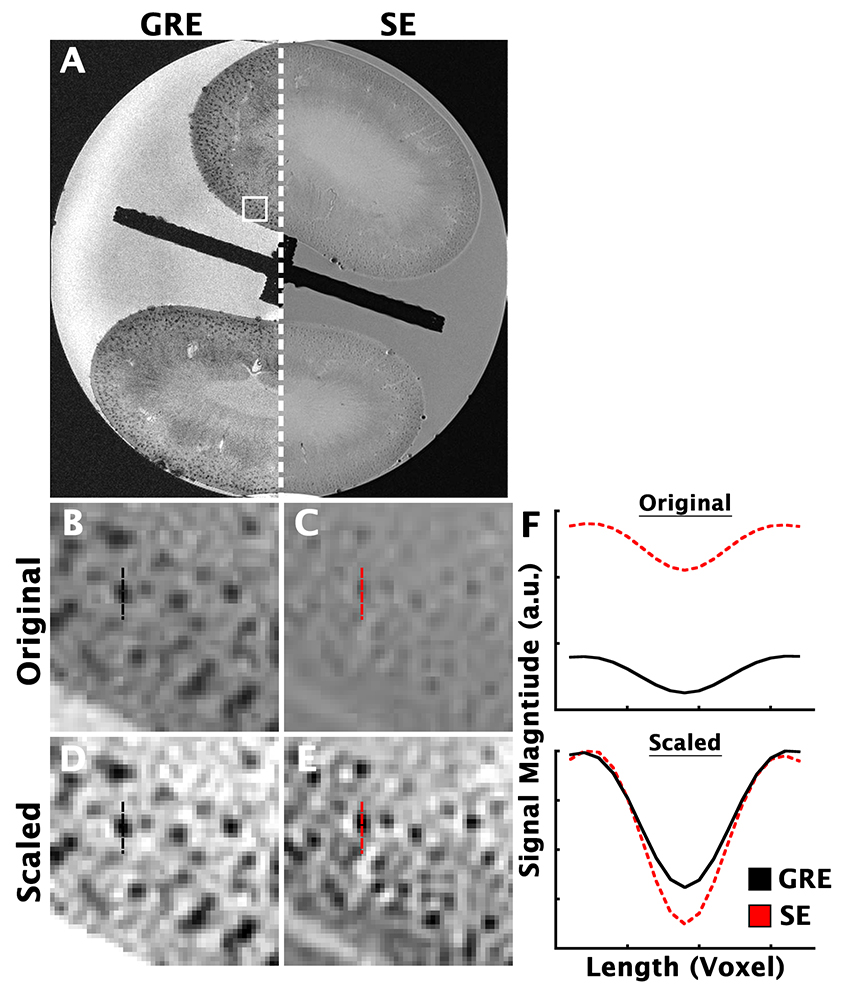
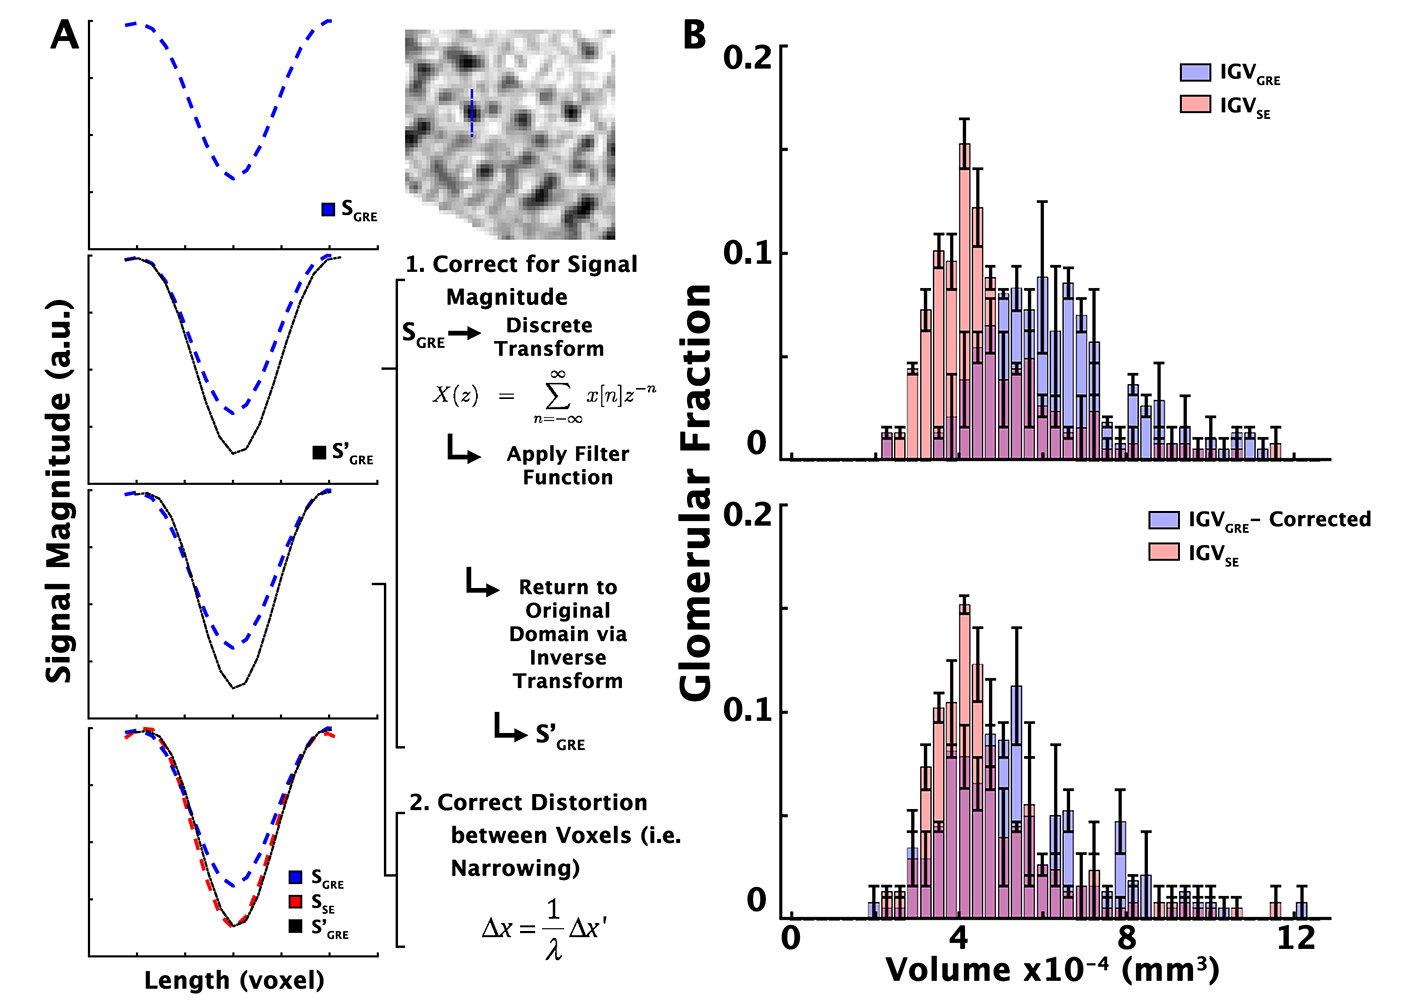
Contrast Enhancement of Glomeruli – A rat received CF (5.75mg/100g) as described in previous publication2 and prepped for high resolution imaging. Imaging – All imaging was performed on a Bruker 7T/30 Clinscan MRI. Excised kidneys were first imaged with a 2D GRE pulse sequence (TE/TR = 20/80; resolution = 58.0 x 58.0 x 200 um3; α = 30°; bandwidth = 80 Hz/pixel). A 2D SE pulse sequence was applied using the same parameters. Image Processing – MIPAR software was used to identify glomeruli in each SE and GRE images. Line profiles of signal magnitude were measured on all glomeruli in orthogonal directions to B0 (Profile width = 17 voxels), FIG 1. Orthogonal profiles were averaged together to obtain a mean profile for each glomerulus. A threshold on the minimum value was applied in each glomerulus profile to isolate glomeruli believed to be located in the 2D image plane (SE-Threshold = 1159; GE-Threshold = 180). Finally, only glomeruli that overlapped in both SE and GRE images were used for analysis. Local inhomogeneities such as CF labeled glomeruli produce a geometric distortion in MR following, $$$x' = x+\frac{\Delta B}{G_{x}}$$$ (ΔB=Magnetic field from inhomogeneity, Gx = Gradient Strength in x-direction). Distortion occurs via geometric distortion (GRE and SE) and reduction in signal magnitude (GRE only). The amount of geometric distortion is calculated using $$$\frac{\Delta x}{\lambda_{x}}=\lambda$$$, where λx is the factor of geometric distortion simulated for CF labeled glomeruli in GRE images. Signal magnitude is reduced by a factor λ, $$$\lambda = \frac{G_{x}}{G_{x}+G'_{x}}$$$, where G’x is the added background gradient arising from the inhomogeneity. Here, we simplify the problem and average G’x over the voxel length, $$$G'_{x} = \frac{\Delta B}{\Delta x}$$$. Fom the modified spin density (ρ’), we calculate the corrected image, ρ(λx’), with the assumptions above using $$$\rho(\lambda x') = \frac{\rho '(x')}{\lambda}$$$. We applied the relation for correcting images to each mean profile measured in GRE images to produce a corrected profile as would be seen in the SE image. Individual glomerulus volume (IGV) was calculated using a spherical model equation and the full width at half-minimum (FWHM) of the profile as the glomerulus diameter.Results
We used a classical model of static susceptibility to correct IGV measurements from GRE images. IGV measurements from SE images (IGVSE) matched literature values that were also validated with stereology2. The factor of geometric distortion for GRE images was found to be λx=~1.1. The reduction in signal magnitude was found to be λ=~ 0.22. We used λ and λx to correct the mean profiles measured from GRE images. A correlation coefficient of 0.9951 was measured between the mean GRE profile and the mean SE profile (FIG 1). IGV distribution was re-calculated using corrected profiles. The number of significantly different bins between IGVSE and IGVGRE changed from >1/5 of all bins for uncorrected GRE profiles to <1/20 of all bins using corrected GRE profiles (FIG 2).Discussion
In this work, we were able to obtain accurate IGV measurements from CFE-MRI. A regression of corrected GRE values compared to values measured in SE images had an R2 value of 0.88. These measurements were made using high-resolution MR images and within healthy glomeruli. Future work will need to account for the use of lower resolutions used in in vivo CFE-MRI to accurately adjust IGV values. Also, further work will be focused in accounting for the non-healthy glomeruli where leakage of macromolecules, such as CF, occur and results in a stretched profile of the glomerulus in MR images as seen previously9. This work will be a useful foundation in any application where negative contrast agents are used to quantify tissue microstructure.Acknowledgements
The authors gratefully thank the molecular imaging core at the University of Virginia and Jack Roy for his great input and help with this project. Many thanks to Jeremy Gatesman, Kimberly A. deRonde, and the UVa veterinary staff for all their help.References
1. Bertram JF, Soosaipillai MC, Ricardo SD et al. Total numbers of glomeruli and individual glomerular cell types in the normal rat kidney. Cell Tissue Res 1992; 270: 37–45.
2. Beeman SC, Zhang M, Gubhaju L et al. Measuring glomerular number and size in perfused kidneys using MRI. Am. J. Physiol. Renal Physiol. 2011; 300: F1454–F1457.
3. Beeman SC, Cullen-McEwen LA, Puelles VG et al. MRI-based glomerular morphology and pathology in whole human kidneys. Am. J. Physiol. Renal Physiol. 2014; 306: F1381–F1390.
4. Baldelomar EJ, Charlton JR, Beeman SC et al. Phenotyping by magnetic resonance imaging nondestructively measures glomerular number and volume distribution in mice with and without nephron reduction. Kidney Int 2016; 89: 498–505.
5. Reichenbach JR, Venkatesan R, Yablonskiy DA et al. Theory and application of static field inhomogeneity effects in gradient-echo imaging. J. Magn. Reson. Imaging 1997; 7: 266–279.
6. Haacke EM, Tkach JA, Parrish TB. Reduction of T2* dephasing in gradient field-echo imaging. Radiology 1989; 170: 457–462.
7. Callaghan PT. Susceptibility-limited resolution in nuclear magnetic resonance microscopy. Journal of Magnetic Resonance (1969) 1990; 87: 304–318.
8. Haacke EM, Brown RW, Thompson MR et al. Magnetic Resonance Imaging: Physical Principles and Sequence Design. Wiley; 1999.
9. Bennett KM, Zhou H, Sumner JP et al. MRI of the basement membrane using charged nanoparticles as contrast agents. Magn. Reson. Med. 2008; 60: 564–574.
Figures