4339
CEST pH Imaging as a Diagnostic for Chronic Kidney Disease in Methylmalonic Acidemia (MMA)1The Russell H. Morgan Department of Radiology and Radiological Science, Division of MR Research, The Johns Hopkins University School of Medicine, Baltimore, MD, United States, 2Medical Genomics and Metabolic Genetics Branch, National Institutes of Health (NIH), Bethesda, MD, United States, 3F.M. Kirby Research Center for Functional Brain Imaging, Kennedy Krieger Institute, Baltimore, MD, United States, 4McKusick-Nathans Institute of Genetic Medicine, Department of Pediatrics, Johns Hopkins University School of Medicine, Baltimore, MD, United States
Synopsis
Chronic Kidney Disease (CKD) is a serious complication of methylmalonic acidemia (MMA), manifests with proximal tubular dysfunction, tubulointerstitial nephritis, and eventually decreased glomerular filtration. Routine diagnostic tests, like serum creatinine, leave much to be desired. In this study, we designed an alternative MRI strategy to measure renal perfusion and create pH maps after administering iopamidol, a pH sensitive contrast agent. We detected robust differences in perfusion fraction and pH maps between severe, mild and no renal disease in MMA mouse model. These results demonstrate that MRI may facilitate early detection of kidney disease.
Target Audience
MR researchers, radiologists, pediatricians, geneticists and nephrologists interested in renal imagingPurpose
Develop a novel CEST pH imaging protocol for detecting and monitoring chronic kidney diseaseIntroduction
Methyl Malonic Acidemia (MMA) is a severe organic acidemia with an established mouse model, C57BL/6 Mut-/-;TgINS-Alb-Mut mice1. Majority of these patients develop chronic kidney disease (CKD) by their second decade of life, requiring renal transplantation. Glomerular Filtration Rate (GFR) is the standard index for renal function2, however direct measurements of iohexol or iothalamate clearance (iGFR) are invasive and cumbersome. Estimated GFR (eGFR) uses serum creatinine and/or cystatin-C3-5 and is routinely employed by clinicians. Impaired growth/activity and protein restriction affect muscle mass and creatinine levels, making eGFR a poor prognostic marker for MMA, delaying diagnosis and management6. In this study, a special CEST MRI protocol is designed and the CEST MRI pH probe, iopamidol, is administered to produce perfusion and pH maps of the kidneys and tested on MMA mice.Methods
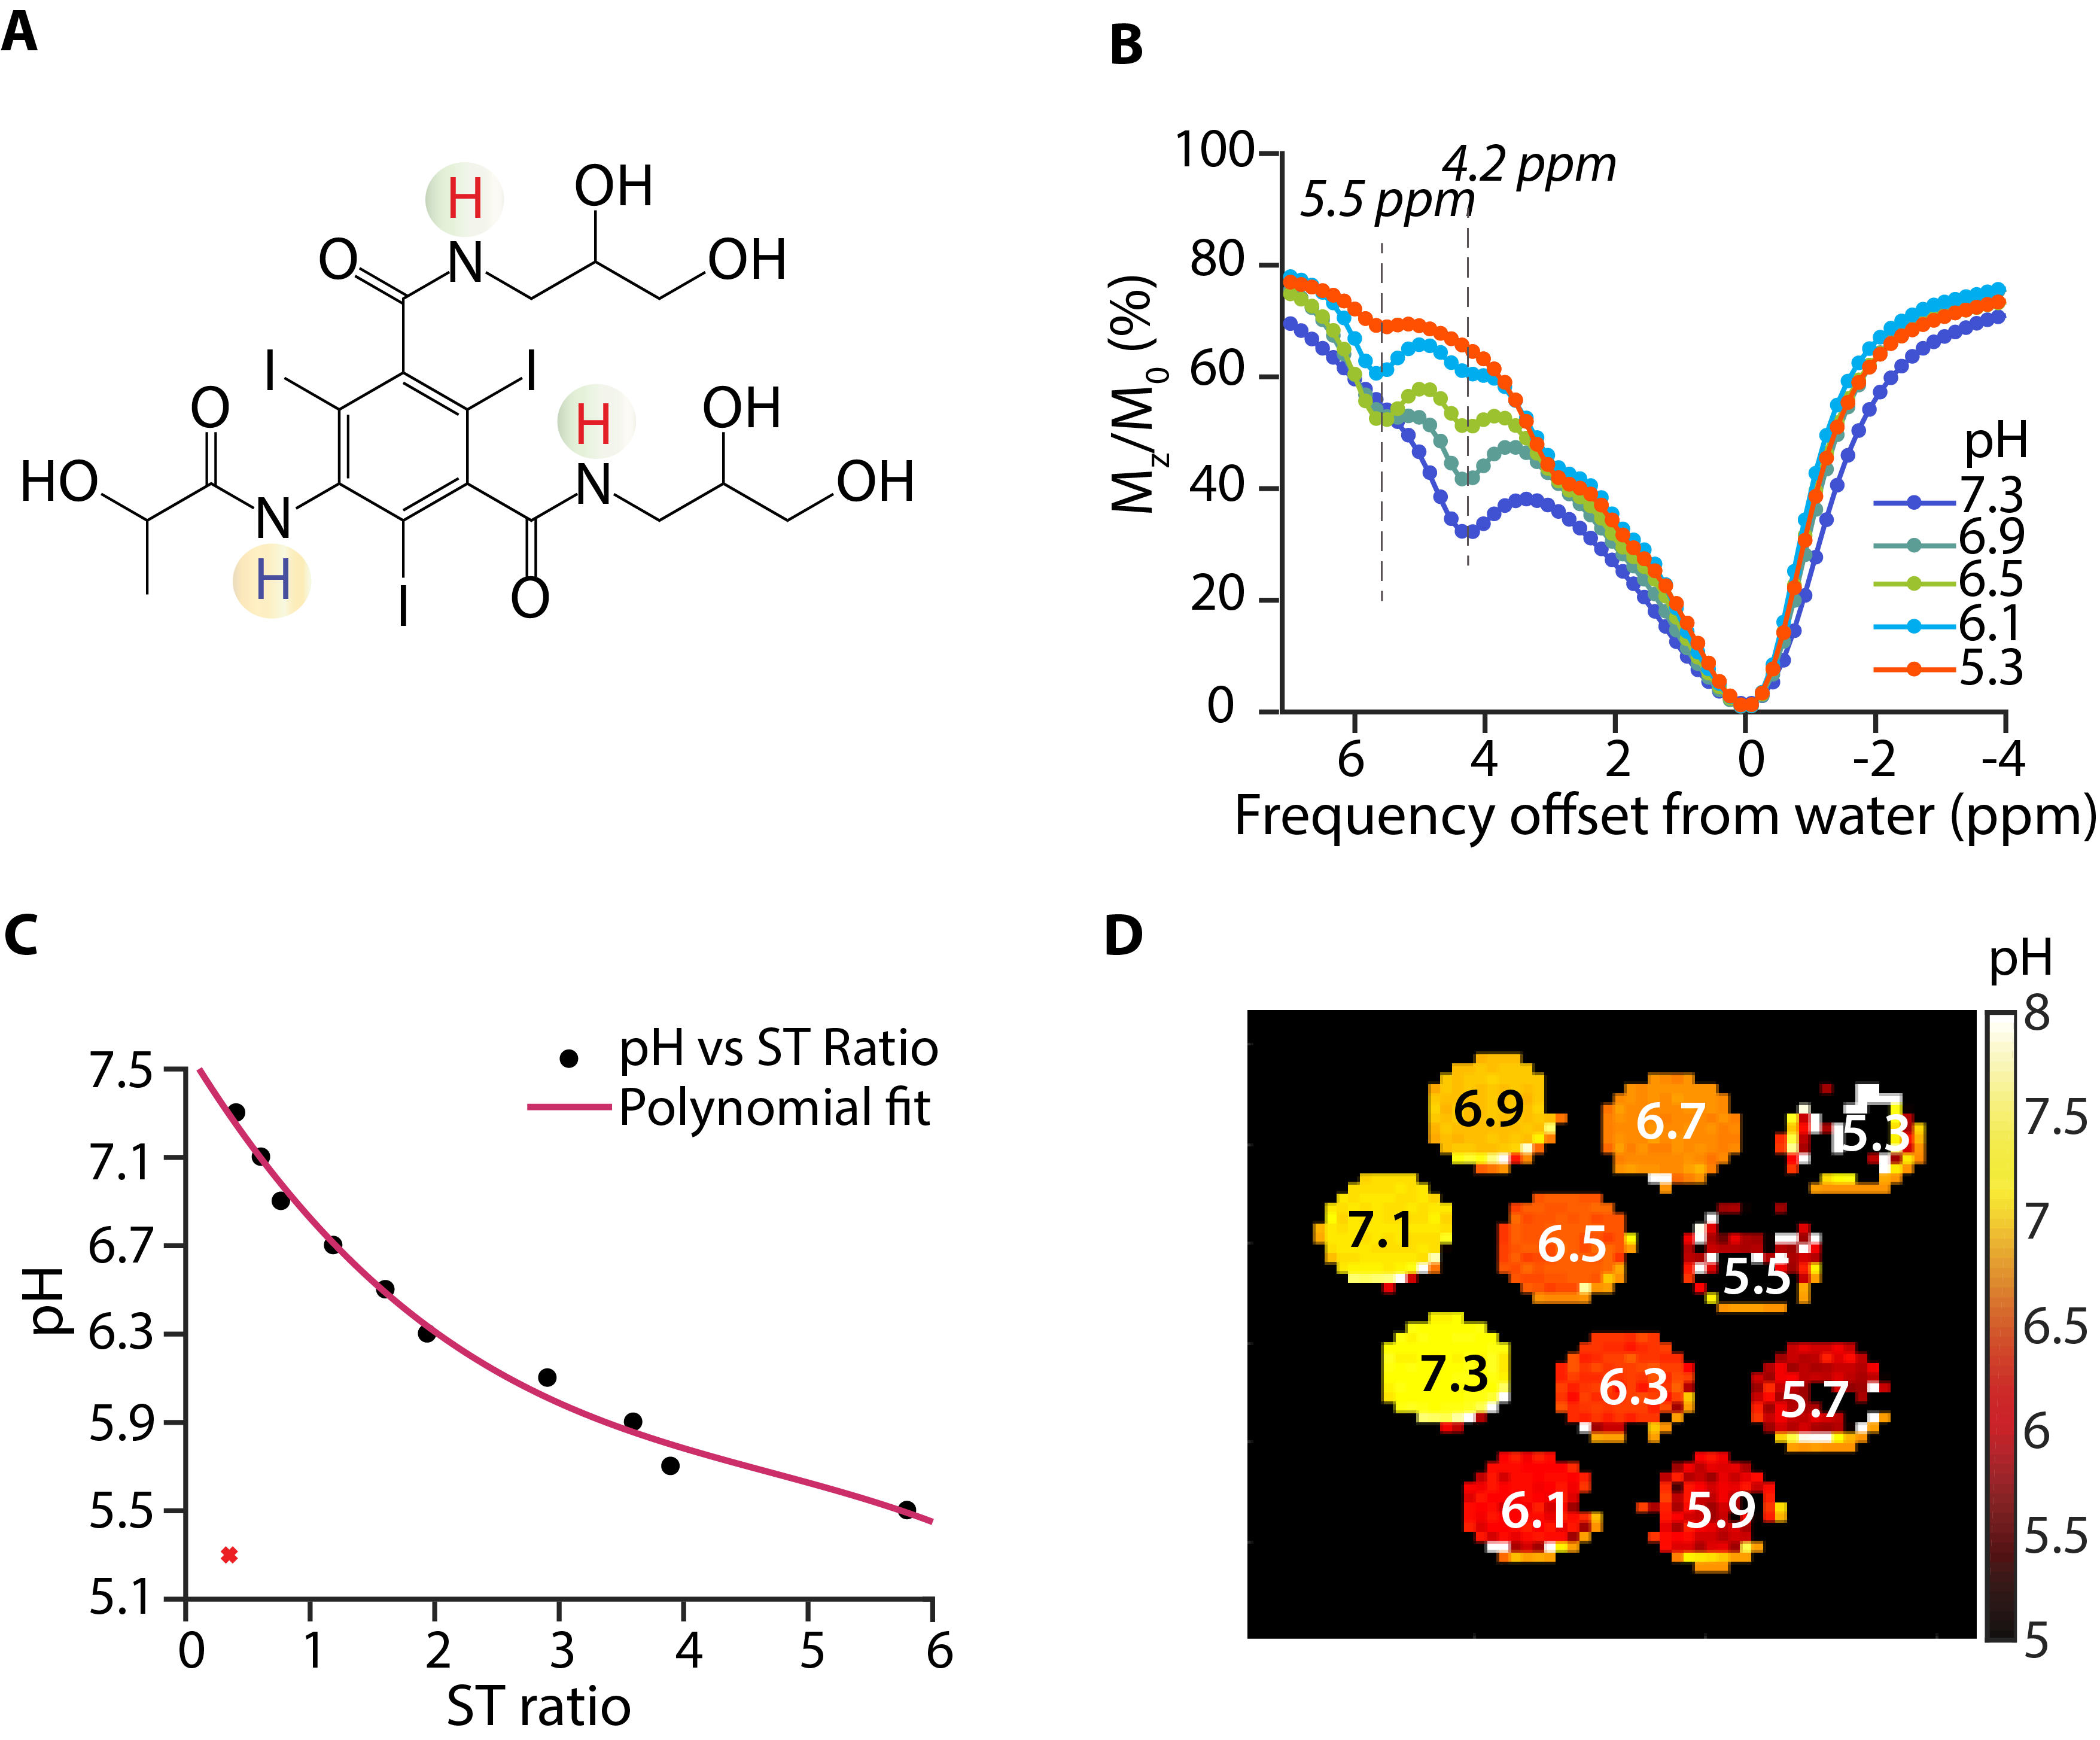
In vitro experiments: A phantom was prepared by titrating 40 mM Iopamidol in human Seronorm to pH values between 5.3-7.3. MRI was performed on a Bruker 11.7T scanner. CEST images were acquired using B1=4μT, Tsat=3sec and RARE for readout. 70 saturation images between ±7 ppm were acquired with 0.2 ppm increment and 1 M0 image. Other parameters: acquisition matrix size=64x48, slice thickness=1mm, and TR/TE=5000/3.39ms.
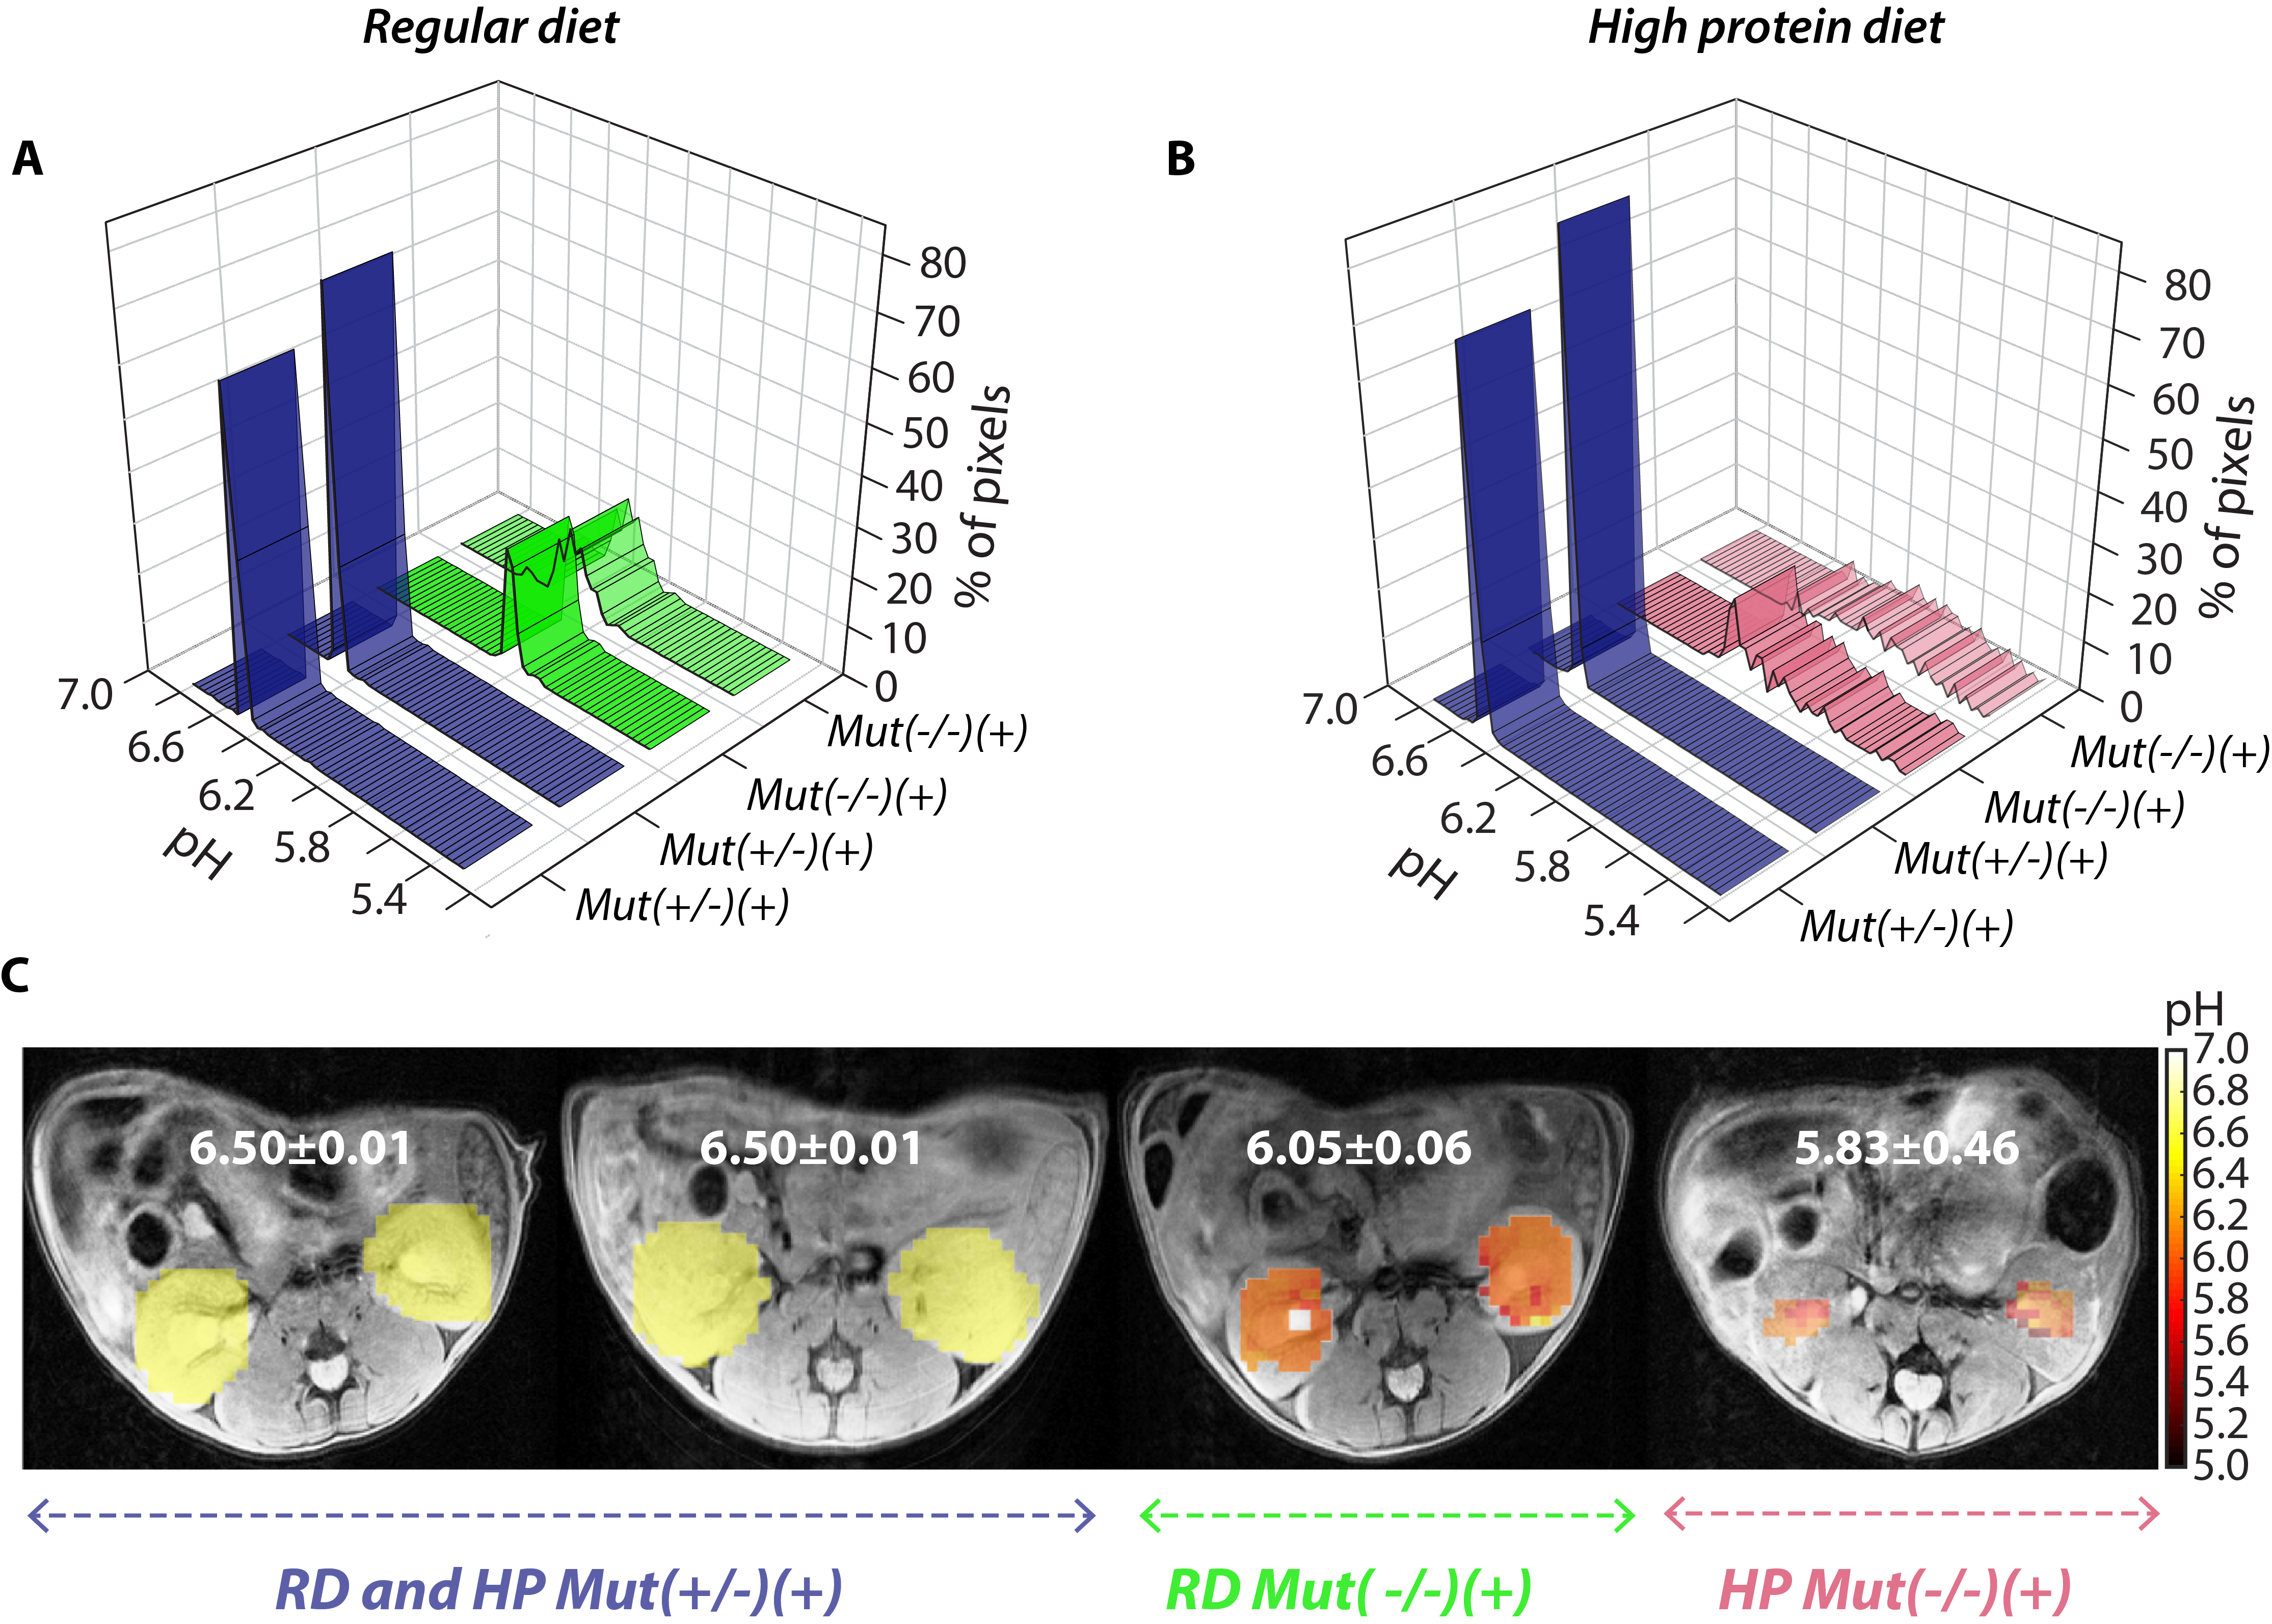
Methylmalonic acidemia mouse model of CKD: Male transgenic mice expressing methylmalonyl-CoA-mutase (Mut) in the liver under the control of an albumin promoter on a knockout background (Mut-/-;TgINS-Alb-Mut, designated as Mut(-/-)(+),(n=7) or littermate controls Mut(+/-)(+),(n=4) were used. The mice were further subdivided by placing half on a regular diet (RD) and the remainder on a high protein diet (HP). HP mice lost weight (P<0.0001) and had elevated plasma MMA (1,330mmol/L, P=0.017 compared to controls), associated with increased lipocalin-2 (Lcn2) mRNA expression in their kidneys (P=0.002), similar to previous findings in this model.
In vivo experiments: An axial slice was chosen for CEST imaging and T2W image obtained for anatomical overlay. The RARE sequence was used, B1 = 4μT and Tsat = 3sec. A 71 offset protocol was tested with 71 offsets between ±7 ppm (increment= 0.2 ppm) for 1-2 hours after iopamidol injection (1.5g iodine/kg through tail vein). In addition, a 2 offset CEST protocol was evaluated with offsets = 4.2 and 5.5 ppm for 1-2 hours with the other parameters the same as 71 offsets.
MRI data processing: The pre-injection z-spectra were subtracted from all post-injection images. 10-20 images were averaged using a moving average filter to generate the corresponding parameter maps (contrast, FF, pH). The pixel-by-pixel ST = (1-Mz/M0) was calculated to generate ST maps using 4.2, 5.5 ppm7. FF was calculated by determining the percentage of kidney pixels with contrast > 20% of the maximum. The pH was calculated using the in vitro generated calibration curve.
Results and Discussion
The Z-spectra of iopamidol in Fig. 1B display two well resolved resonances7, 8. An ROI was drawn and the mean ST ratio=Mz4.2×(M0-Mz5.5)/Mz5.5×(M0-Mz4.2) vs pH was obtained and fit to a polynomial to generate pH calibration curve (Fig. 1C). Fig 1D shows the pH maps indicating that while pH values between 7.3 and 5.7 can be readily measured, pH values of 5.5 and below are challenging. Fig. 2 shows the In vivo FF results. Both RD and HP control mice (both n=4) display FF~99% (Fig. 2 A,B,D). In contrast, moderately affected mice (n=3) display a reduction (FF~79%) while those with severe renal disease (n=3) display a further reduction in FF (FF<50%). Fig.3 shows the pH maps. The pH distribution ranges of Mut(-/-)(+) mice with mild disease were ±0.06 and ±0.09 pH units, whereas this range further increased to ±0.30 and ±0.46 in the MMA mice with severe renal disease who also had a decreased mean pH. The data indicate that FF was more sensitive than pH, and the range in pH values was more sensitive than average pH.Conclusion
FF and pH are promising biomarkers for detecting progression of renal disease in MMA, and likely other disorders, that alter renal pH and perfusion.Acknowledgements
This project is funded by MD Stem Cell Research Fund # MSCRFI-2829.References
1. Manoli, I. et al. Targeting proximal tubule mitochondrial dysfunction attenuates the renal disease of methylmalonic acidemia. Proceedings of the National Academy of Sciences 110, 13552 (2013).
2. Stevens, L.A. & Levey, A.S. Measured GFR as a confirmatory test for estimated GFR. J Am Soc Nephrol 20, 2305-2313 (2009).
3. Miller, W.G. Reporting estimated GFR: a laboratory perspective. Am J Kidney Dis 52, 645-648 (2008).
4. Filler, G. & Lepage, N. Should the Schwartz formula for estimation of GFR be replaced by cystatin C formula? Pediatr Nephrol 18, 981-985 (2003).
5. Bouvet, Y. et al. GFR is better estimated by considering both serum cystatin C and creatinine levels. Pediatr Nephrol 21, 1299-1306 (2006).
6. Itoh, K. Comparison of methods for determination of glomerular filtration rate: Tc-99m-DTPA renography, predicted creatinine clearance method and plasma sample method. Ann Nucl Med 17, 561-565 (2003).
7. Longo, D.L., Busato, A., Lanzardo, S., Antico, F. & Aime, S. Imaging the pH evolution of an acute kidney injury model by means of iopamidol, a MRI-CEST pH-responsive contrast agent. Magn Reson Med 70, 859-864 (2013).
8. Longo, D.L. et al. Iopamidol as a responsive MRI-chemical exchange saturation transfer contrast agent for pH mapping of kidneys: In vivo studies in mice at 7 T. Magn Reson Med 65, 202-211 (2011).
Figures