4337
GAN based continuous pseudo-CT computation for PET/MR attenuation correction and MR-guided radiation therapy planning1GE Global Research, Bangalore, India, 2UCSF, San Fransisco, CA, United States, 3GE Healthcare, Munich, Germany
Synopsis
Generation of pseudo CTs from MR images is of interest for applications such as PET/MR attenuation-correction (AC) and MR-guided radiation therapy planning (MRgRTP). In this work, demonstrate a DL method that harnesses the style transfer capability of GAN to compute qualitatively and quantitatively accurate continuous density bone pCT images from Dixon based LAVA-Flex MRI sequence which has a short acquisition time. The method is evaluated for PET/MR attenuation correction.
Introduction:
Generation of pseudo CTs (pCT [HU]) from MR images is of interest for applications such as PET/MR attenuation-correction (AC) and MR-guided radiation therapy planning (MRgRTP). In previous methods, pCT was computed from: (a). Dixon MR images providing only soft-tissue map (fastest for clinical usage) [1]; (b). multi-channel MRI data: T1-MR+Atlas providing soft tissue and bone MRAC map [2]. Recent methods have demonstrated deep learning (DL) based continuous bone value pCT generation using ZTE alone which incurs a longer scan time penalty [3] or by combining ZTE with Dixon MRI [4]. Thus, a methodology to generate pCT with accurate bone depiction using Dixon MRI is desirable in clinical practice. In this work, we harnesses style transfer capability of GAN to generate continuous density bone pCT from Dixon MRI (LAVA-Flex). GANs implicitly model distributions. This offers a flexibility over CNNs by allowing computation of pCT in presence of registration mismatch between MRI and reference CT. This is especially relevant in pelvis region where registration is hard to achieve due to body flexion. The method is evaluated for PET/MR attenuation correction and compared with [4].Methods and Materials:
Patient data:MR scans were performed using a 3T, time-of-flight (TOF) Signa PET/MR scanner (GE Healthcare, Chicago, IL, USA). For PET/MR, 25 patients were scanned using a fast LAVA-Flex protocol for pelvis region: 1.95x1.95x2.6mm resolution, 18s scan time, pelvis surface coil, FA=5°, FOV=600mm. PET and CT images were acquired with the same protocol as described in [4]. All patient studies were approved by respective Institutional Review Boards, including signed informed consent.
MRI Pre-processing:Intensity correction was performed on In-phase images using ITK N4 algorithm and normalized to the volume z-score value.
CT to MRI registration: CT images were registered to ZTE using a combination of rigid and diffeomorphic dense registration algorithms developed in ITK [5, 6].
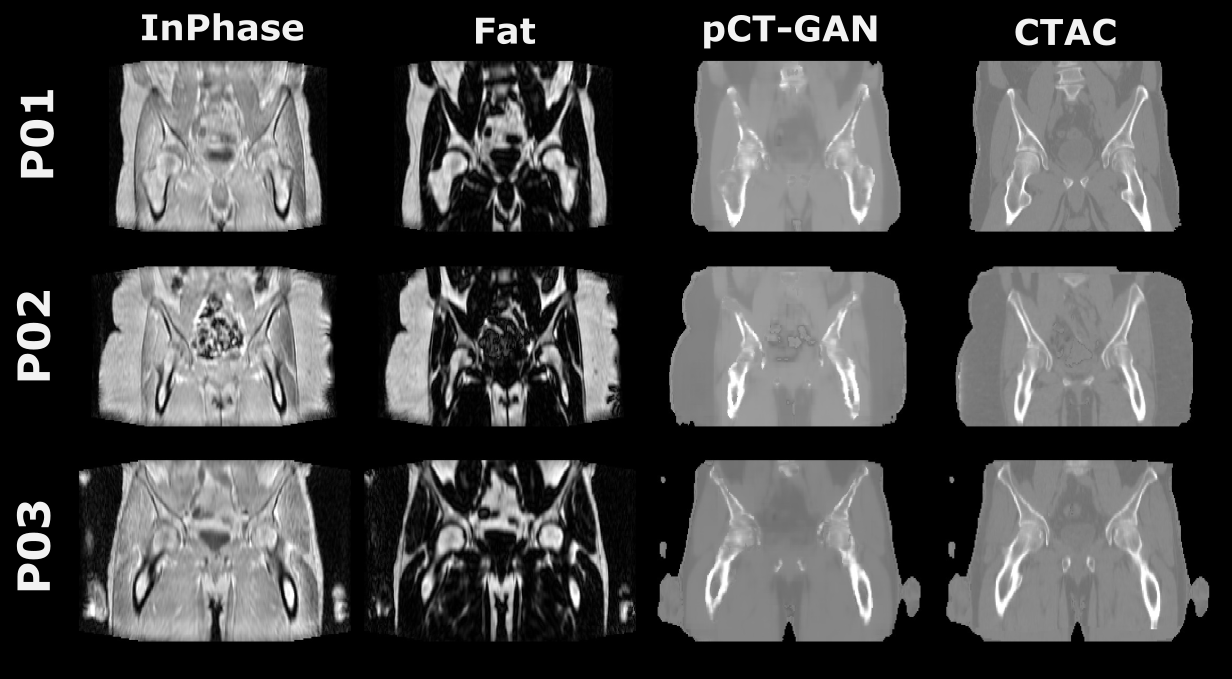
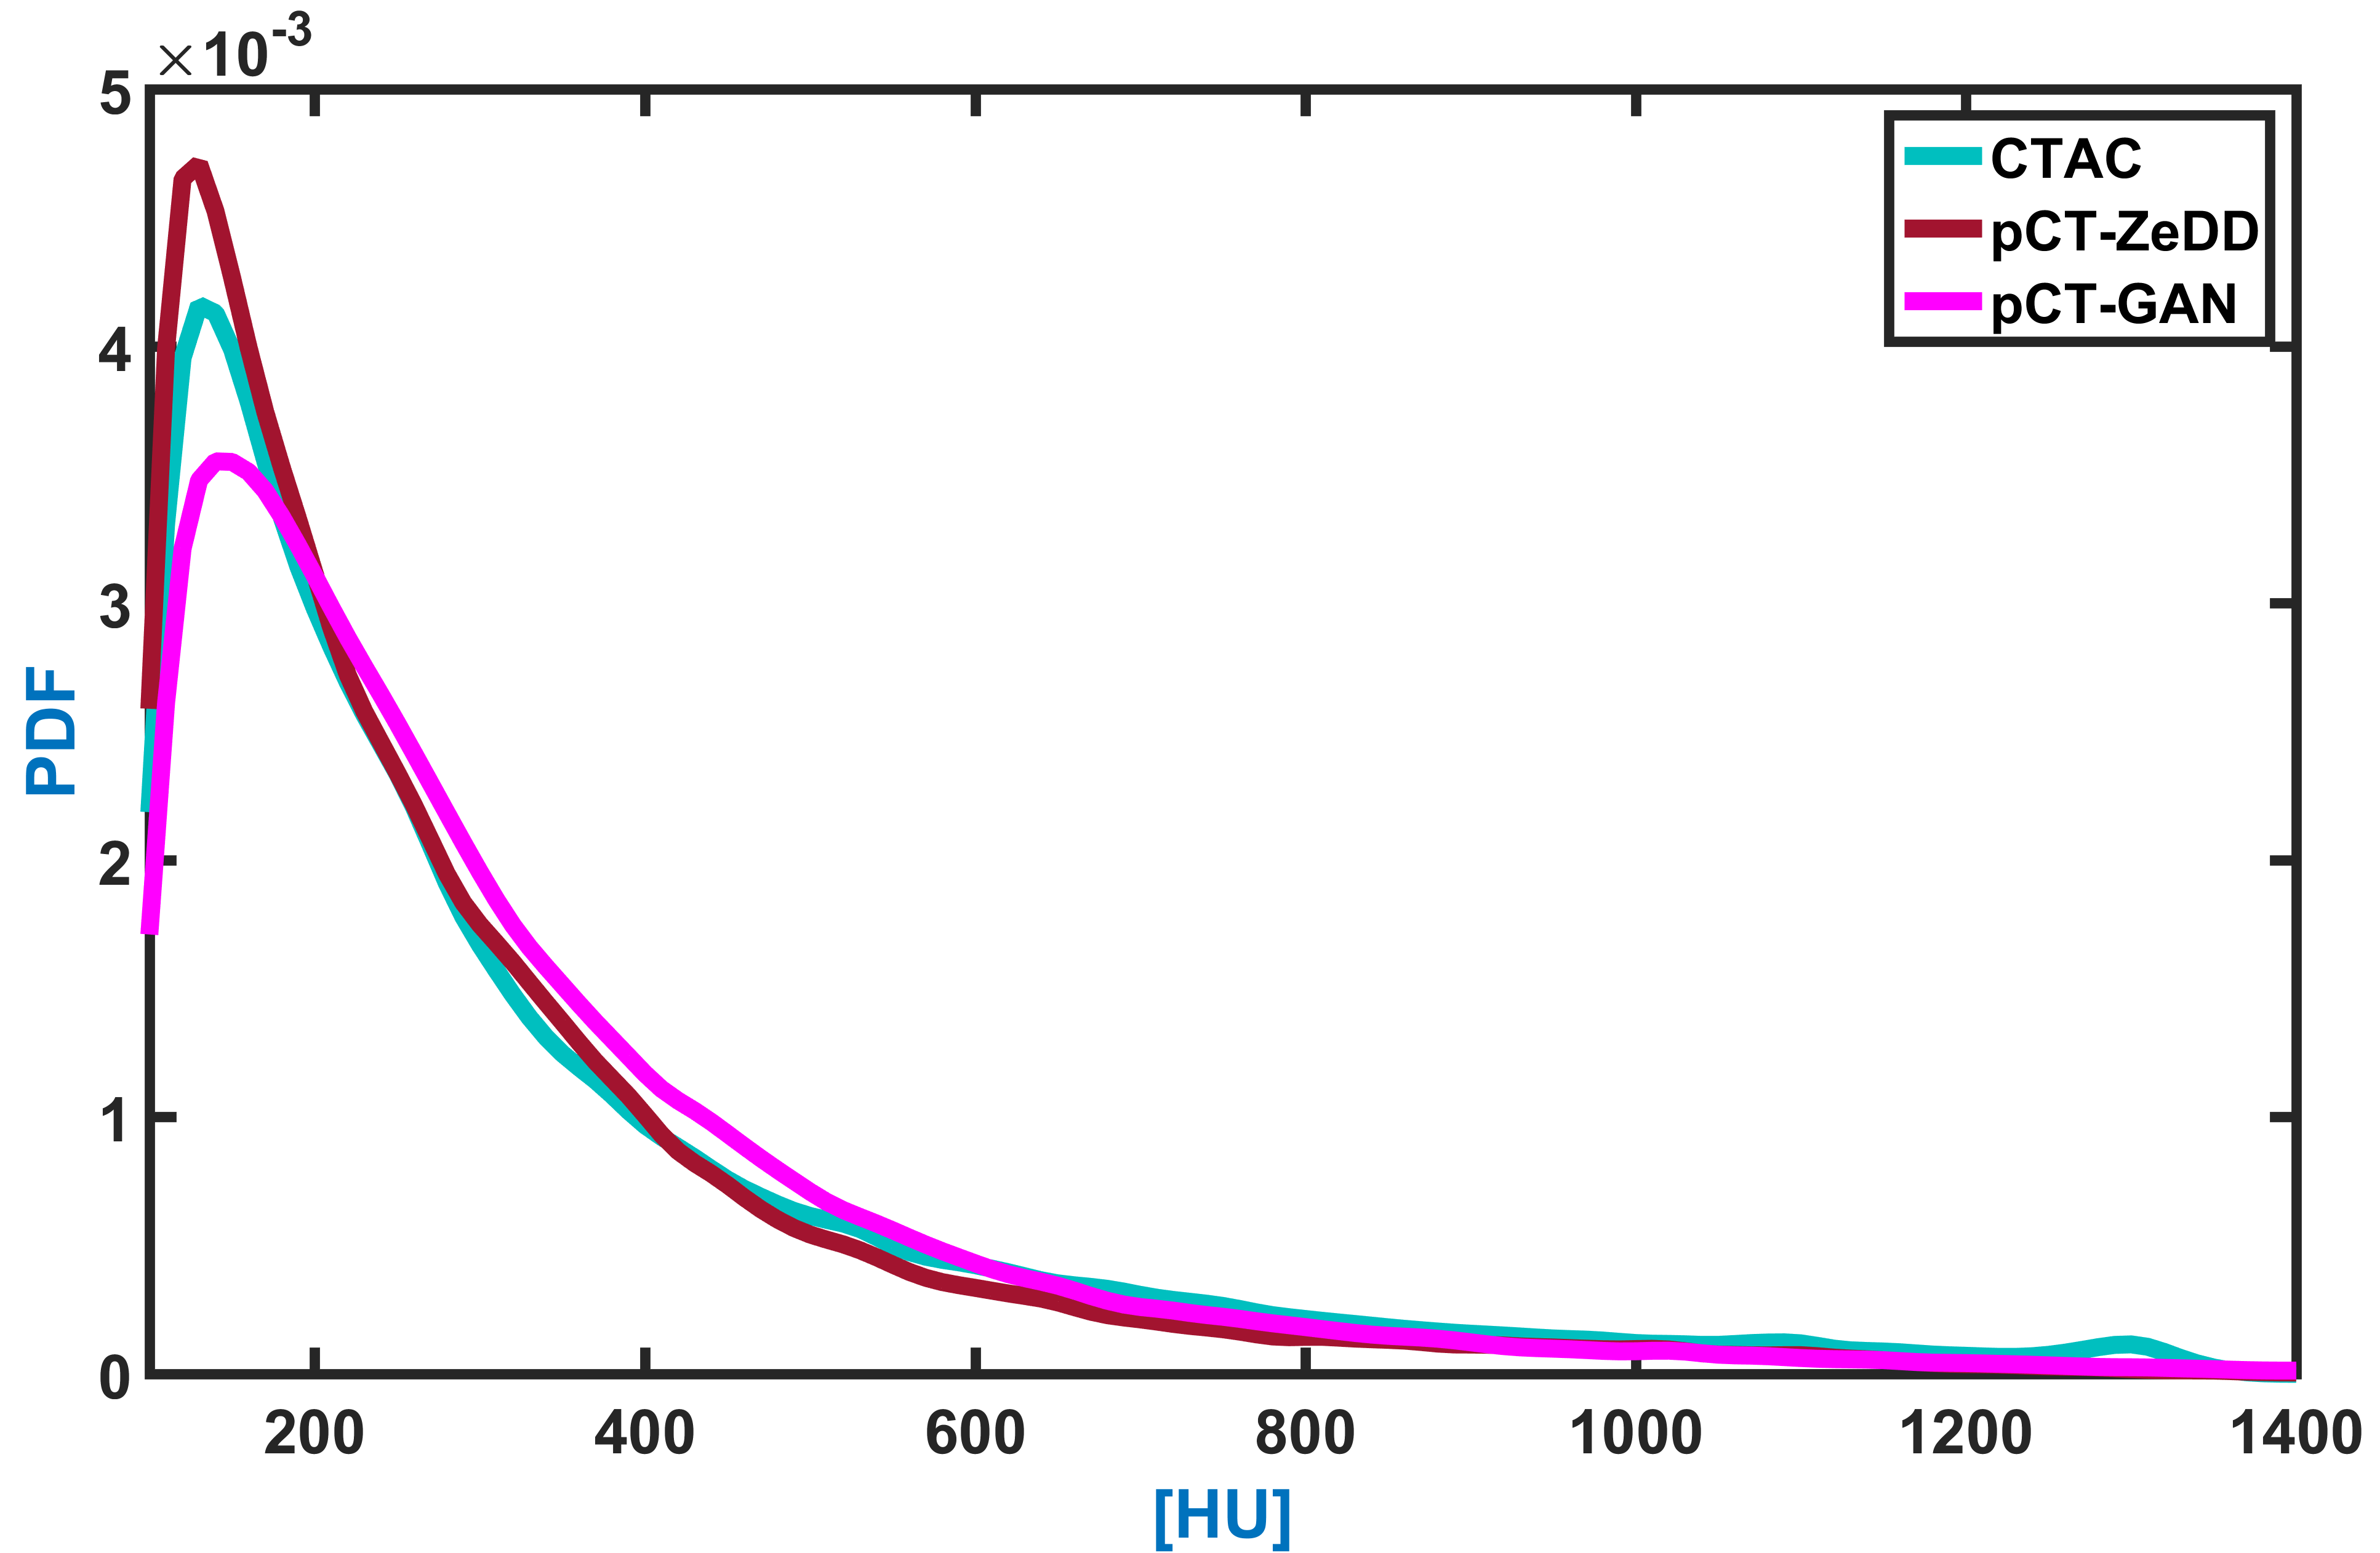
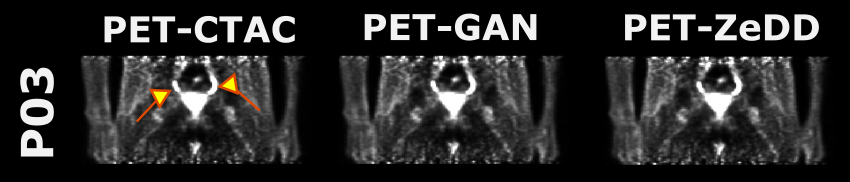
Deep learning based pCT computation:A 2D generative adversarial neural network of the CycleGAN [7] image translation architecture was adapted to compute pCT from InPhase and Fat channels of LAVA-Flex MRI. Cyclic generator-discriminator networks working on a combination of mean absolute error (MAE) and cyclic loss functions were trained by Adam optimizer. The generator has 5 convolution layers (with ReLU activation), a merge layer and LeakyReLU activation at the last layer. The discriminator has 4 convolution layers (ReLU activations) and a sigmoid activation on the last layer. The GAN architecture is trained for 200 epochs. To increase robustness of the framework, output pCT was generated in a Bayesian method from multiple points of convergence of the model. The entire framework was implemented using Keras and Tensorflow libraries [8, 9] in Python. Training was performed on 2400 slices from a total of 20 patients. For testing, 5 cases (600 slices) separate from training set were used. Predicted slices were reconstituted back to form the whole pCT volume. pCT Evaluation: pCT-GAN was evaluated visually and by comparing histogram overlap in the bone regions (HU > 100) against reference CTAC and pCT-ZeDD[4]. MRAC map computation: Since the focus is on continuous density bone map prediction, pCT regions with HU>100 were extracted and pasted into the soft tissue MRAC map [1] and the resulting hybrid bone-MRAC map was used for PET reconstruction. PET-AC Evaluation: PET image reconstruction was performed offline using the petrecon toolbox v1.26 (GE Healthcare, Chicago, IL, USA) and standard parameter settings (2 iterations, 28 subsets, point spread function kernel, 3.0mm full-width at half-maximum (FWHM) in-plane Gaussian filter followed by axial filtering with a three slice 1:4:1 kernel). Lesion uptake values (SUV) in PET images serve as comparison metric for quality of reconstruction.
Result & Discussion:
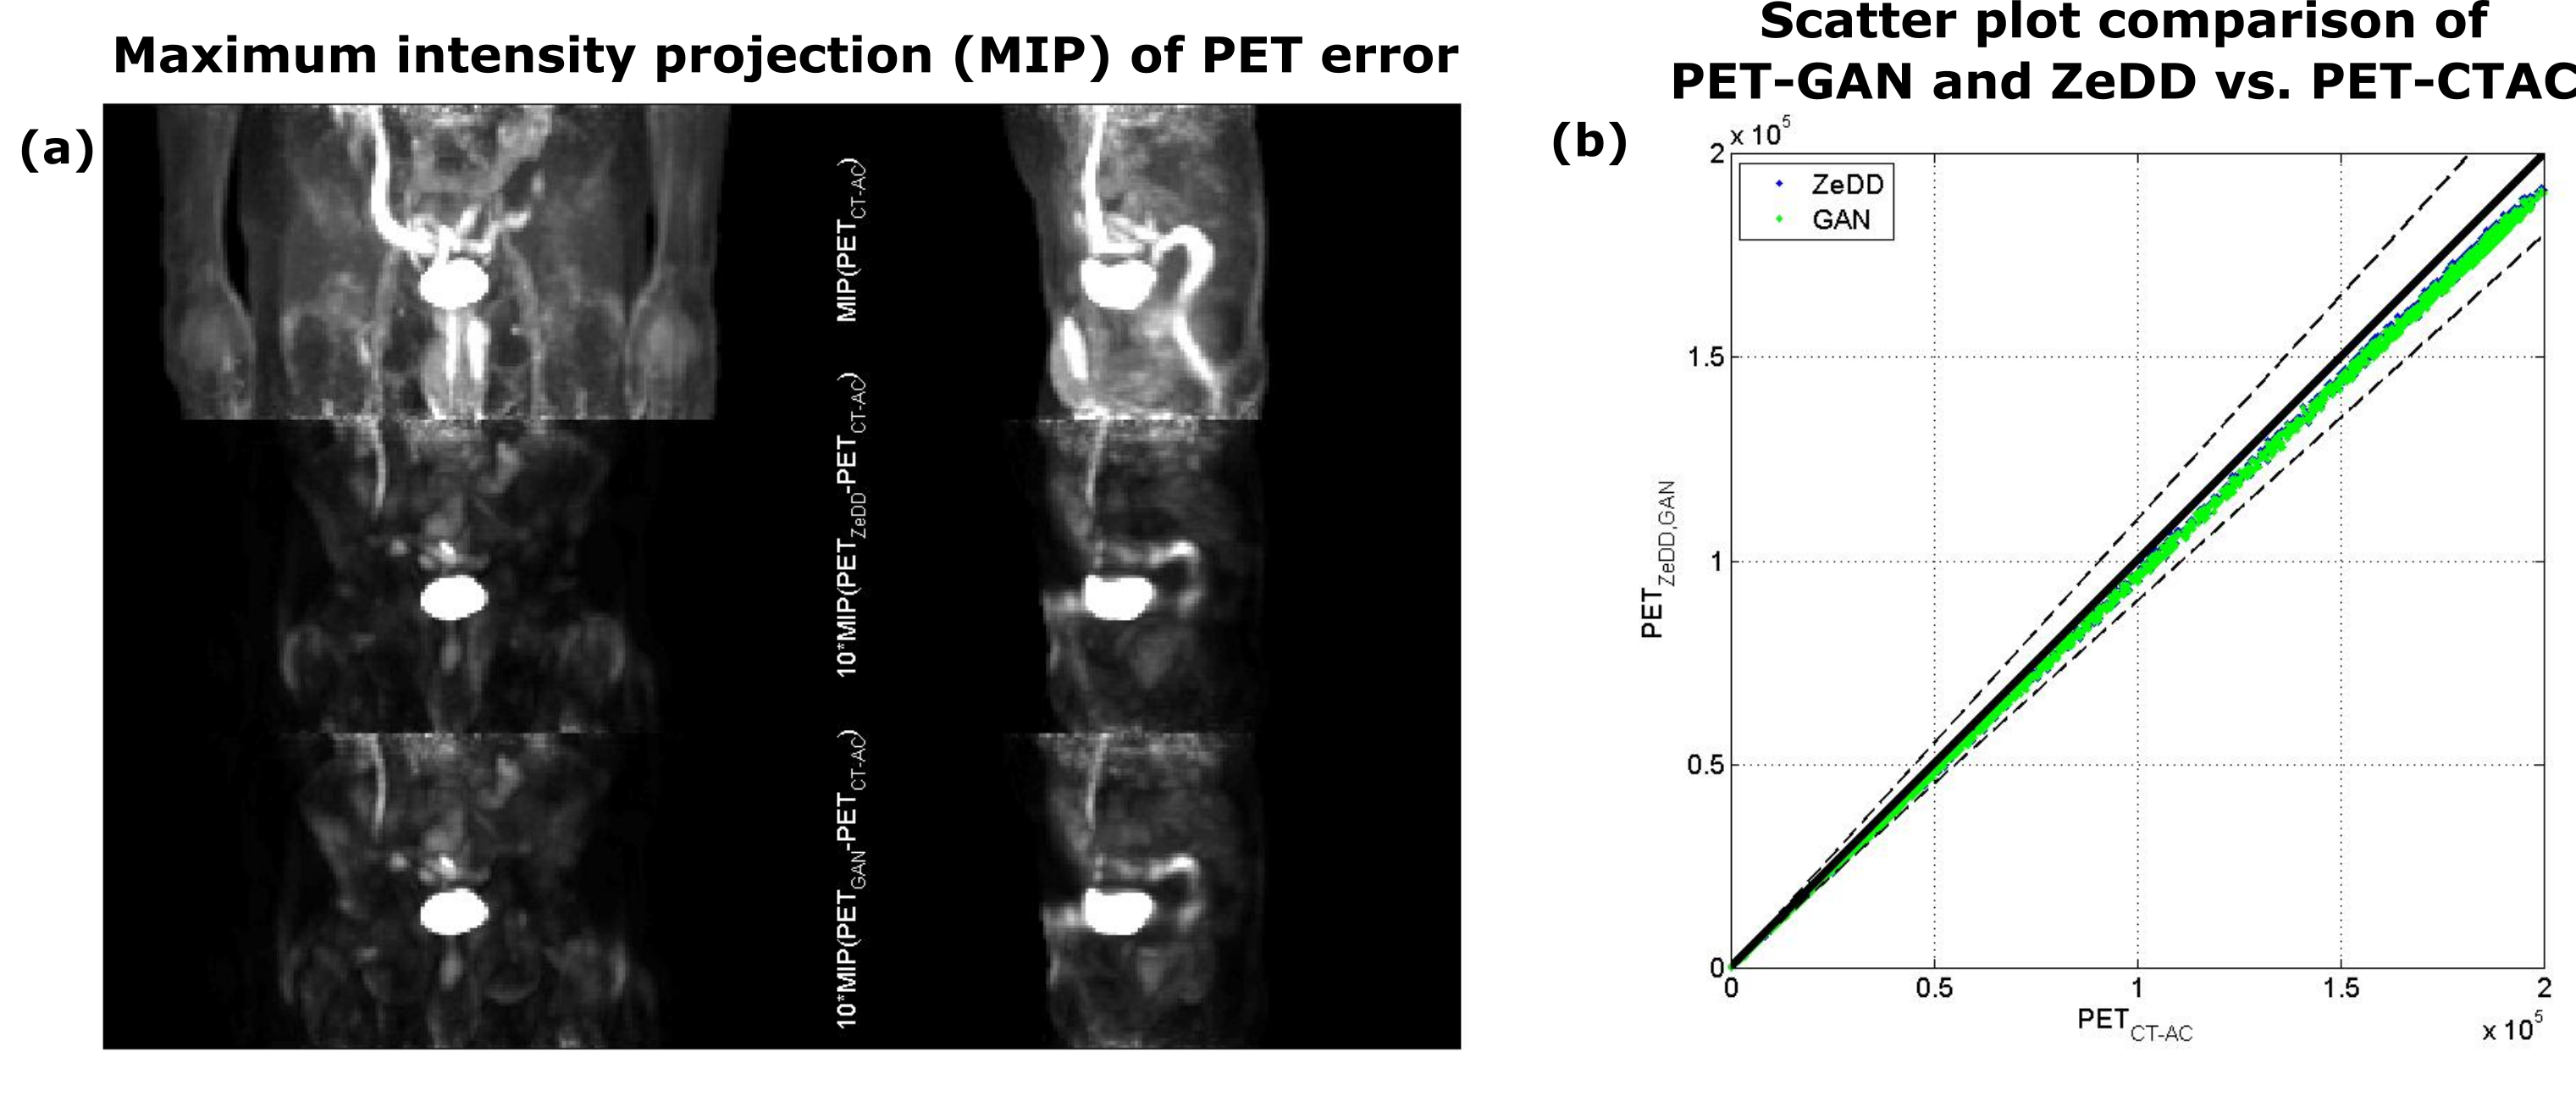
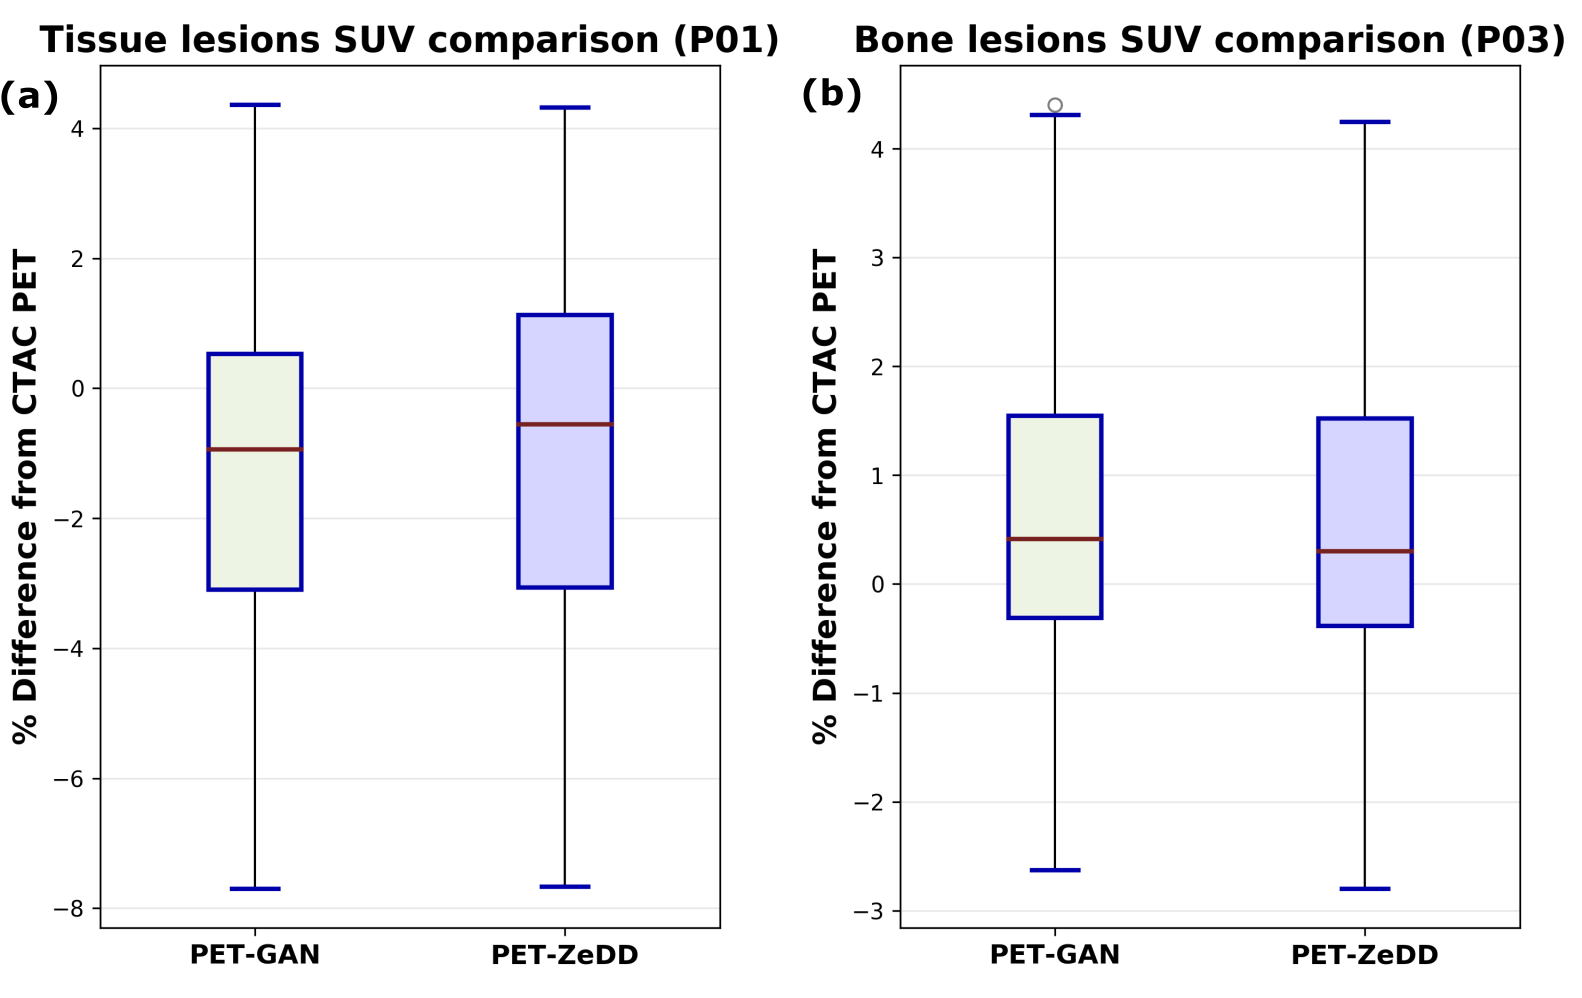
pCT-GAN shows good bone depiction similar to CTAC (Fig.1). A good overlap of histogram between CTAC and pCT indicates consistent estimation of CT values across bone densities (Fig.2). Fig.3 demonstrates that the conspicuity of lesion (highlighted) is maintained in PET image reconstructed from pCT-GAN. The MIP map in Fig.4 shows minor errors in the bone region and the scatter points in the graph are contained within the ±5%. Fig.5 shows SUV percentage error in lesions is similar for both pCT-AC methods. This suggests that pCT-GAN can be used in clinical practice for faster workflow.Conclusion:
We have presented a generic pseudo-CT generation using the CycleGAN framework using InPhase and Fat channels from Dixon MRI. Advantages include pCT from a fast imaging sequence, very close to real CT in appearance, as well as excellent quantitative accuracy of estimated bone values in pCT and reconstructed PET images.Acknowledgements
No acknowledgement found.References
- SD Wollenweber et al., IEEE Transactions on Nuclear Science, 2013
- Mehranian A, et al, Med. Phys. 2016
- Kaushik et al, ISMRM 2018
- Leynes et al, J Nucl Med 2017
- B.B Avants, et al, Penn Image Computing and Science Laboratory, 2009
- H. Patel, et al, 36th Ger. Conf. Pattern Recognit. 2014
- J-Y Zhu, et al, ICCV 2017
- Chollet, F., et al, https://github.com/fchollet/keras
- Abadi, M., et al, arXiv:1603.04467v2
Figures