4336
Performance analysis and optimization of MR-based attenuation correction in hybrid PET/MR1High Field and Hybrid MR Imaging, University Hospital Essen, Essen, Germany, 2Erwin L. Hahn Institute for MRI, University of Duisburg-Essen, Essen, Germany, 3TU Dortmund, Dortmund, Germany
Synopsis
The recent approach of MR-based attenuation correction in hybrid PET/MR, using a Dixon-VIBE based 4-component µ-map along with an atlas-based bone model, was analysed regarding its accuracy and potentials to reduce deviations from the ground truth. Various CT-based µ-maps were synthesized and the influence of each component on the standardized uptake values was determined for 16 patients. Furthermore, the generated µ-maps were quantitatively compared to the original PET/MR-based µ-maps. It was demonstrated that an adjustment of the lung values and introduction of a second tissue compartment increases the accuracy of the calculated standardized uptake values, particularly for heart and abdomen.
Introduction
In hybrid PET/MR, the recent approach of MR-based attenuation correction (AC) of the human body uses a Dixon-VIBE based 4-component µ-map, to which an atlas-based bone model is added 1-3. However, since this approach still lacks the richness of attenuation information in comparison to e.g. PET/CT, where the linear attenuation coefficients (LAC, µ-map) are calculated directly from the CT data 4, it is worthwhile to investigate its accuracy and explore options to further reduce deviations from the ground truth.
Methods
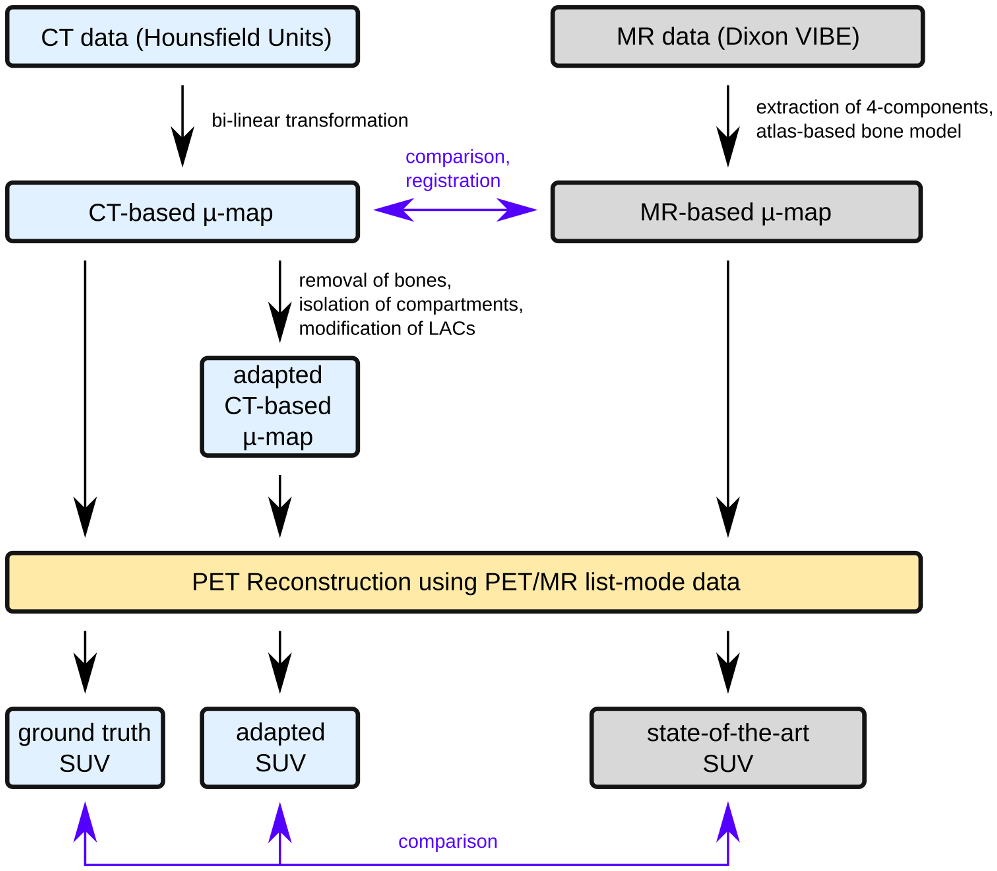
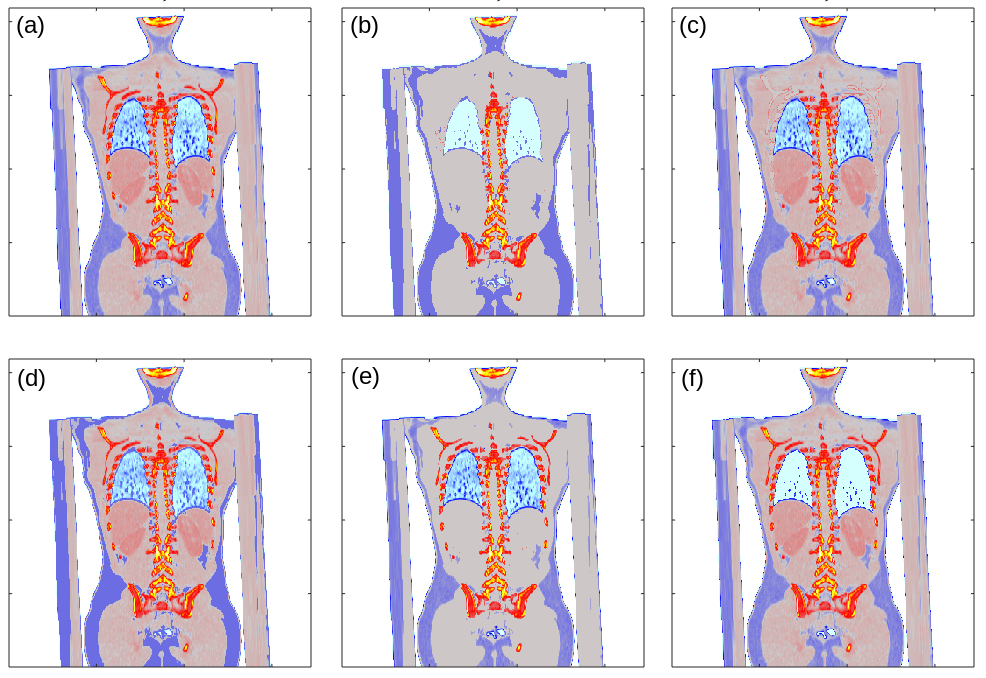
The patient cohort for this study comprised 16 subjects (mean age 47.1 ± 16.0 yrs., 8 female, 8 male) with various pathologies. Each of them underwent a routine whole-body hybrid imaging protocol on a PET/CT scanner (Biograph mCT 128, Siemens Healthcare GmbH, Erlangen, Germany) and a subsequent PET/MR scan (Biograph mMR, Siemens) with one single injection of the radiotracer 18F-FDG prior to the PET/CT scan. A continuous µ-map was calculated from the CT data and provided the ground truth for the generation of several modified versions (Fig. 1). Thus, the bone part was reduced to match the features of the atlas-based skeleton (e.g. removed ribs). Tissue, lung and fat fractions were isolated and set to their corresponding constant value as used in current PET/MR µ-maps (µlung = 0.0224 cm-1, µfat = 0.084 cm-1, µtissue = 0.1 cm-1). Thus, a total of six different adapted µ-maps (three continuous maps with one constant individual component, a pseudo-MR µ-map derived from CT containing a reduced bone model and only the four constant components, the original continuous CT-based with full and reduced bone model) were included into the PET reconstructions for all patients (Fig. 2). All models were non-rigidly registered to the MR data before their reconstruction with the PET data from the respective PET/MR exams and the vendor-provided e7-tools (Siemens Molecular Imaging, Knoxville, USA).
To quantify the individual influence of the modifications on the observed standard uptake values (SUV), difference maps were evaluated with respect to their ground truth as obtained by the fully continuous CT-based µ-map. Moreover, the 5-component MR µ-map of each patient was compared to its segmented CT-based counterpart with respect to the individual fraction and mean LACs of each component to estimate accuracy and potential enhancement strategies.
Results
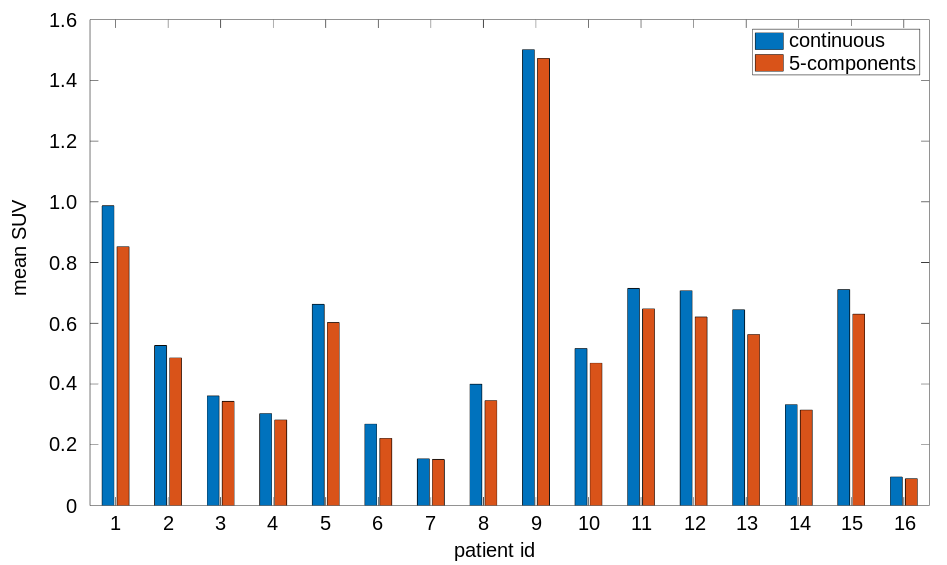
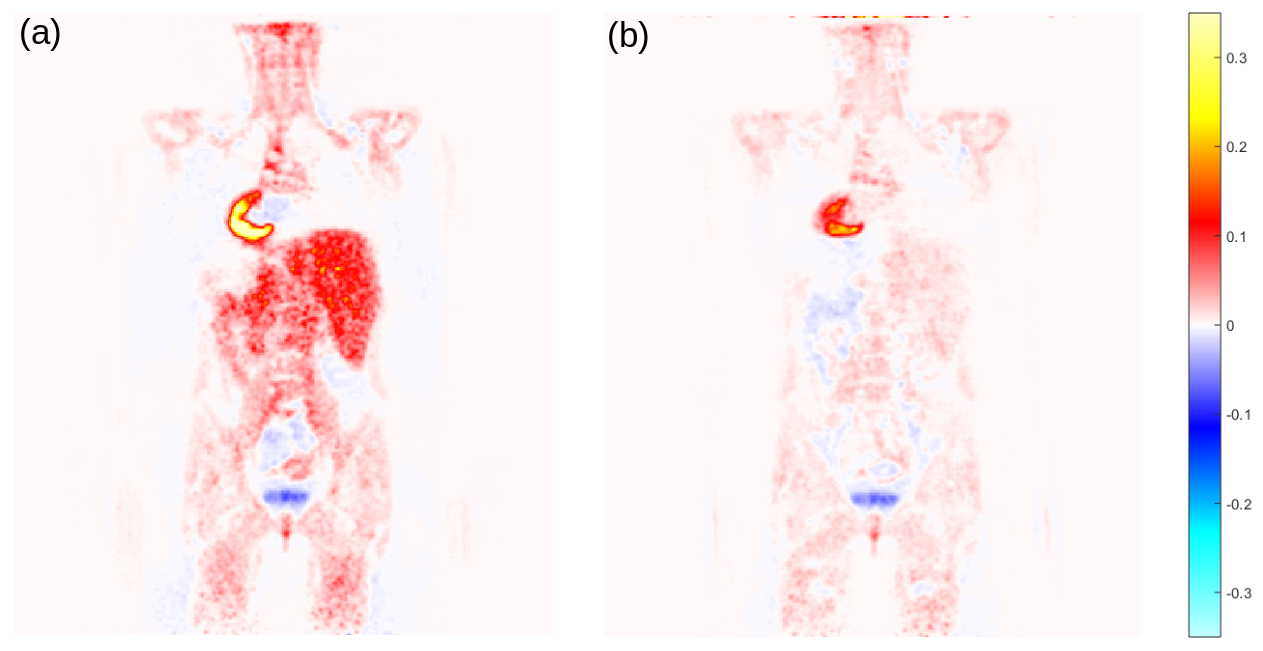
The reduction of continuous CT-based µ-maps to PET/MR-like 5-component models yielded a good global agreement of the reconstructed SUVmean (mean difference: 4.3 ± 2.7%). A systematic local underestimation of the liver (8.8 ± 3.4%) and heart (9.0 ± 2.5%) was observed (Fig. 3). Moreover, it was found that setting the lung LAC to constant values leads to an underestimation of 6.2 ± 1.0% of the heart. An equalization of the tissue LAC leads to an underestimation of the heart (3.2 ± 1.7%) and liver (7.1 ± 2.6%), respectively, whereas there is only minor impact of a constant fat LAC on these particular regions. In addition, omitting parts of the bones only caused minor deviations in the resulting SUVs (< 2% in total, < 2.5% in the heart).
In the direct comparison of the segmented CT- and MR-based µ-map, it was found that the MR LACs tend to be lower than their corresponding CT-based mean values (7.0 ± 2.0%). In particular, the lung and bone segments, show major deviations (25.4% ± 19.7% and 29.2 ± 4.5%).
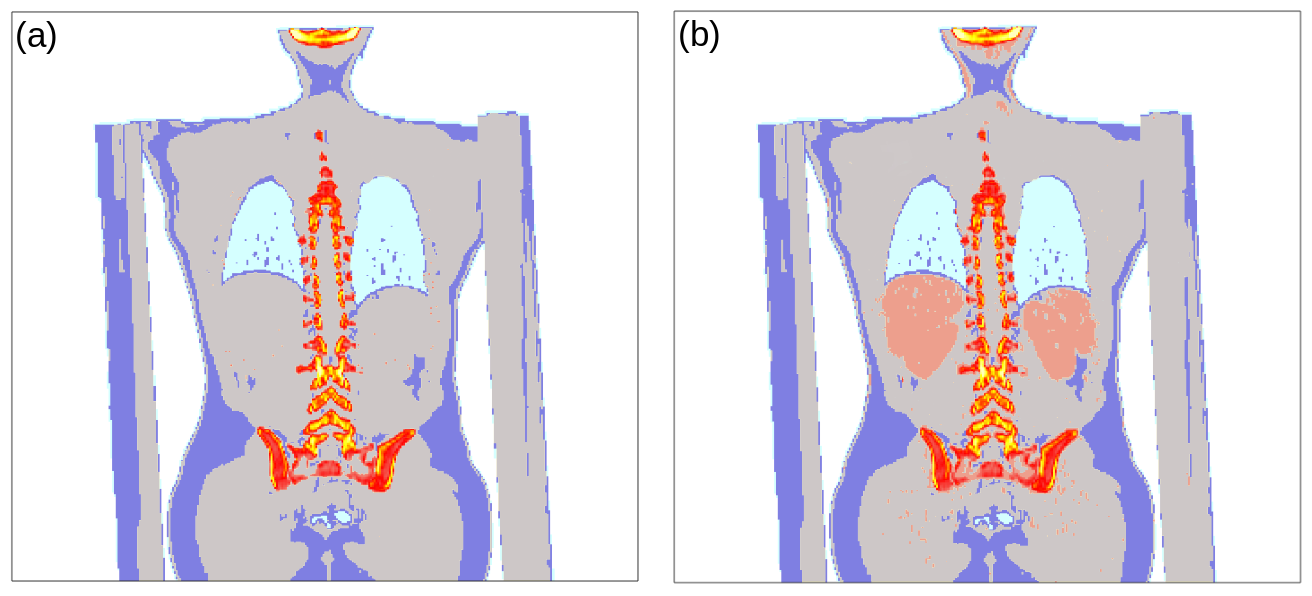
An increase of the lung LAC from 0.0224 to 0.0227 cm-1 led to a reduction of the underestimation of the heart (3.7 ± 1.5%). Moreover, a comparably large spread of LACs within the tissue compartment was observed that could be attributed to differences between organs and muscle tissue, suggesting the introduction of two classes with separated LACs, i.e. 0.11 cm-1 (kidneys and liver) and 0.1 cm-1 (rest). Reconstructions with the resulting µ-map (continuous, with two tissue LACs) led to a major reduction of the underestimation of the liver (1.0 ± 2.0%), while minimizing the overall deviation to the continuous CT-based ground truth to under 1% (Figs. 4 and 5).
Discussion and Conclusion
An adequate accuracy of the current state-of-the-art method for the MR-based attenuation correction using 5-compartment models was confirmed. Local organ-specific deviations were observed that resulted from deviations in the underlying absolute LACs. It was shown that an increase of the lung LAC and splitting of the tissue compartment into two classes may increase the accuracy of the obtained SUV maps. While the first modification may be implemented rather straightforwardly into common approaches, it remains subject to further studies to introduce a method that identifies and separates the two suggested tissue regions in the MR-based images.
Acknowledgements
No acknowledgement found.References
1. Martinez-Möller A, Souvatzoglou M, Delso G, et al. J Nucl Med. 2009;50:520–526.
2. Hofmann M, Steinke F, Scheel V, et al. J Nucl Med. 2008;49:1875–1883.
3. Paulus DH, Quick HH, et al. J Nucl Med. 2015;56:1061-6.
4. Kinahan PE, Townsend DW, Beyer TT, Sashin D. Med Phys. 1998;25:2046–2053.
Figures