4332
A Carotid Artery Image-Derived Input Function for Pre-Clinical Simultaneous PET/MRI1Medical Biophysics, Western University, London, ON, Canada, 2Lawson Imaging, Lawson Health Research Institute, London, ON, Canada
Synopsis
Using the carotid arteries for the extraction of an image-derived input function for kinetic modelling in rats.
Introduction
A dynamic positron emission tomography (PET) acquisition enables quantitative kinetic modelling. Often, an arterial input function (AIF) needs to be measured to perform kinetic modelling1. Blood sampling in small animals is difficult due to the limited amount of blood that can be drawn without compromising its health, necessitating an image-derived AIF. The left ventricle is a convenient region of interest to extract the input function due to the size of the blood pool in this area2-6.
There are an increasing number of pre-clinical PET scanners available that are compatible with simultaneous use inside an MRI scanner (e.g., Cubresa NuPETTM). With simultaneous PET/MRI, both anatomical and metabolic information can be measured at the same time. Often, these inserts have axial field of views (FOVs) that are not large enough to include both the head and heart of a large rodent in a single bed position. Thus, dynamic PET imaging of the head cannot be done if one wants to use the left ventricle to extract an input function. Our objective is to develop a method for the extraction of an image-derived input function from the carotid arteries (cIDIF) of rats. This will enable dynamic PET imaging to be done on dedicated PET systems and PET inserts for simultaneous PET/MRI which have short axial FOVs not large enough to include both head and heart.
Methods
Recovery Coefficient Curve Generation:
A phantom was designed to model rodent vessels and was 3D printed (FormLabs Form 2). The phantom consisted of rod sizes ranging from 0.5 mm to 5 mm in diameter which were then uniformly filled with 18F -Fluorodeoxyglucose ([18F]-FDG) and scanned using a dedicated PET system with a 120 mm axial FOV (Siemens Inveon). MR images of the filled phantom were subsequently taken using a Siemens 3T MR scanner. A recovery coefficient curve was created using these images according to the NEMA NU 4-2008 standards.
Image Acquisition:
Dynamic PET data was acquired in 4 rats for 60-90 minutes (Siemens Inveon). Injection of [18F]-FDG (~60 MBq) occurred 30 seconds after the start of the scan. Dynamic data was reconstructed using a 3D ordered subset expectation maximization (OSEM3D) reconstruction algorithm. 3T MRI (Siemens Biograph mMR) were acquired with a head coil developed for small animal imaging (Cubresa). An isotropic T1-weighted volumetric interpolated brain examination (VIBE) sequence was used with an isotropic resolution of 0.3 mm3.
Image-Derived Input Function Extraction:
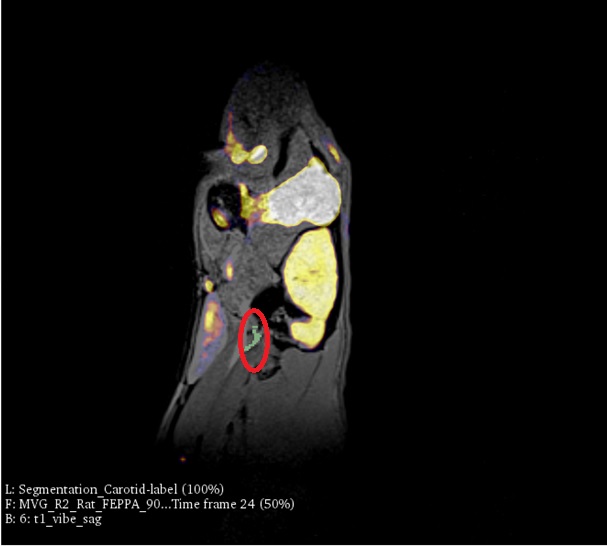
3D Slicer was used for manual co-registration of the PET and MR images followed by segmentation and extraction of the input functions. The cIDIF was extracted by using the MR images to create the segmentation, which includes both carotid arteries. To get the input function from the left ventricle of the heart, the last frame of the PET image was used to create the segmentation. These same segmentations were then used to measure the average diameter of each area. The appropriate recovery coefficient based on these size measurements were used to correct each input function.
Results
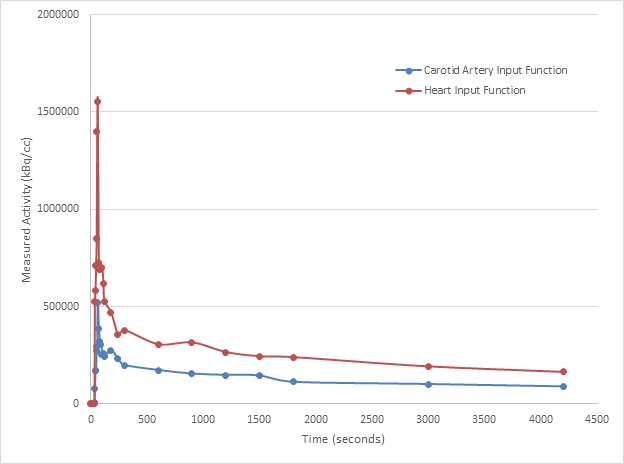
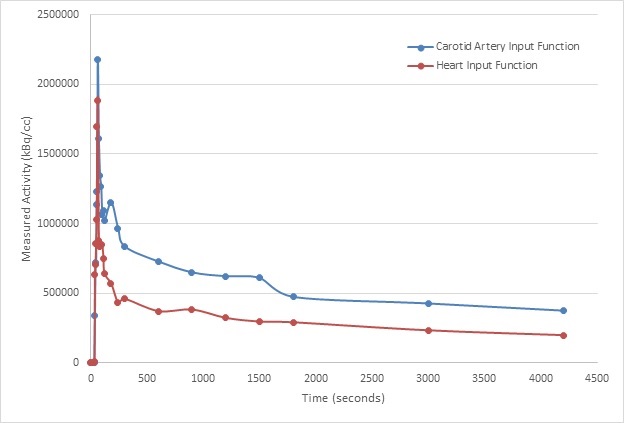
The co-registered data allowed for easy segmentation of the carotids in the rat images (Figure 1). Because of this, input functions from both the heart and the carotid arteries were successfully extracted (Figure 2). The input functions from both the heart and the carotid artery correlated well qualitatively following correction of the time activity curves by the corresponding recovery coefficients (see Figure 3).Discussion
After scaling by the recovery coefficients, the input functions from both locations are similar to each other as seen in Figure 3. This suggests that the use of the carotid arteries to extract an input function is a valid method. In the future, we hope to refine our extraction and correction methods to further enhance the similarity between the input functions and finally validate the method of using cIDIF for kinetic modelling. Finally, we plan on creating maps of the metabolic rate of glucose in the brain from the input functions generated at each location to compare the effectiveness of the method.Conclusion
The carotid arteries may become a useful site to extract an IDIF for PET systems possessing short axial FOVs. This will allow the users of small animal dedicated PET scanners as well as PET inserts for simultaneous PET/MRI to perform quantitative kinetic modeling in the brain using an image-derived AIF with their systems.Acknowledgements
We would like to acknowledge Lynn Keenliside for help in the creation of the phantom and Nassir Al-Khishman for help with 3D Slicer.References
1. Morris, E. D., Endres, C. J., Schmidt, K. C., Christian, B. T., Muzic, R. F., & Fisher, R.E. (2004). Kinetic Modeling in Positron Emission Tomography. In Emission Tomography: The Fundamentals of PET and SPECT (pp. 499–540).
2. Lanz, B., Poitry-Yamate, C., & Gruetter, R. (2014). Image-Derived Input Function from the Vena Cava for 18F-FDG PET Studies in Rats and Mice. Journal of Nuclear Medicine, 55(8), 1380–1388.
3. Thackeray, J. T., Bankstahl, J. P., & Bengel, F. M. (2015). Impact of Image-Derived Input Function and Fit Time Intervals on Patlak Quantification of Myocardial Glucose Uptake in Mice. Journal of Nuclear Medicine, 56(10), 1615–1621.
4. Xiong, G., Paul, C., Todica, A., Hacker, M., Bartenstein, P., & Boening, G. (2012). Noninvasive image derived heart input function for CMRglc measurements in small animal slow infusion FDG PET studies. Physics in Medicine and Biology, 57(23), 8041–8059.
5. Fang, Y.-H. D., & Muzic, R. F. (2008). Spillover and partial-volume correction for image-derived input functions for small-animal F-18-FDG PET studies. Journal of Nuclear Medicine, 49(4), 606–614.
6. Alf, M. F., Wyss, M. T., Buck, A., Weber, B., Schibli, R., & Krämer, S. D. (2013). Quantification of brain glucose metabolism by 18F-FDG PET with real-time arterial and image-derived input function in mice. Journal of Nuclear Medicine: Official Publication, Society of Nuclear Medicine, 54(1), 132–138.
Figures