4331
Spatio-Temporal Association Between Simultaneously BOLD and FDG Resting State Networks1Monash Biomedical Imaging, Monash University, Clayton, Australia, 2Department of Electrical and Computer System Engineering, Monash University, Clayton, Australia, 3Monash Institute for Cognitive and Clinical Neuroscience, Monash University, Clayton, Australia, 4Australian Research Council Centre of Excellence for Integrative Brain Function, Melbourne, Australia
Synopsis
The slow-infusion-based dynamic FDG-PET have demonstrated excellent sensitivity to glucose uptake in the brain. Using fPET which contains unprecedented temporal information, we introduce a cross-modality spatiotemporal regression method to measure the association of resting net works (RSNs) between simultaneously acquired fMRI and fPET datasets. By projecting both temporal and spatial information in RSNs from two modalities into the proposed cross-modality association index, several associated networks have been identified by the proposed method.
Introduction
Functional MRI (fMRI) can reveal the spontaneous connectivity of blood-oxygen-level dependent (BOLD) signals in the cortex of a resting brain1. We can identify these resting state networks (RSNs) by using independent component analysis (ICA) of these signals2,3. Recently, the emergence of the slow-infusion-based dynamic FDG-PET (fPET) have demonstrated excellent sensitivityto near-instantaneous fluctuations in glucose uptake in the brain4,5. Prior to the introduction of fPET, substantial works have been done to investigate the association between BOLD networks and FDG networks over conventional static PET acquisition6,7. However, the spatial overlap between RSNs of the two modalities cannot provide a comprehensive relationship between BOLD and the dynamic glucose metabolism. Using fPET with unprecedented temporal information, we introduce a cross-modality spatiotemporal regression method to measure the association of RSNs between simultaneously acquired fMRI and fPET datasets.Methods
Data Acquisition
Eight healthy subjects underwent simultaneous BOLD-fMRI/FDG-PET on a 3T Siemens Biograph mMR. Each subject was infused with 240±9MBq of 18-F FDG at a constant rate (36mL/hr) over 95 minutes. During the PET scan, several MRI acquisitions were performed (UTE, T1 MPRAGE, T2-SPC, pASL, and SWI), followed by six consecutive 10-min T2* EPI acquisitions (TR=2450ms, TE=30ms, FA=90º, matrix size=64x64x44, resolution=3x3x3mm3). PET list-mode data was binned into 185 frames (20 seconds each) aligned to the six EPI sessions, which were attenuation corrected and reconstructed using the OSEM method (3 iterations, 21 subsets).
Resting State Networks Estimation
fPET intensities were normalized at each time point to remove the frame-wise whole-brain mean glucose accumulation. Normalised frames were motion correction and spatially smoothed (Gaussian, FWHM=15mm). The pre-processing pipeline of fMRI data included B0 unwarping, motion correction, high-pass filtering (0.01Hz) and spatial smoothing (Gaussian, FWHM=5mm). Both fMRI and fPET data were registered to MNI-152 space.
Cross-modality Spatiotemporal Association Index
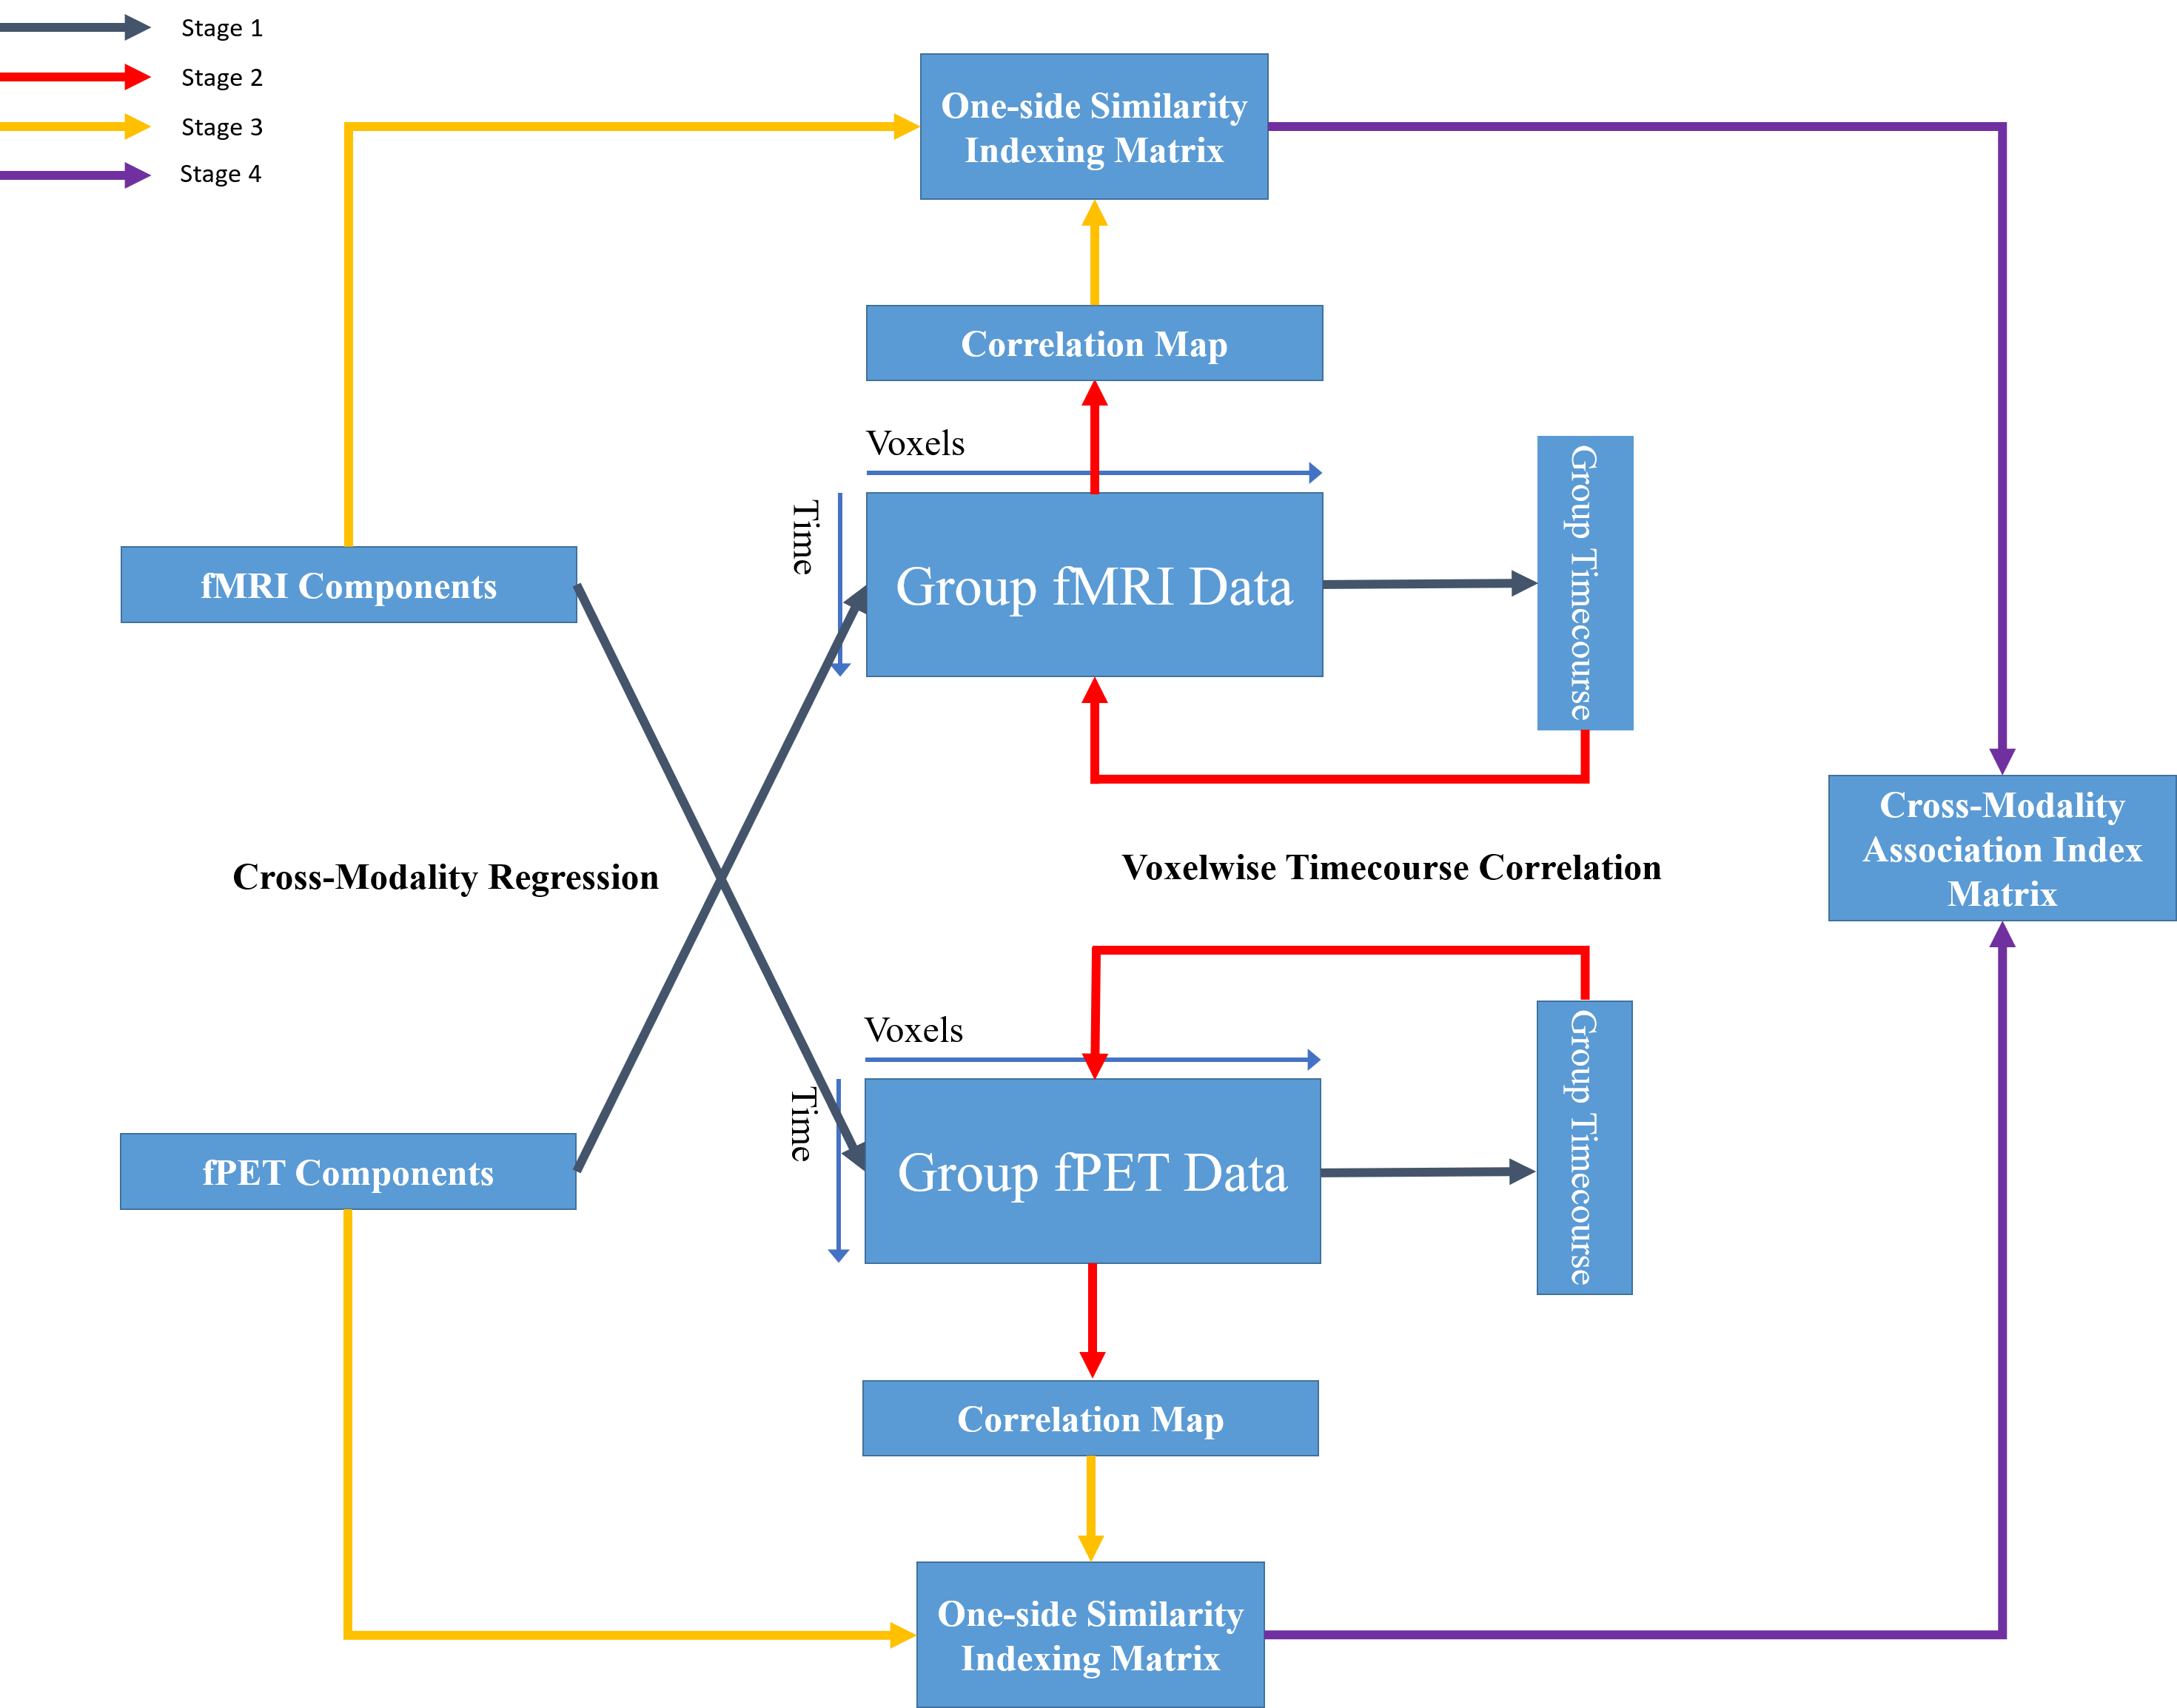
Group-level spatial ICA was applied with 15 components in fMRI data and 10 components in fPET data. The associations between these components, both spatially and temporally, were explored in a multi-stage regression approach. This approach is described schematically (Figure 1) and as follows:
Consider that $$$X_m\in \mathbb{R}^{N_m\times V}$$$ and $$$X_p\in \mathbb{R}^{N_p\times V}$$$ are the group spatiotemporal matrices for fMRI and fPET data, respectively, with number of timepoints $$$N_m$$$ and $$$N_p$$$ in the shared space $$$V$$$. The ICA components obtained from $$$X_m$$$ and $$$X_p$$$ are denoted $$$S_m\in \mathbb{R}^{M_m \times V} $$$ and $$$S_p\in \mathbb{R}^{M_p \times V} $$$, where $$$M_m$$$ and $$$M_p$$$ are the numbers of components for each modality.
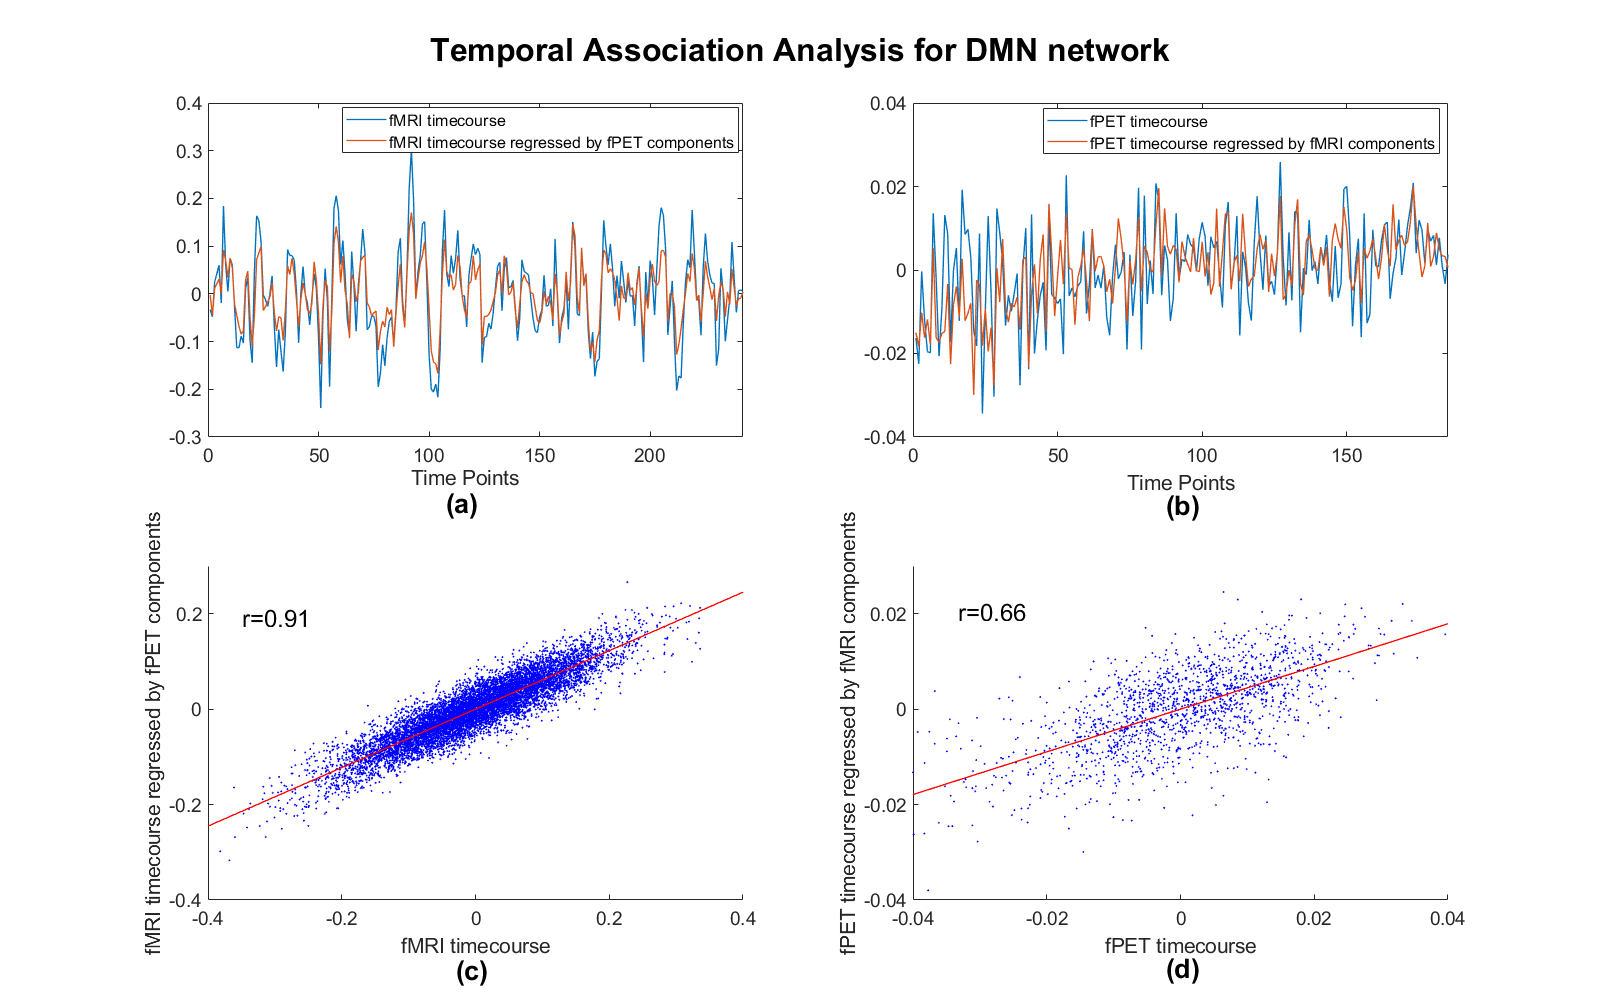
Stage 1: A cross-modality regression was performed to extract the global time-course of one modality using the spatial component map of the other. The cross-modality regressed time-courses are given by $$$T_{p,m}=X_mS_p^{\dagger}$$$ and $$$T_{m,p}=X_pS_m^{\dagger}$$$, where $$$\dagger$$$ denotes the pseudo-inverse. It indicates extracting an fMRI time-course for each fPET component, and vice versa.
Stage 2: Cross-modality correlation maps $$$C_{p,m}\in \mathbb{R}^{ M_p \times V}$$$ were calculated by correlating the global time-course $$$T_{p,m} $$$ with voxel-wise time-courses in $$$X_m$$$. Another correlation maps $$$C_{m,p}\in \mathbb{R}^{ M_m \times V}$$$ were obtained similarly by correlating $$$T_{m,p} $$$ with $$$X_p$$$.
Stage 3: The similarity between cross-modality correlation maps $$$C_{p,m}$$$ and fMRI components $$$S_m$$$, given by $$$I_{p,m}\in \mathbb{R}^{M_p \times M_m}$$$, was calculated using the Sørensen–Dice coefficient applied to each pair of components. Another directional similarity $$$I_{m,p}\in \mathbb{R}^{M_p \times M_m}$$$ between $$$S_p$$$ and $$$C_{m,p}$$$ was also derived.
Stage 4: Finally, an association index was defined using the bi-directional similarity
$$I=\frac{2I_{p,m}.*I_{m,p}}{I_{p,m}+I_{m,p}}$$
The association index is biased against the strong one-side association to emphasize bi-directionality.
Results and Discussion
The independent components of the fMRI and fPET datasets for the eight subjects are shown in Figure 2. The cross-modality spatiotemporal association index was estimated for these components (Figure 3(a)). This index reported six pairs of strongly related components (as shown in Figure 4). It demonstrates strong spatiotemporal association in visual network, default mode network and sensorimotor network between BOLD and glucose metabolism. Some components exhibited multiple associated, which may suggest the subdivision of networks. Compared to the conventional spatial overlap, shown in Figure 3(b), two more pair of associated components (IC10 in fPET and IC3 in fMRI, IC7 in fPET and IC6 in fMRI) are identified and one pair (IC1 in fPET and IC5 in fMRI) is muted. It demonstrates that spatial overlap alone may exclude some related components and imply spurious correlations. By projecting both temporal and spatial information in RSNs from two modalities into the proposed cross-modality association index, a richer spatiotemporal overlap can be performed. Thus, identifying more robust associations between RSNs from the two modalities.Conclusion
The cross-modality association index utilises the spatiotemporal information in each modality to measure the association between fMRI and fPET RSNs. Using a cohort of fMRI and fPET datasets, the method identifies the associated networks between BOLD and glucose metabolic RSNs.Acknowledgements
We acknowledge Richard McIntyre, Alexandra Carey, Francesco Fforazzini, Jakub Baran and Tom Close for their support in this work.References
1. Biswal, B., et al., Functional connectivity in the motor cortex of resting human brain using echo-planar MRI. Magn Reson Med, 1995. 34(4): p. 537-41.
2. Calhoun, V.D., et al., Spatial and temporal independent component analysis of functional MRI data containing a pair of task-related waveforms. Hum Brain Mapp, 2001. 13(1): p. 43-53.
3. McKeown, M.J., et al., Analysis of fMRI data by blind separation into independent spatial components. Hum Brain Mapp, 1998. 6(3): p. 160-88.
4. Hahn, A., et al., Quantification of Task-Specific Glucose Metabolism with Constant Infusion of 18F-FDG. J Nucl Med, 2016. 57(12): p. 1933-1940.
5. Villien, M., et al., Dynamic functional imaging of brain glucose utilization using fPET-FDG. Neuroimage, 2014. 100: p. 192-9.
6. Di, X., B.B. Biswal, and I. Alzheimer's Disease Neuroimaging, Metabolic brain covariant networks as revealed by FDG-PET with reference to resting-state fMRI networks. Brain Connect, 2012. 2(5): p. 275-83.
7.Savio, A., et al., Resting-State Networks as Simultaneously Measured with Functional MRI and PET. J Nucl Med, 2017. 58(8): p. 1314-1317
Figures