4330
Dose minimization in the detection of supraclavicular brown adipose tissue in 18F-FDG TOF-PET/MR: a simulation study1Department of Nuclear Medicine, University Hospital Zurich, Zurich, Switzerland, 2University of Zurich, Zurich, Switzerland, 3Institute of Diagnostic and Interventional Radiology, University Hospital Zurich, Zurich, Switzerland, 4Department of Health Sciences and Technology, Institute of Food, Nutrition and Health, ETH Zurich, Schwerzenbach, Switzerland, 5Department of Endocrinology, Diabetes and Metabolism, University Hospital Basel, Basel, Switzerland, 6University of Basel, Basel, Switzerland
Synopsis
An increasing number of prospective trials are investigating the activity of brown adipose tissue (BAT) with 18F-FDG PET, in patients as well as in healthy volunteers. According to the Brown Adipose Reporting Criteria in Imaging Studies (BARCIST 1.0) the injected dose of 18F-FDG should be as low as possible, for statistically valid imaging, with consideration for total dosage in repeat studies. In our 18F-FDG TOF PET/MR simulation study we found that a minimum injected dose of 15MBq (0.29mSv) still allowed for accurate quantification of BAT activity, without a significant increase in noise or artifacts.
INTRODUCTION
The high glucose consumption of brown adipose tissue (BAT) lead to a large number of studies, using 18F-fluoro-2-deoxy-D-glucose (18F-FDG) positron emission tomography (PET) as a surrogate marker for the metabolic activity of BAT (1-3). In 2017, the Brown Adipose Reporting Criteria in Imaging Studies (BARCIST 1.0) was published and it recommended an injected dose of 18F-FDG as low as possible, for statistically valid imaging, with consideration for total dosage in repeat studies (4). However, decreasing the injected dose, increases the image noise, what might lead to false positive activity in normal fat. Therefore, the aim of this study is to determine the minimal 18F-FDG dose necessary, to achieve accurate quantification of BAT activity, without a significant increase in noise or artifacts.
METHODS
A total of 20 18F-FDG PET/MR datasets from 13 male volunteers (median age: 23 years, range: 19-28 years, median body mass index: 22.9 kg/m2, range: 18.6-25.4 kg/m2) were available from a prospective clinical trial investigating BAT. To stimulate BAT activity, all participants received 200 mg Mirabegron and were exposed to a standardized mild cooling protocol. All scans were performed with a time-of-flight (TOF) PET/MR system. After injecting 75MBq of 18F-FDG a 30 minutes dynamic PET acquisition of the neck area (1 bed position) was started. During PET scanning, a default MR sequence was executed for PET attenuation correction (MR-AC) (5,6). In addition, up to 10 minutes of T1-, T2-, T2*-, and diffusion-weighted MR imaging was performed. Therefore, we choose to reconstruct the last 10 minutes of the 30 minutes PET frames 7 times with: 35%, 30%, 25%, 20%, 15%, 10% and 5% of the original dose. Dose reductions were simulated by removing counts from the listmode data on a second by second basis. The scanner’s OSEM based reconstructions included all default settings (2 iterations, 28 subsets) and corrections. Image quality was scored using a five-point scale (1: bad – 5: good) and image artifacts were scored using a three-point scale (0: no artifact – 2: significant artifacts). Standardized uptake values (SUL) were normalized using the lean body mass (7). Regions of interest (ROIs) were drawn bilateral around supraclavicular BAT and around artifacts. Cubic (16.6 cm3) background ROIs were drawn bilateral in the infraspinatus muscle. SULmax, SULmean and SULstd (standard deviation) were obtained in each ROI. The coefficient of variation (CoV = SULstd / SULmean) was calculated for the background ROIs to assess image noise. Differences were evaluated using the Wilcoxon and 2way ANOVA tests and were considered statistically significant when p<0.05.
RESULTS
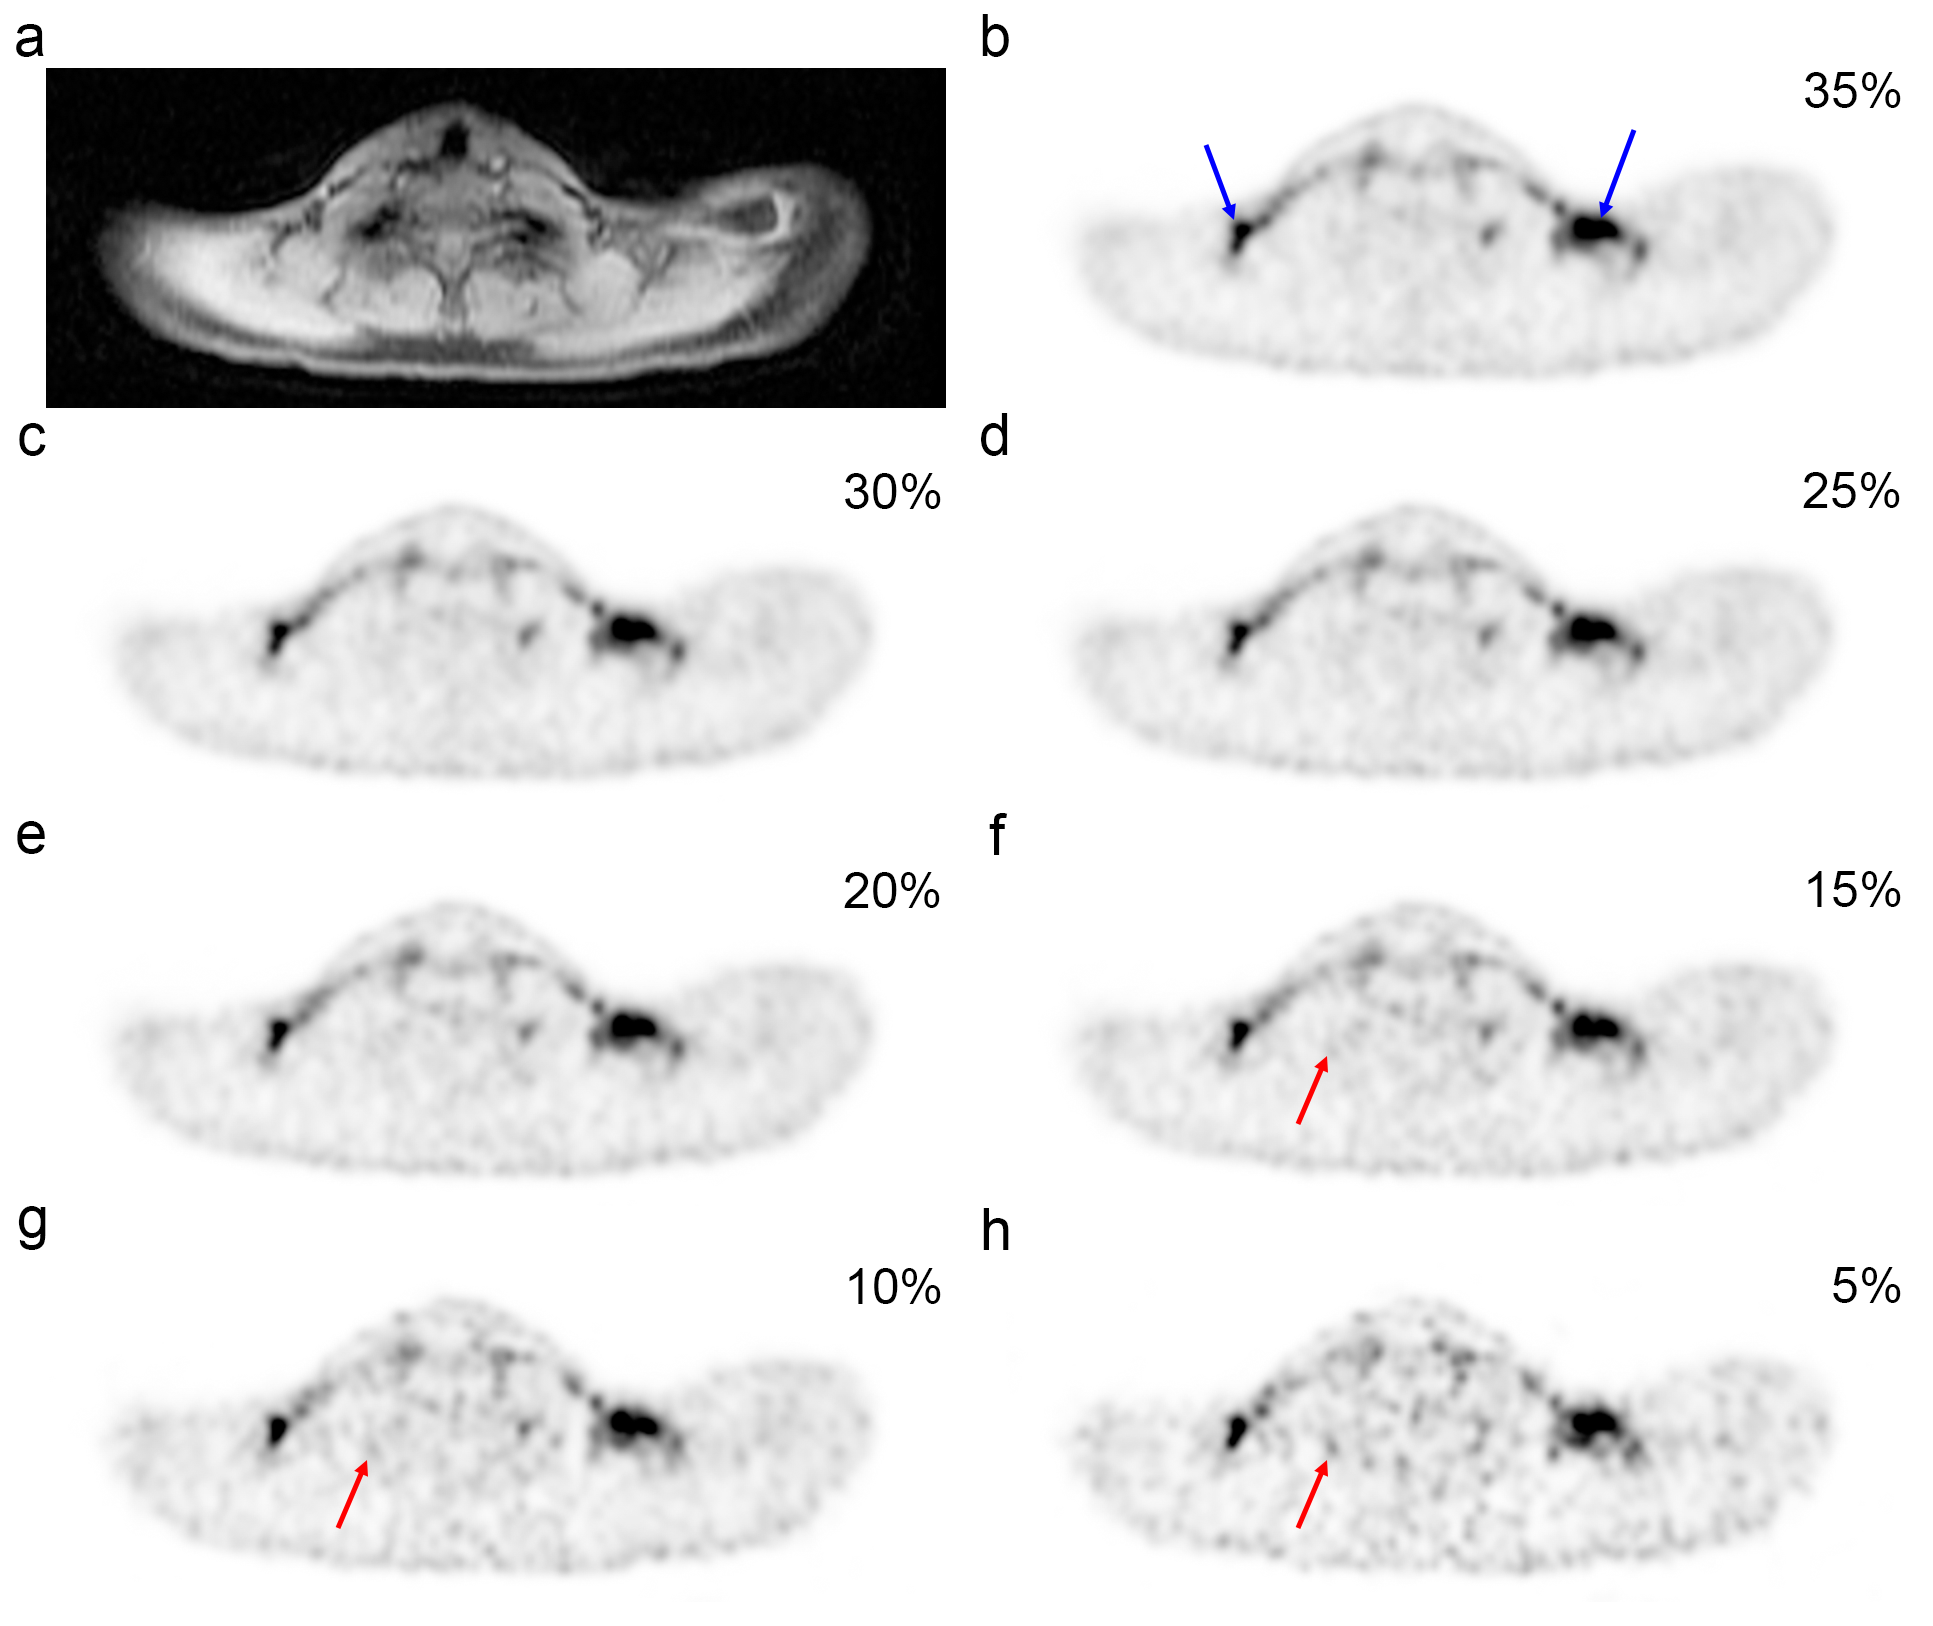
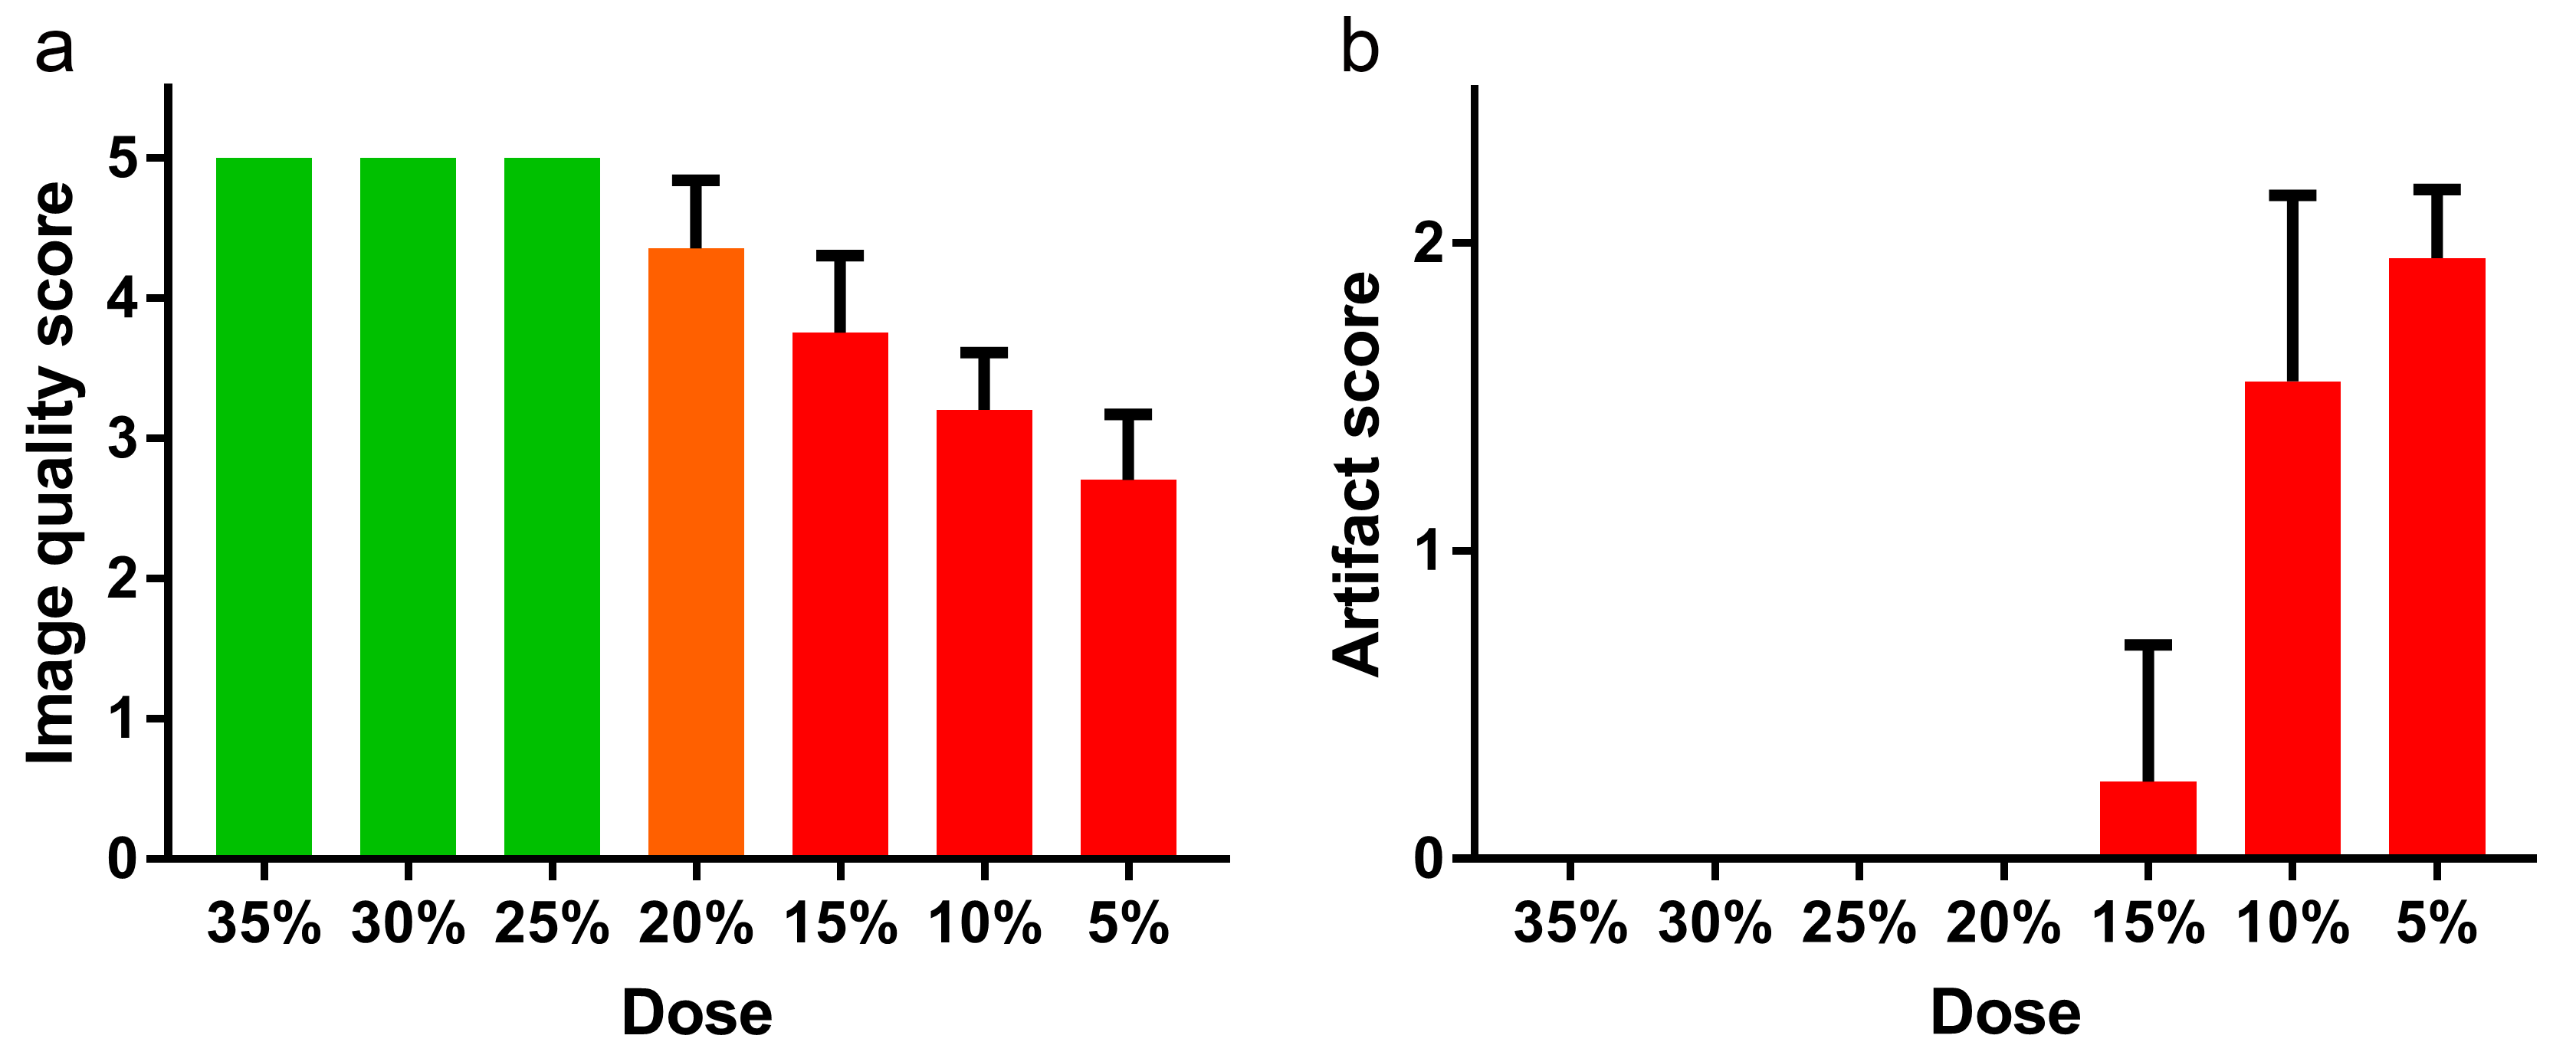
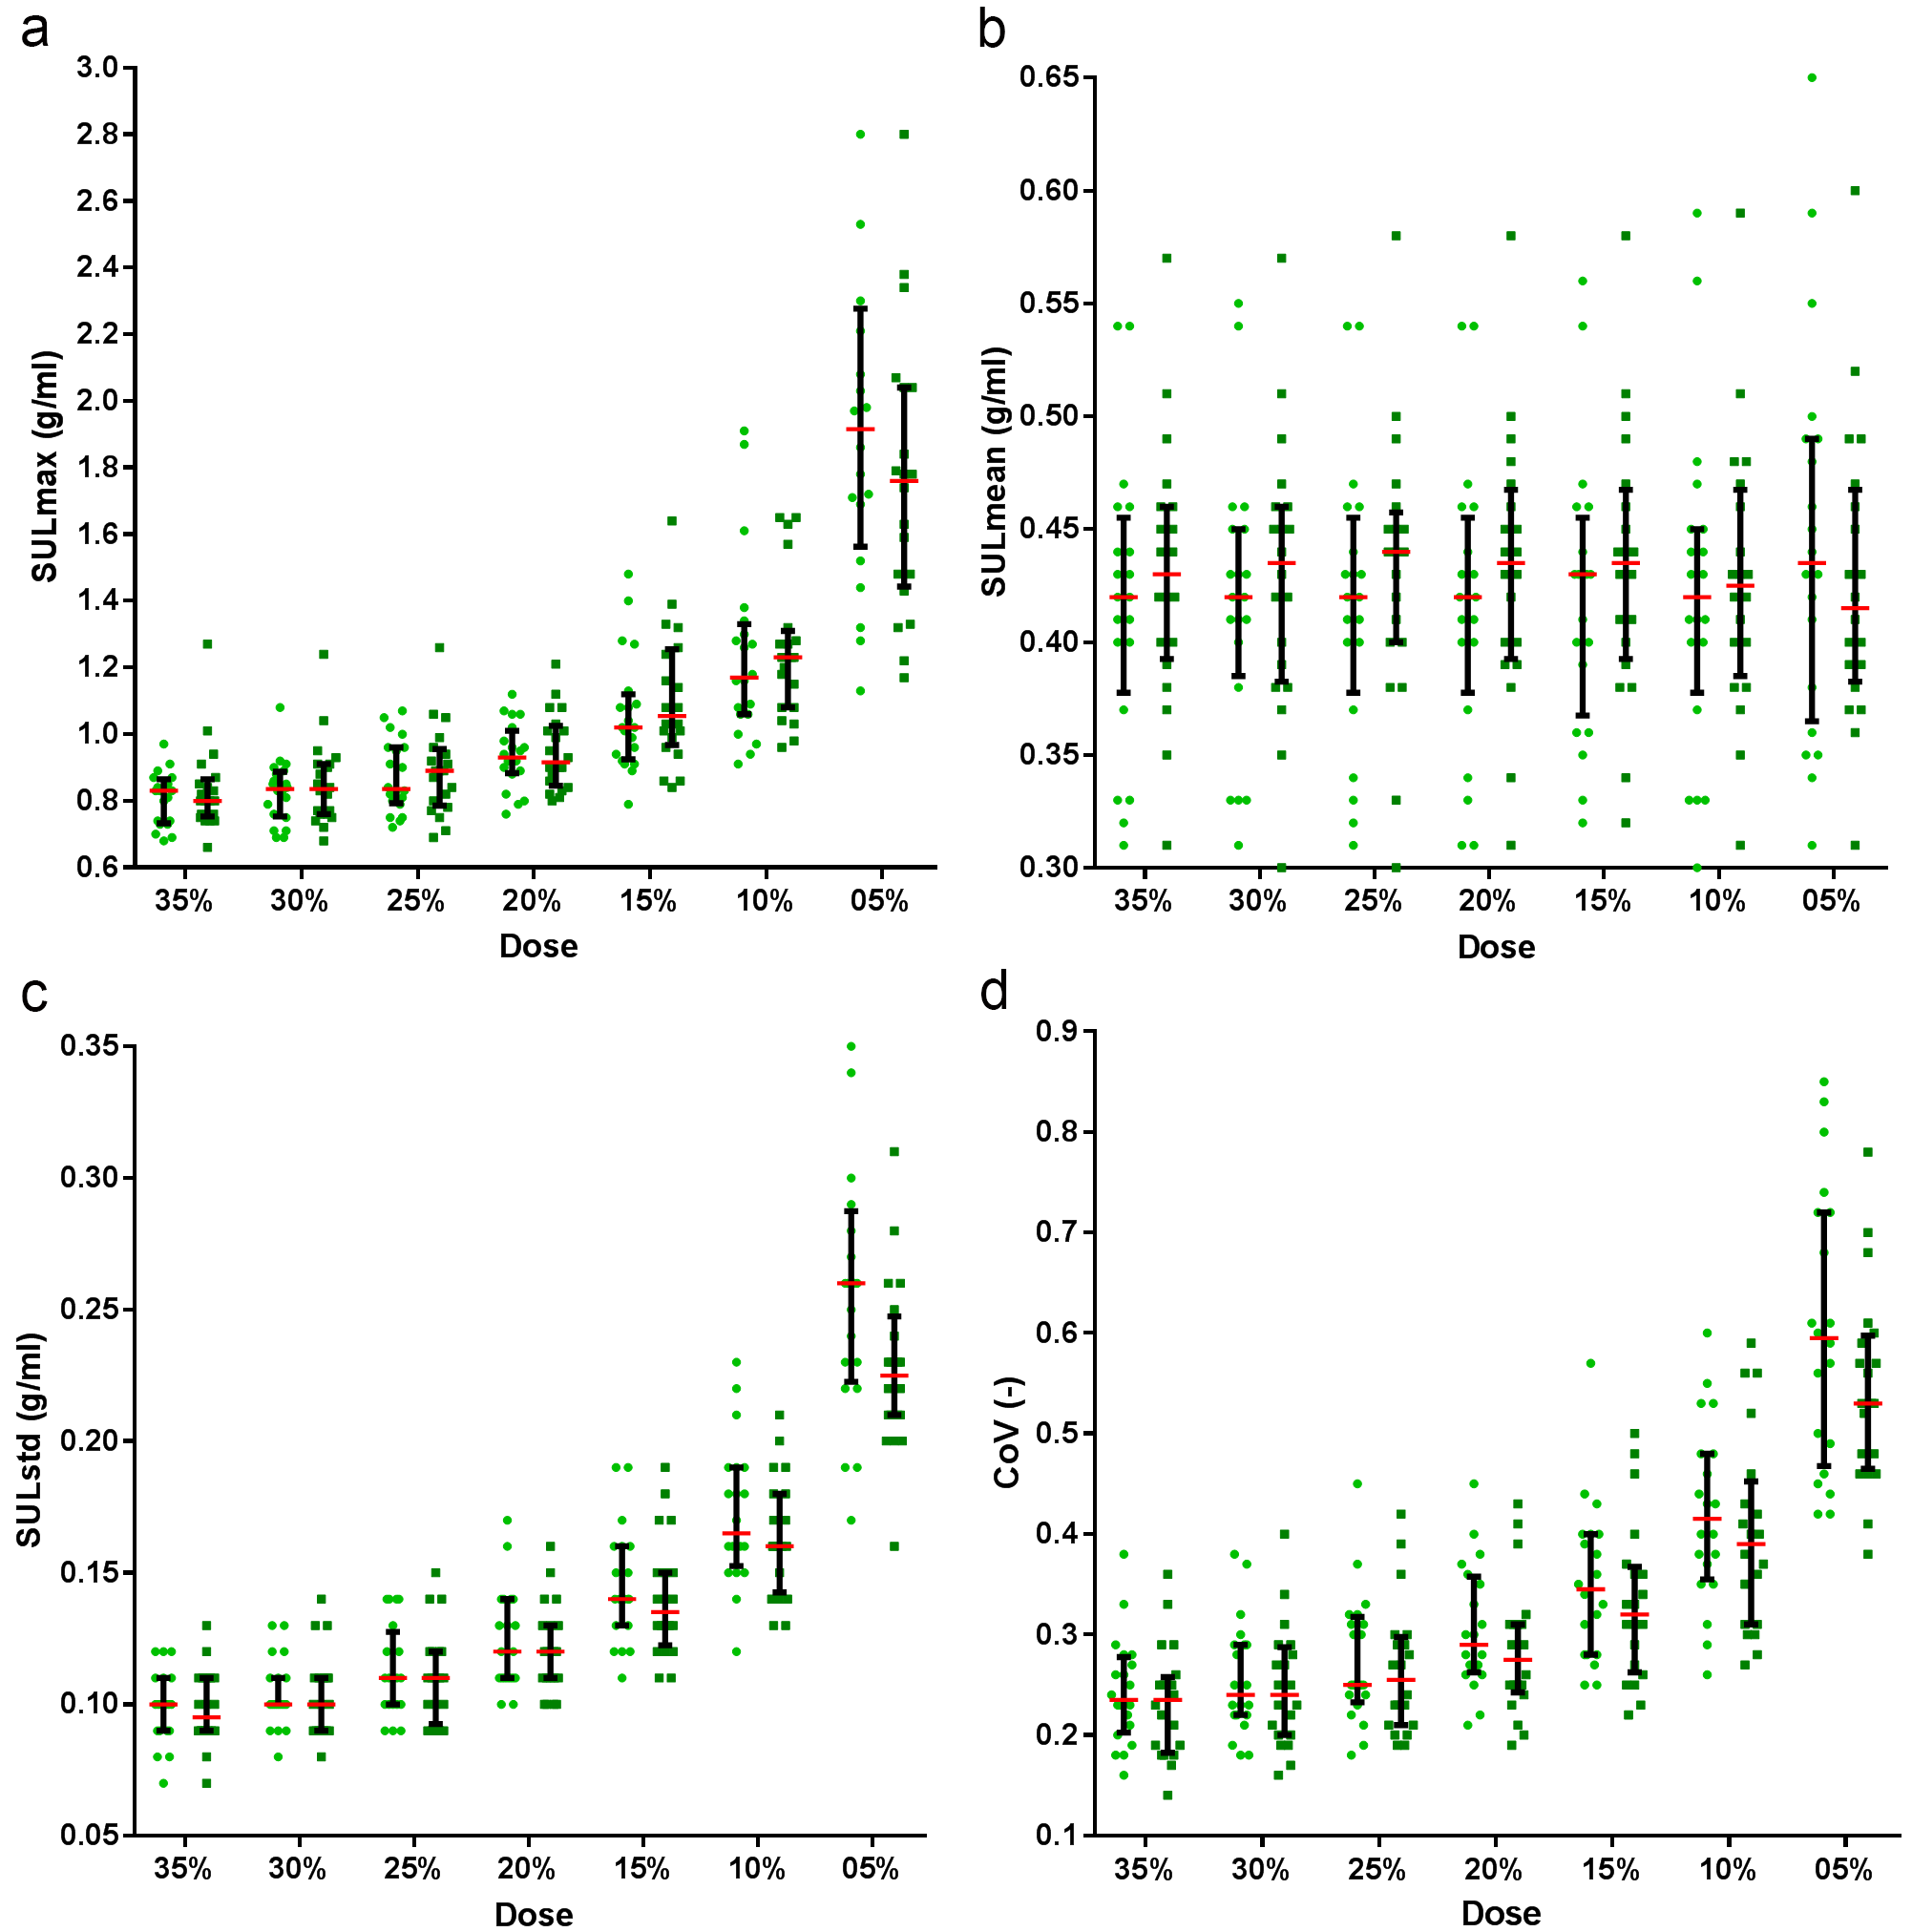
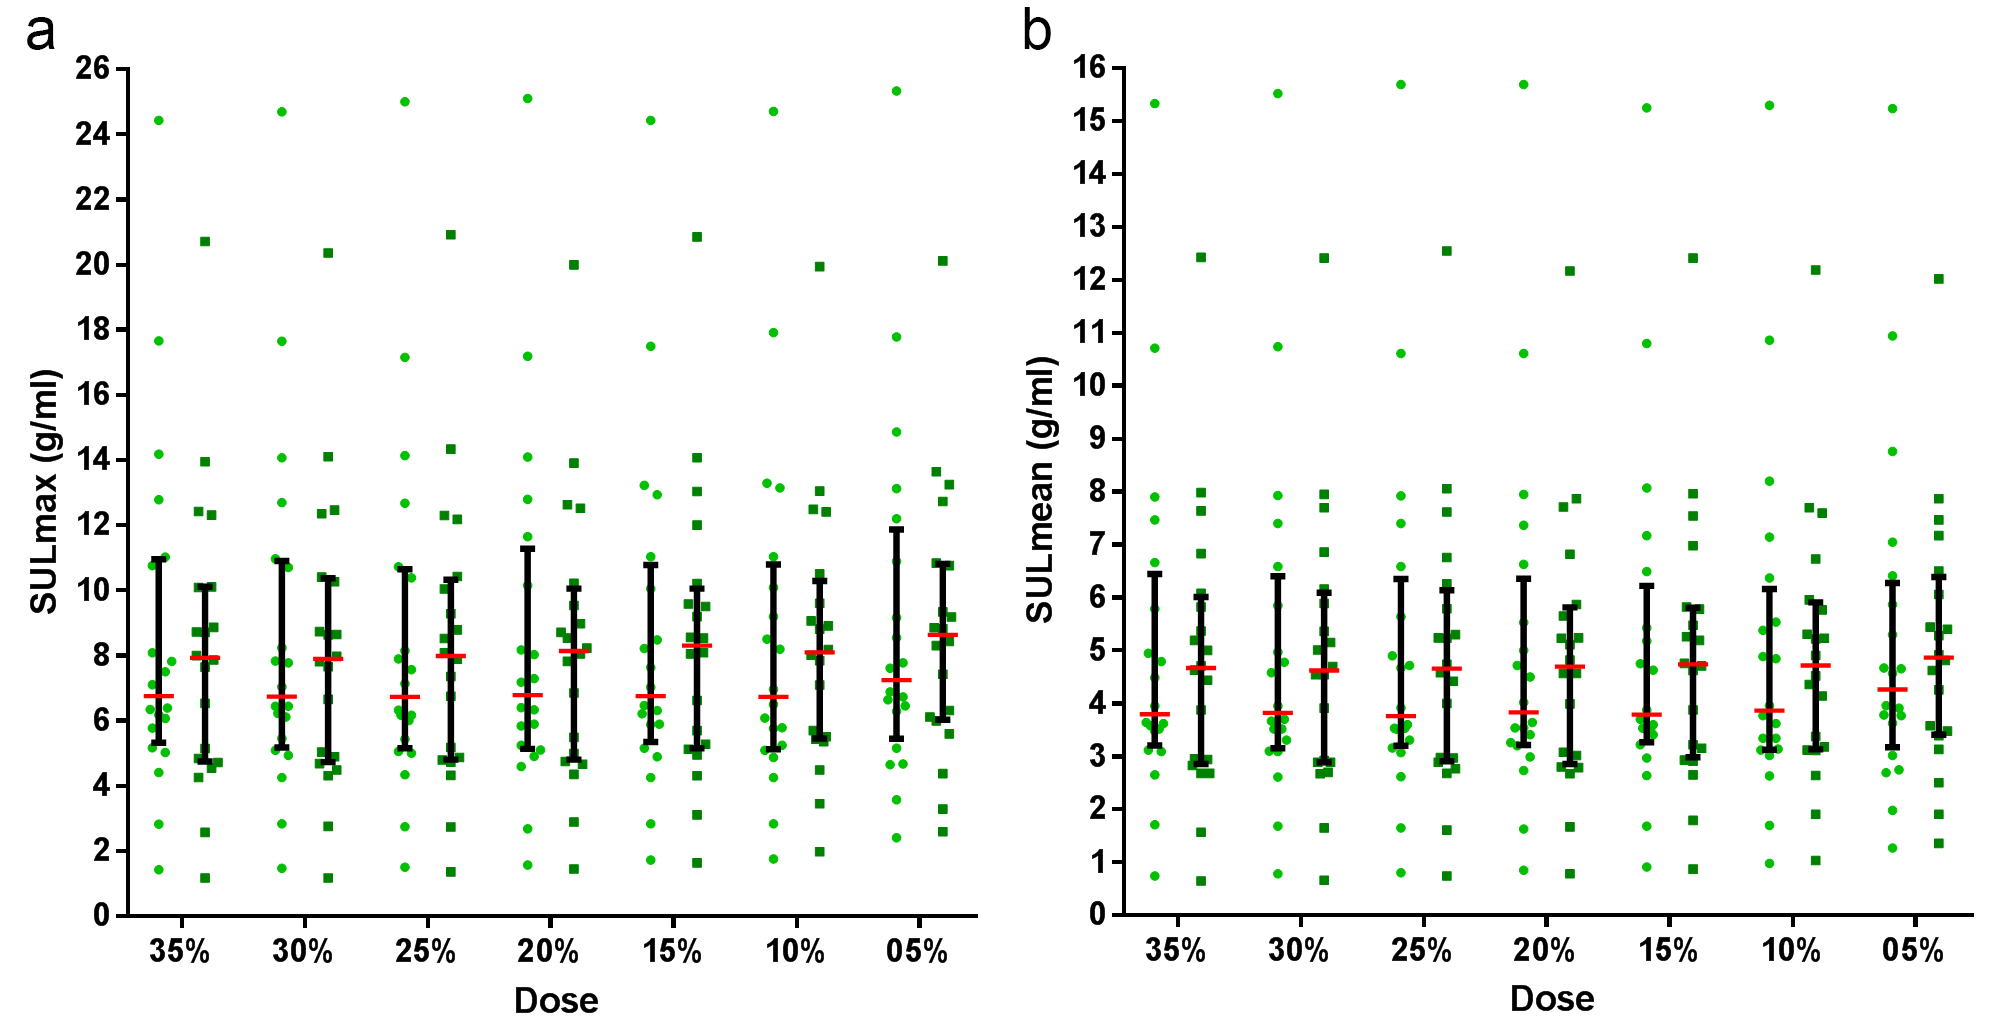
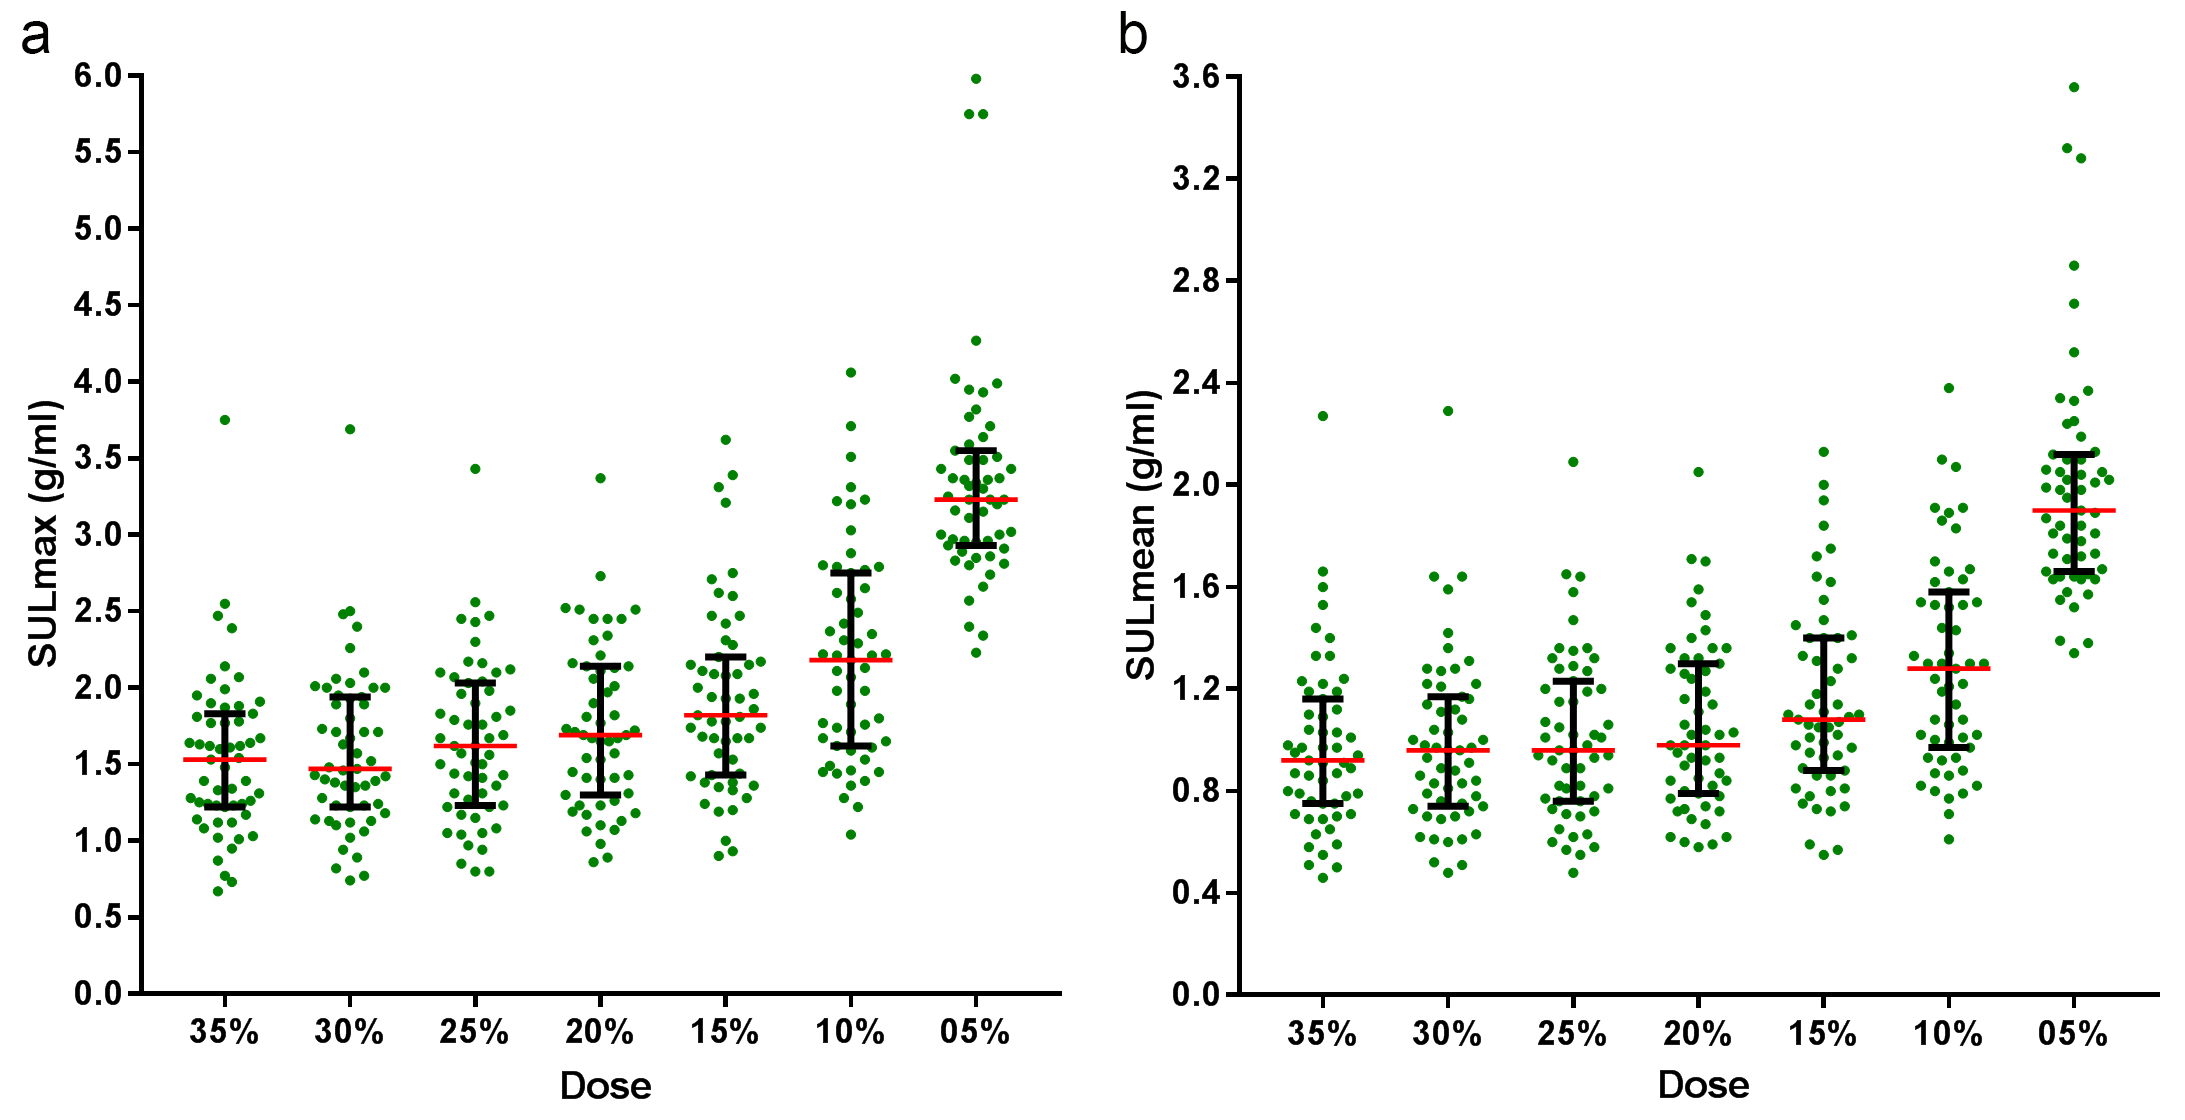
An increase of image noise can clearly be observed with decreasing dose (figure 1). The 35%, 30% and 25% reconstructions have a good image quality (green bars in figure 2), the 20% reconstructions have a slightly lower but still acceptable quality (orange bars) and the 15%, 10%, 5% reconstructions have lower image quality and have increasing artifacts. The background CoV graph (figure 3) indicates that the 35%, 30%, 25% reconstructions have relative low background noise, the 20% reconstructions have a somewhat increased background noise and the 15%, 10% and 5% reconstructions have a higher background noise. There is no significant difference between any of the background SULmean measurements. The same holds for the 35%, 30%, 25% and 20% SULmax, the 35%, 30%, 25% SULstd, and the 35%, 30% and 25% CoV measurements. This is in accordance with the visual image quality and artifact score. The dose reduction has no significant effect on the SULmax and SULmean of the BAT measurements (figure 4). SULmax and SULmean of the artifacts significantly increases with dosis lower than 30%, and especially with the 15%, 10%, and 5% reconstructions (figure 5). There was no significant difference between 35% and 30% SULmean.DISCUSSION
In our simulation study, we showed that reconstructions with only 20% of the normal dose still result in PET images with an acceptable image quality without any significant artifacts or background noise. This means that an injected dose of 15 MBq, which corresponds to an effective dose of only 0.29mSv, could be sufficient for an accurate quantification of BAT activity. It should be noted that the presented results depend on the detected number of counts. Higher doses are recommended for obese participants, less sensitive PET scanners or shorter acquisition protocols. To validate the results, future BAT studies could stepwise lower the injected dose.CONCLUSION
The results of this simulated 18F-FDG TOF PET/MR study indicate that the injected dose can be reduced to only 15 MBq without loss of significant image quality and accurate BAT quantification.Acknowledgements
No acknowledgement found.References
1. Cohade C, Mourtzikos KA, Wahl RL. "USA-Fat": prevalence is related to ambient outdoor temperature-evaluation with 18F-FDG PET/CT. J Nucl Med. 2003;44:1267-1270.
2. Cohade C, Osman M, Pannu HK, Wahl RL. Uptake in supraclavicular area fat ("USA-Fat"): description on 18F-FDG PET/CT. J Nucl Med. 2003;44:170-176.
3. Cypess AM, Lehman S, Williams G, et al. Identification and importance of brown adipose tissue in adult humans. N Engl J Med. 2009;360:1509-1517.
4. Chen KY, Cypess AM, Laughlin MR, et al. Brown Adipose Reporting Criteria in Imaging STudies (BARCIST 1.0): Recommendations for Standardized FDG-PET/CT Experiments in Humans. Cell Metab. 2016;24:210-222.
5. Wollenweber SD, Ambwani S, Delso G, et al. Evaluation of an atlas-based PET head attenuation correction using PET/CT & MR patient data. IEEE Trans Nucl Sci. 2013;60:3383-3390.
6. Wollenweber SD, Ambwani S, Lonn AHR, et al. Comparison of 4-class and continuous fat/water methods for whole-body, MR-based PET attenuation correction. IEEE Trans Nucl Sci. 2013;60:3391-3398.
7. Janmahasatian S, Duffull SB, Ash S, Ward LC, Byrne NM, Green B. Quantification of lean bodyweight. Clin Pharmacokinet. 2005;44:1051-1065.
Figures