4329
Joint estimation of activity and attenuation using 68Ga-PSMA TOF PET/MR in patients with hip endoprosthesis1Department of Nuclear Medicine, University Hospital Zurich, Zurich, Switzerland, 2University of Zurich, Zurich, Switzerland, 3GE Global Research, Niskayuna, NY, United States, 4GE Healthcare, Munich, Germany, 5GE Healthcare, Waukesha, WI, United States
Synopsis
Accurate PET attenuation correction remains challenging in PET/MR. Skeletal bone is usually not included and metal implants can cause serious artifacts. In this study we investigate the application of the ‘joint estimation of activity and attenuation’ PET reconstruction algorithm, using MR based priors, in prostate cancer patients with metal hip implants who were scheduled for 68Ga-PSMA TOF PET/MR. The results indicate that, even with the low background-signal of this tracer, the JE algorithm can recover most of the metal hip implant(s), thereby potentially improving the PET attenuation map as well as the activity images.
INTRODUCTION
Accurate attenuation correction (AC) remains challenging in PET/MR as, for example, skeletal bones are usually not included in the AC maps. Additionally, metal implants cause artifacts on MR images and likely on MR based AC maps and PET activity images.(1) Joint estimation (JE) of activity and attenuation, based on PET data, gains interest as it could address these challenges.(2) A JE algorithm using time-of-flight (TOF) information and MR-based priors (3), could possibly be useful for prostate cancer patients scheduled for PET/MR as many of these (elderly) patients have metal hip endoprosthesis. However, the metal implant could also affect the MR based prior. Moreover, the often used 68Ga-PSMA tracer in prostate cancer patients has only limited background signal, which could be problematic for JE. Therefore, in this study we investigated the application of JE in prostate cancer patients with hip implants who were scheduled for 68Ga-PSMA TOF PET/MR.METHODS
A total of 20 of these patients were included. After the injection of 68Ga-PSMA (median dose 128MBq) a 30 minutes dynamic PET scan of the pelvic region was started. From this scan 3 and 10 minutes TOF PET emission data was obtained. For attenuation correction the dedicated 3D, dual echo, gradient echo, sequence with Dixon-like fat-water separation was acquired.(4) All datasets were reconstructed using MR based AC (MR-AC) maps and JE based AC (JE-AC) maps. All reconstructions were performed using the GE PET recon toolbox (GE Healthcare). The MR-AC maps were generated using the default 4-class segmentation method.(4) The JE-AC maps were generated using the JE algorithm (3), with 5 outerloop iterations, each of which consists of 1 iteration of TOF OSEM with 28 subsets, and 5 iterations of OSTR with 28 subsets. Scatters were re-estimated for every outerloop iteration and the MR images were applied as prior. Final activity images were reconstructed with the MR-AC and JE-AC maps using the standard TOF OSEM reconstruction (28 subsets and 2 iterations), with all corrections and default filters applied. Images were visually inspected on a dedicated workstation. Regions of interest (ROIs) were drawn around PET hotspots and SUVmax values were obtained. Differences were evaluated using the Wilcoxon tests and considered statistically significant when p<0.05.Results
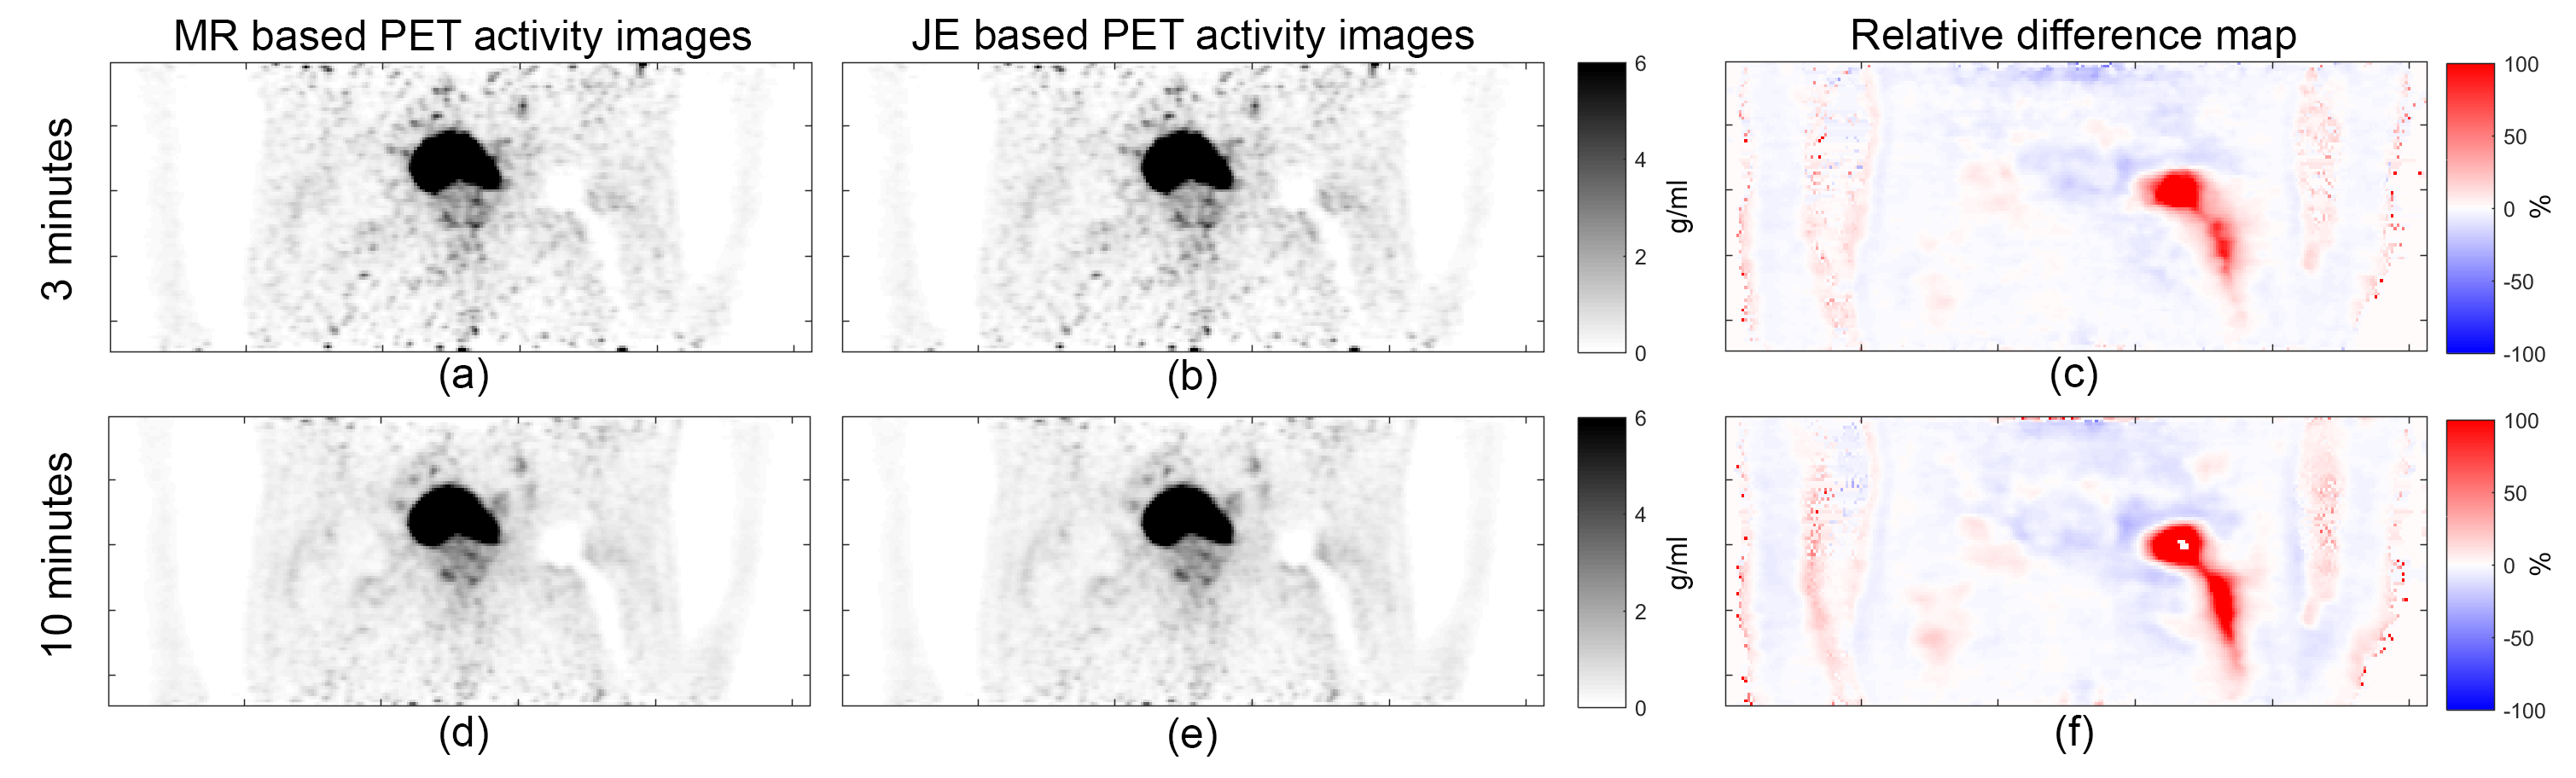
Figure 1 shows an example patient case. The large MR signal void due to a metal hip implant is shown (i). On the MR-AC map the signal void is not visible as it is automatically filled with softtissue values (a,d). However, the AC values for the metal implant are missing (a,d). In contrast to the MR-AC map, the JE-AC map clearly shows the recovered AC values for the metal implant and the softtissue surrounding it (b,e). The differences between the MR-AC and JE-AC are more cleary shown in the relative difference maps ([JE-AC – MR-AC] / MR-AC) (c,f). Although JE partially recovers the implant with the 3 minute dataset (average: 2.43x10^7 counts), the 10 minute dataset (average: 8.38x10^7 counts) performs better (b,e,h). Figure 2 shows the corresponding PET activity images. The implant can be clearly appreciated in all PET activity images, which is likely due to the TOF information. Although the images look somewhat similar, the relative difference maps show that the SUV values in the area of the implant are higher with the JE-AC map. Figure 3 and 4 show a similar patient case, however, this time with an even larger MR artifact due to 2 metal hip implants. Figure 5 shows that the JE-AC maps contain more higher values (due to the metal implant) and the PET activity images reconstructed with JE-AC maps have more higher SUV values (near the metal implant) compared to reconstructions with MR-AC maps. In 10 patients, a hotspot near the implant was found. In all cases the SUVmax was higher for JE-AC compared to MR-AC (p<0.01 and p=0.01 for 3 and 10 minutes). In 14 patients a hotspot near the prostate was found, but no significant difference in SUVmax was found between MR-AC and JE-AC.Discussion and Conclusion
The JE algorithm attempts to estimate both a PET activity image and an attenuation map using measured TOF PET data and MR based priors. In contrast to the 10 minute measured 68Ga-PSMA PET data, the 3 minute data proved to be on the low side for a clear recovery of the metal implant. Although the pelvic region contains large bones, we did not notice bone values in the AC maps. Unfortunately no CT data was available for reference in this study.
This study indicates that the JE algorithm can recover metal hip implant(s) in prostate cancer patients scheduled for 68Ga-PSMA TOF PET/MR, thereby potentially improving the PET attenuation map as well as the activity images.
Acknowledgements
No acknowledgement found.References
1. Svirydenka H, Delso G, De Galiza Barbosa F, et al. The Effect of Susceptibility Artifacts Related to Metallic Implants on Adjacent-Lesion Assessment in Simultaneous TOF PET/MR. J Nucl Med. 2017;58:1167-1173.
2. Nuyts J, Dupont P, Stroobants S, Benninck R, Mortelmans L, Suetens P. Simultaneous maximum a posteriori reconstruction of attenuation and activity distributions from emission sinograms. IEEE Trans Med Imaging. 1999;18:393-403.
3. Ahn S, Cheng L, Shanbhag DD, et al. Joint estimation of activity and attenuation for PET using pragmatic MR-based prior: application to clinical TOF PET/MR whole-body data for FDG and non-FDG tracers. Phys Med Biol. 2018;63:045006.
4. Wollenweber SD, Ambwani S, Lonn AHR, et al. Comparison of 4-class and continuous fat/water methods for whole-body, MR-based PET attenuation correction. IEEE Trans Nucl Sci. 2013;60:3391-3398.
Figures