4326
Improved attenuation correction for cardiac 18F-FDG PET/MR hybrid imaging1High-Field and Hybrid MR Imaging, University Hospital Essen, Essen, Germany, 2Department of Diagnostic and Interventional Radiology and Neuroradiology, University Hospital Essen, Essen, Germany, 3Erwin L. Hahn Institute for Magnetic Resonance Imaging, University Duisburg Essen, Essen, Germany
Synopsis
The aim of this study was to evaluate and quantify the effect of improved attenuation correction including bone segmentation and truncation correction on 18F-FDG cardiac PET/MR imaging. Therefore, 32 cardiac patient data sets were reconstructed with different AC-maps and polar plots were generated and analyzed. The MR-based HUGE method for truncation correction combined with CT model-based bone segmentation resulted in a homogeneous 6% gain of PET signal across the myocardium compared to standard Dixon-VIBE imaging. The majority of observed AC-map artifacts did not significantly affect the quantitative assessment of the myocardium.
Purpose:
Attenuation correction (AC) of positron emission tomography (PET) data is an essential step in obtaining accurate and quantitative PET images [1]. Latest methods in MR-based AC in PET/ magnetic resonance (MR) hybrid imaging is a segmentation approach based on a Dixon-VIBE MR sequence combined with the MR-based field-of-view (FOV) extension method HUGE [2] and with bone segmentation [3] [4]. The aim of this study was to evaluate and quantify the effect of improved attenuation correction including bone segmentation and truncation correction on 18F-Fluordesoxyglucose cardiac PET/MR imaging.Methods:
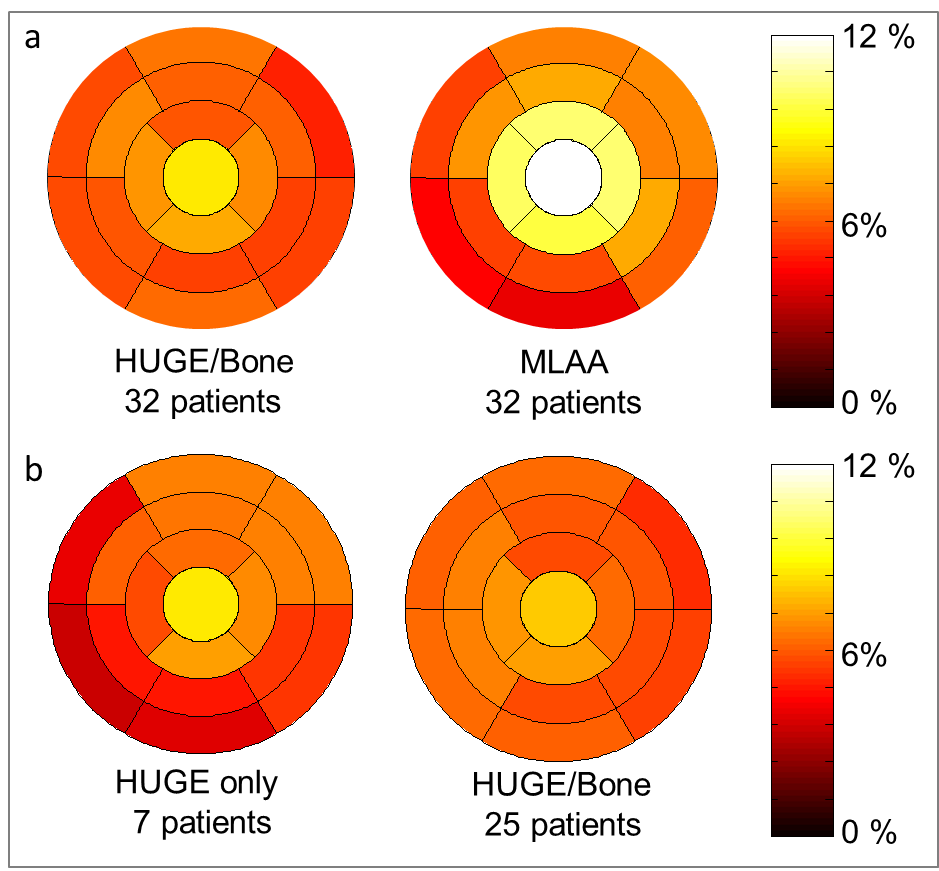
The impact of improved AC was investigated in 32 cardiac patient datasets. Multiple reconstructions of the PET data with three different AC-maps (1. Dixon-VIBE only, 2. Dixon-VIBE plus HUGE truncation correction and bone segmentation, 3. Dixon-VIBE plus MLAA) were generated. The Dixon-VIBE AC-maps served as reference standard. PET data was reconstructed and 17-segment short-axis polar plots [5] of the left ventricle were analyzed regarding the impact of each of the three AC methods on PET quantification in cardiac PET/MR imaging. All AC-maps were evaluated for artifacts [6].Results:
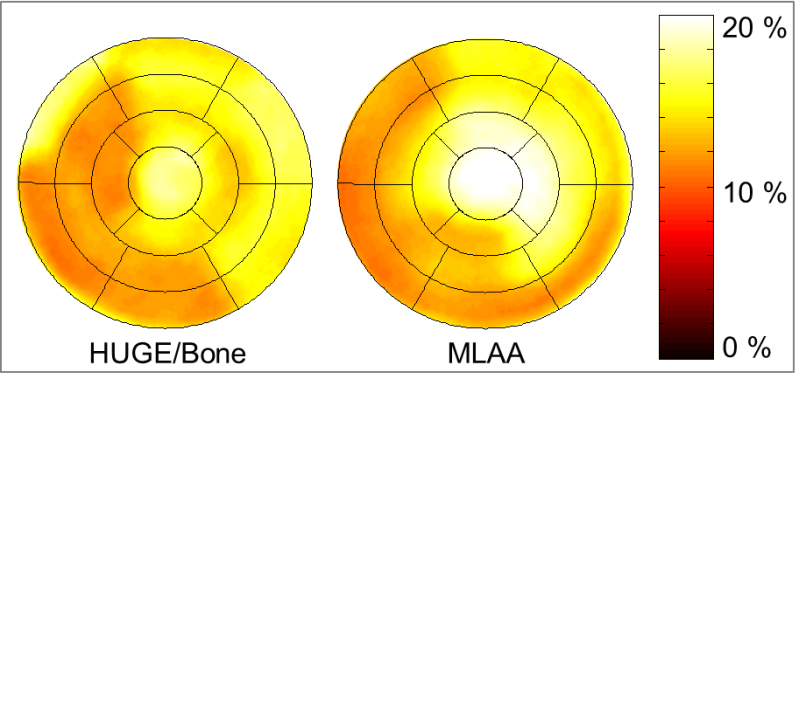
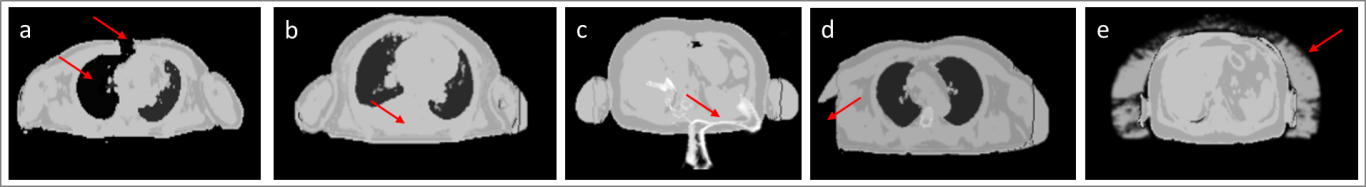
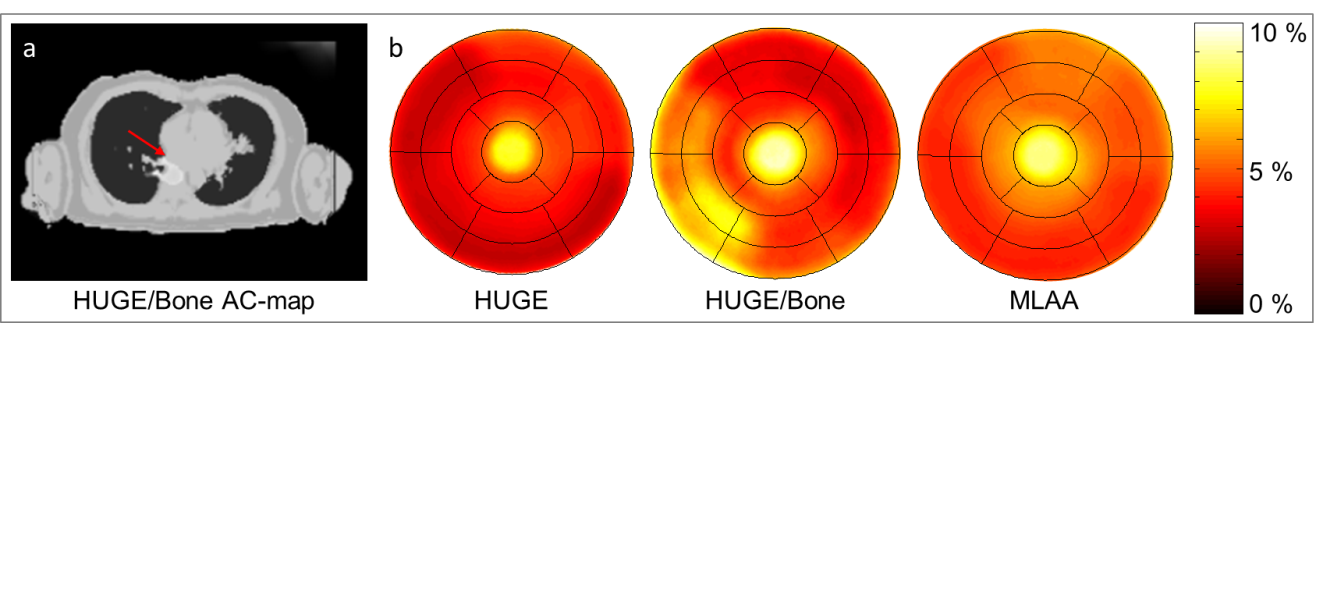
Using HUGE truncation correction and bone segmentation for AC resulted in a homogeneous gain of ca. 6.1 ± 3.0 % and for MLAA 8.3 ± 4.3 % of PET increased signal across the myocardium of the left ventricle over all patients when compared to Dixon-VIBE AC only (Fig. 1a). The differences in measured activity are statistically significant (p < 0.05) for both FOV extension methods HUGE and MLAA. Maximal relative differences were observed in segment 17 (apex). MLAA and HUGE-only corrected data show a slight decrease in relative difference in segments 2-4 and 9-10 due to missing bone information (Fig. 1b). In Fig. 2 maximal relative differences between improved AC and standard Dixon-VIBE AC were observable across the entire patient population. Note that especially in segment 17 (apex) maximal differences up to 20 % for MLAA were determined. The patient in Fig. 2 has a BMI of 36.7 kg/m². The gain in AC-map volume is 9.2 % for HUGE and 15.7 % for MLAA, which were the maximal values in this patient cohort. The increase in activity due to improved AC highly correlates with the increase in AC-map volume. The higher the gain in AC-map volume, the higher is the gain in activity due to improved AC. Different artifacts were observed in the resulting AC maps (Fig. 3). In 3/32 patients metal artifacts in Dixon-VIBE AC-map lead to misclassification of surrounding tissue as “air”. In 3/32 AC-maps no bone was segmented. In 4/32 patients the bone segmentation mismatches the anatomy. In 1/32 patient missing arm segmentation in HUGE imaging occurred; and in all 32/32 patients systematic overestimation of AC-map volume in all MLAA AC-maps was observed. The AC-map volume around the arms exceeds the true contours of the patient when using MLAA. Quantitative impact of artifacts showed regional differences up to 6 % within single segments of the myocardium (Fig. 4).Discussion and Conclusion:
Improved AC including bone segmentation and truncation correction in cardiac PET/MR imaging is important to ensure best possible diagnostic quality and PET quantification. The HUGE method for truncation correction combined with bone segmentation result in a homogeneous gain of PET signal across the myocardium. The majority of observed AC-map artifacts did not significantly affect the quantitative assessment of the myocardium. Improved AC methods may have clinical impact in cardiac PET/MR studies where quantitative accuracy is most important, e.g. cardiac perfusion imaging [7, 8].Acknowledgements
No acknowledgement found.References
[1] Quick HH. Systems, Physics, and Instrumentation of PET/MRI for Cardiovascular Studies. Curr Cardiovasc Imaging Rep 2017;10:17.doi.org/10.1007/s12410-017-9414-4.
[2] Lindemann ME, Oehmigen M, Blumhagen JO, et al. MR-based truncation and attenuation correction in integrated PET/MR hybrid imaging using HUGE with continuous table motion. Med Phys 2017;44(9):4559-4572.
[3] Paulus DH, Quick HH, Geppert C, et al. Whole-body PET/MR imaging: quantitative evaluation of a novel model-basedMR attenuation correction method including bone. J Nucl Med. 2015;56:1061–1066.
[4] Oehmigen M, Lindemann ME, Gratz M, et al. Impact of improved attenuation correction featuring a bone atlas and truncation correction on PET quantification in whole-body PET/MR. Eur J Nucl Med Mol Imaging. 2017;9.doi:10.1007/s00259-017-3864-4.
[5] Cerqueira MD, Weissman NJ, Dilsizian V, et al. Standardized Myocardial Segmentation and Nomenclature for Tomographic Imaging of the Heart. American Heart Association, Circulation 2002;105:539-542.
[6] Lassen ML, Rasul S, Beitzke D, et al. Assessment of attenuation correction for myocardial PET imaging using combined PET/MRI. J Nucl Cardiol 2017; Nov 22. doi:10.1007/s12350-017-1118-2.
[7] Schindler TH. Myocardial blood flow: Putting it into clinical perspective. J Nucl Cardiol. 2016;23(5):1056-1071.
[8] Rischpler C, Park MJ, Fung GS, et al. Advances in PET myocardial perfusion imaging: F-18 labeled tracers. Ann Nucl Med. 2012;26(1):1-6.
Figures