4325
Research Polarizer Quality Control Metrics and Resulting SNR in Human Prostate Cancer Patients1Radiology and Biomedical Imaging, University of California at San Francisco, San Francisco, CA, United States, 2The Graduate Group in Bioengineering, University of California at Berkeley and San Francisco, San Francisco, CA, United States, 3Department of Urology, University of California at San Francisco, San Francisco, CA, United States, 4Department of Pathology, University of California at San Francisco, San Francisco, CA, United States
Synopsis
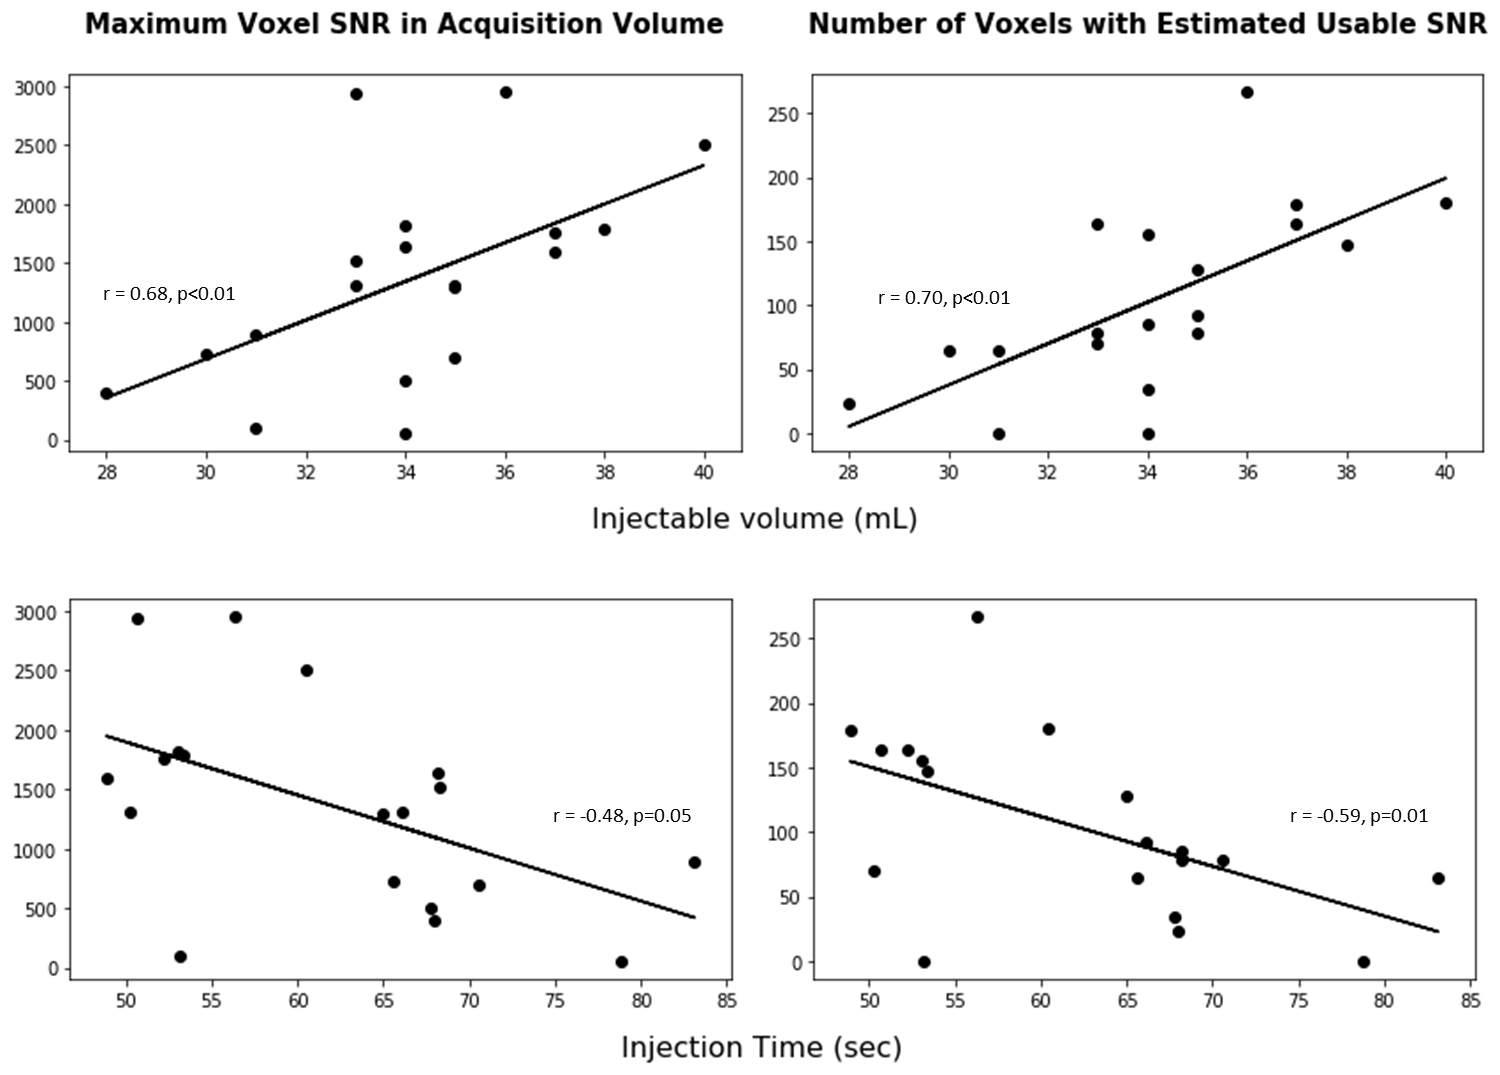
The number of sites performing hyperpolarized [1-13C]pyruvate human studies is increasing every year. We relate metrics used in quality control (QC) of a polarized sample to traditional metrics of signal quality in vivo in 24 hyperpolarized human prostate exams. The QC metrics of injected volume and injection time are significantly correlated with the maximum [1-13C]pyruvate SNR in vivo (r=0.68, p<0.01; r=-0.48,p=0.05, respectively) and the number of voxels with estimated usable SNR (r=0.70, p<0.01; r=-0.59, p=0.01, respectively). These metrics have improved over the course of this trial with team coordination and can be improved at other sites beginning hyperpolarized human research.
Introduction
The prevalence of hyperpolarized (HP) MR to probe tissue metabolism in human patients is increasing each year: 20+ sites around the world have polarizers capable of producing clinical research doses, and 8 sites have performed HP [1-13C]pyruvate human studies. Previous work has shown the importance of the signal-to-noise ratio (SNR) for kinetic modeling in HP studies1, particularly in the prostate where the resulting metabolites are near undetectable levels in healthy tissue2. The purpose of this work is to relate metrics used in quality control (QC) of a polarized sample to traditional metrics of signal quality in vivo.Methods
24 HP prostate exams were completed at our institution over an 18-month period. Samples were polarized in a 5T SPINlab polarizer (GE Healthcare) using dissolution dynamic nuclear polarization for at least two hours, followed by QC and a sterile filter integrity test before release by the pharmacist. HP [1-13C]pyruvate was injected at a dose of 0.43 mL/kg unless limited by available volume. A 3D echo-planar spectroscopic imaging sequence with compressed sensing reconstruction (FOV=96x96x128mm, TR/TE=150/4.0ms, multiband variable flip angle scheme, spatial resolution=8x8x8mm3, temporal resolution=2seconds) was acquired using a dual-tuned endorectal coil for reception and a 13C clamshell coil for excitation, resulting in a 12x12x16 acquisition volume with 21 timepoints over 42 seconds. QC parameters were logged in accordance with this early phase clinical trial research. A cohesive metric of hyperpolarized signal available at injection was created from QC metrics, assuming T1,pyruvate = 60 s.
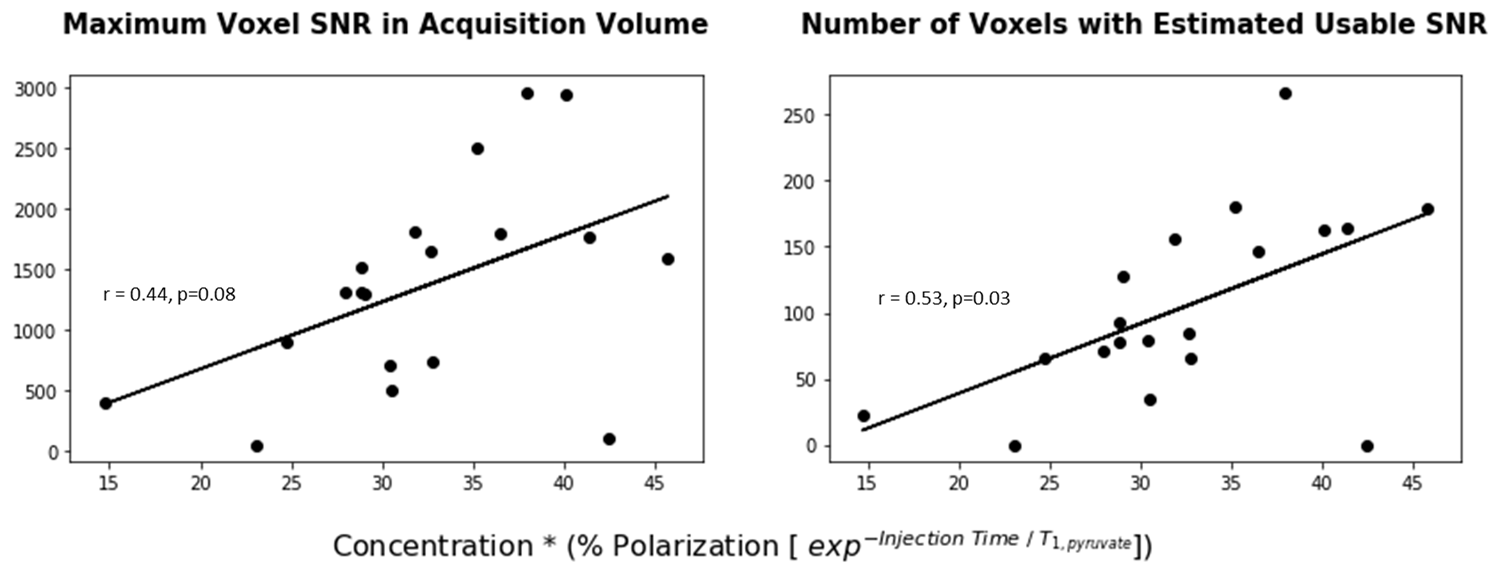
$$Injectable\ Signal = Pyruvate\ Concentration * (\% Polarization\ (exp^{[\ -Injection\ Time / T_{1, pyruvate}]}) ) \qquad Eqn. 1$$
The total area under the curve (AUC) of [1-13C]pyruvate in each voxel was summed from integrated areas of phased spectra at each timepoint. Noise was calculated as the AUC of pyruvate in the first timepoint in each voxel in the next-to-edge slices of the acquisition volume. The maximum SNR was defined as the highest summed pyruvate AUC in a voxel over all timepoints divided by the standard deviation of the noise. The maximum SNR, as well as the number of voxels with an estimated usable SNR (an SNR of at least 10 times the number of timepoints), were recorded as metrics of in vivo signal quality. Exams were divided into ‘initial’ and ‘recent’ phases of this clinical research to estimate expected improvements in signal quality after training and QC pipeline optimization.
Results
The dose was limited in some exams by the available injectable volume. Five cases with an injected dose less than 90% of the desired dose based on patient weight were omitted from these analyses. Both the maximum SNR and the number of voxels with estimated usable SNR were most highly significantly correlated with the injected volume (r=0.68, p<0.01; r=0.70, p<0.01, respectively), and significantly negatively correlated with the time to injection (r=-0.48, p=0.05; r=-0.59, p=0.01 respectively). Neither the polarization level of pyruvate nor the concentration of pyruvate (mM) alone was significantly correlated with either metric of in vivo signal quality. Trends of relevant QC metrics are presented in Figure 1. The injectable signal based on Eqn. 1, shown in Figure 2, was significantly correlated with the number of voxels with estimated usable SNR (r=0.53, p=0.03), and demonstrated a trend of correlation with the maximum SNR (r=0.44, p=0.08).
The injection time, shown in Figure 3, shortened over time due primarily to improved handling experience and parallelizing in the QC pipeline. Comparing 8 typical cases in the ‘initial’ phase and 9 typical cases in the ‘recent’ phase of this trial, we see a reduction in injection time of 13.9 seconds. This predicts a 26% increase in SNR based on Eqn 1, assuming a T1,pyruvate of 60 s. However, we observe an SNR increase of 85% in recent studies, which may be due in part to a shorter T1 at very low fields3.
Discussion and Conclusion
Our most significant finding is that injection time and injected volume are significantly correlated with resulting signal quality in vivo. While some low quality cases can be explained by injecting a smaller volume than the recommended dosage by weight, there are cases with high predicted injectable signal, low injection time, and high injectable volume with low in vivo signal quality. These cases cannot be explained by patient weight, blood pressure, or heart rate, but might be explained by poor shimming or patient movement. Research sites beginning hyperpolarized studies may realize the metrics of injection time and injected volume can be improved upon by a coordinated research team and are not inherently dependent on polarizer performance.Acknowledgements
The authors acknowledge the considerable work of Mary McPolin, Hope Williams, Kimberly Okamoto, Jennifer Chow, Lucas Carvajal, Kim Semien, Jenny Che, and Ana Marie Deluca.References
[1] Mammoli, et. al. #3564 Proc 26th ISMRM
[2] Korn, et. al. #6730 Proc 26th ISMRM
[3] Chattergoon, et. al. Contrast Media Mol. Imaging 2013
Figures