4315
Hyperpolarized 5-13C-Glutamate metabolism as a biomarker of IDH1 mutant glioma response to temozolomide therapyElavarasan Subramani1, Chloe Najac1, Georgios Batsios1, Pavithra Viswanath1, Marina Radoul1, Anne Marie Gillespie1, Russell O Pieper2,3, and Sabrina M Ronen1,3
1Department of Radiology and Biomedical Imaging, University of California San Francisco, San Francisco, CA, United States, 2Department of Neurological Surgery, Helen Diller Research Center, University of California San Francisco, San Francisco, CA, United States, 3Brain Tumor Research Center, University of California San Francisco, San Francisco, CA, United States
Synopsis
The alkylating agent temozolomide (TMZ), previously used only in the treatment of high-grade glioblastoma, is now being considered for the treatment of low-grade glioma that are driven by mutations in the cytosolic isocitrate dehydrogenase 1 (IDH1) gene. However, early detection of response remains a challenge. 1H and hyperpolarized 13C magnetic resonance spectroscopy-based metabolic profiling of cells genetically engineered to express mutant IDH1 and treated with TMZ showed significant alterations in metabolites majorly related to the tricarboxylic acid cycle, and identified hyperpolarized 5-13C-glutamate metabolism as an indicator of response. These findings hold potential for assessing response of IDH1 mutant cells to TMZ therapy.
Introduction
Gliomas are the most common type of brain tumor in adults, representing 80% of primary malignant tumors. Mutations in the cytosolic isocitrate dehydrogenase 1 (IDH1) enzyme, which are present in up to 90% of primarily low-grade gliomas, lead to a neomorphic activity of the enzyme that results in conversion of α-ketoglutarate to the oncometabolite 2-hydroxyglutarate (2-HG).1,2 Mutant IDH1 tumors are less aggressive than primary glioblastoma (GBM), but nonetheless always recur and ultimately lead to patient death. To improve patient survival, one therapeutic strategy is treatment with the alkylating chemotherapeutic agent Temozolomide (TMZ), previously reserved for the treatment of primary GBM.3 Though the treatment of IDH1 mutant patients with TMZ improves survival,4,5 current imaging approaches cannot identify early response to treatment. The goal of this study was, therefore, to determine the value of magnetic resonance spectroscopy (MRS)-detectable metabolic alterations as indicators of response to treatment. To this end, we investigated a genetically engineered mutant IDH1 immortalized Normal Human Astrocyte (NHA)-based cell model, and assessed the effects of TMZ on the cellular metabolic profile (1H MRS combined with chemometrics) and on specific metabolic pathways (hyperpolarized and thermal equilibrium 13C MRS).Methods
NHAs were genetically engineered to express mutant IDH1 (NHAIDHmut) and maintained in culture as previously described.6,7 Cells were labelled with [1-13C]-glucose and [3-13C]-glutamine and treated either with the IC50 value of TMZ (100 μM; N=5), or DMSO (1%; N=5) for 72 hours. 1H-MRS (1D water presaturation ZGPR sequence, 90° FA, 3s TR, 256 acquisitions) and proton-decoupled 13C-MRS (30° FA, 3s TR, 2048 acquisitions) spectra of extracted metabolites were acquired using a 500 MHz Bruker Avance spectrometer. 1H MRS data was analyzed using SIMCA,8 first using a multivariate principal component analysis (PCA), followed by partial least squares discriminant analysis (PLS-DA). Correlation values were used to identify metabolites altered with treatment. 1H and 13C MRS peaks were manually integrated and quantified using Mnova7, integrals normalized to TSP and to cell number and statistical significance of differences determined using unpaired Student’s t-test (Graphpad). Pathway enrichment and topology analysis of dysregulated metabolites was performed using MetPA.9 For hyperpolarized 13C-MRS studies, NHAIDHmut cells were encapsulated in agarose and MRS studies performed in MR compatible cell perfusion system.9 Live cells were exposed to hyperpolarized 2-13C-pyruvate and dynamic sets of 13C-MRS spectra recorded using 5° FA and 3s TR over 300s to monitor the production of hyperpolarized 5-13C-glutamate. Hyperpolarized glutamate signal was then quantified using Mnova7 and normalized to pyruvate signal and cell number.Results and Discussion
As expected, treatment of NHAIDHmut cells with the IC50 of TMZ resulted in a 47.73±3.99% reduction in cell number. When inspecting the 1H MRS spectra of control and treated cells, twenty-nine metabolites could be identified using Human Metabolome DataBase and literature values. First, 1H spectra of both groups were subjected to PCA to visualize the inherent clustering of groups. The PCA score plot showed separation of TMZ-treated from DMSO-treated control cells (Fig.1A). Further, improved separation between the groups was obtained by PLS-DA (Fig.1B) and OPLS-DA (Fig.1C). Most significant metabolites contributing to class separation were identified using correlation ≥0.6 (Fig.2A). A univariate analysis was then applied to the integral values of the metabolites identified in this manner. Several metabolites were altered, most notably an increase in glutamate and 2-HG were observed following treatment (Fig.2B). Pathway enrichment and topology analysis of these metabolites showed 41 altered pathways in TMZ- treated cells. Based on their significance and impact score, tricarboxylic acid (TCA) cycle and pyruvate metabolism were identified as the most significant pathways altered following treatment (Fig.3). To further assess whether the increase in glutamate and 2-HG could be explained by an increase in TCA cycle flux, synthesis of glutamate and 2-HG from 1-13C-glucose, as well as from 3-13C-glutamine were probed. Consistent with the increase in total metabolite levels, both glucose- and glutamine-derived glutamate (Fig.4A) and 2-HG (Fig.4B) were increased in TMZ treated cells compared to controls, together explaining the increase in total pools. Furthermore, dynamically probing the metabolism of hyperpolarized 2-13C-pyruvate revealed that build-up of 5-13C-glutamate, which is associated with flux to the TCA cycle, was significantly higher in TMZ-treated cells as compared to controls (Fig.5).Conclusion
Our findings demonstrate that 1H MRS-detectable metabolomics combined with hyperpolarized 5-13C-glutamate have the potential to serve as biomarkers of low-grade glioma response to TMZ therapy. Further studies are needed to confirm the generality of our findings in other mutant IDH1 models. Nonetheless, these findings may help in enhancing currently available imaging methods to improve the early detection of response to TMZ in low grade glioma.Acknowledgements
This work is supported by NIH R01CA197254 and NIH center grant P41EB013598.References
- Yan H, Parsons DW, Jin G, et al. IDH1and IDH2Mutations in Gliomas. New Engl J Med. 2009;360:765-773.
- Dang L, White DW, Gross S, et al. Cancer-associated IDH1 mutations produce 2-hydroxyglutarate. Nature. 2009;462:739-744.
- Park I, Mukherjee J, Ito M, et al. Changes in pyruvate metabolism detected by magnetic resonance imaging are linked to DNA damage and serve as a sensor of temozolomide response in glioblastoma cells. Cancer Res. 2014;74(23):7115-7124.
- Cairncross JG, Wang M, Jenkins RB, et al. Benefit from procarbazine, lomustine, and vincristine in oligodendroglial tumors is associated with mutation of IDH. J Clin Oncol. 2014;32:783-790.
- Buckner JC, Shaw EG, Pugh SL, et al. Radiation plus procarbazine, CCNU, and vincristine in low-grade glioma. N Engl J Med. 2016;374:1344-1355.
- Sonoda Y, Ozawa T, Hirose Y, et al. Formation of intracranial tumors by genetically modified human astrocytes defines four pathways critical in the development of human anaplastic astrocytoma. Cancer Res. 2001;61:4956-4960.
- Chaumeil MM, Larson PEZ, Yoshihara HAI, et al. Non-invasive in vivo assessment of IDH1 mutational status in glioma. Nat Commun. 2013;4:2429.
- Subramani E, Rameshbabu AP, Jothiramajayam M, et al. Mycobacterial heat shock protein 65 mediated metabolic shift in decidualization of human endometrial stromal cells. Sci Rep. 2017;7(1):3942.
- Izquierdo-Garcia JL, Viswanath P, Eriksson P, et al. IDH1 Mutation Induces Reprogramming of Pyruvate Metabolism. Cancer Res. 2015;75(15):2999-3009.
Figures
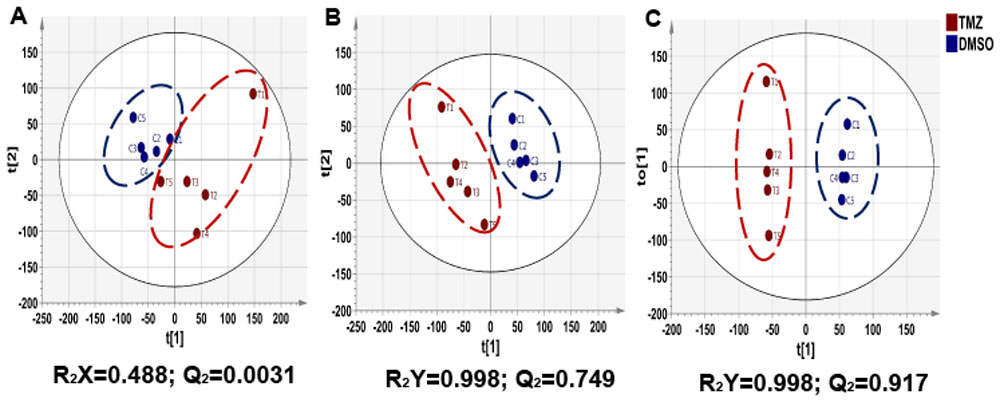
Figure 1: Two-dimensional scatter score plot
of (A) PCA, (B) PLS-DA and (C) OPLS-DA showing good discrimination between
NHAIDHmut control and TMZ-treated cells.
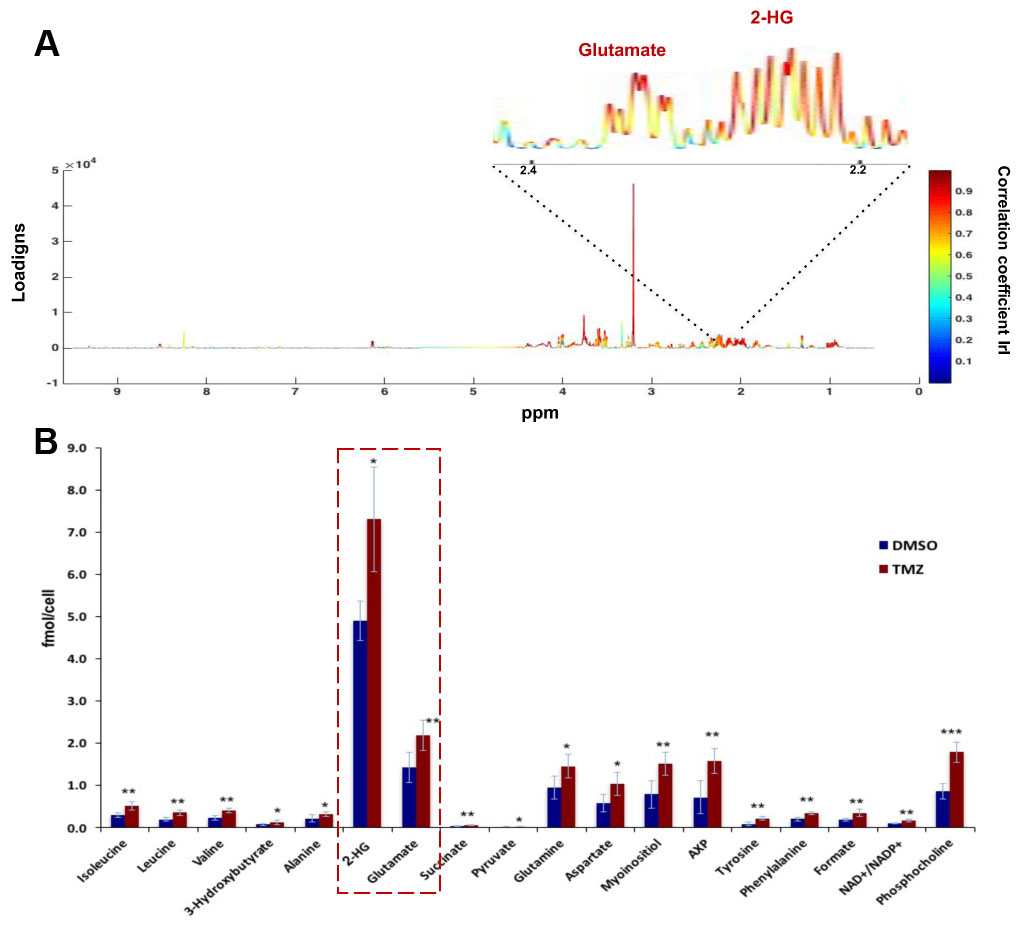
Figure 2: (A) Color map representing S-line plot identifies
metabolites with correlation coefficient value >0.6 responsible for
discriminating TMZ-treated and control cells. (B) Quantification of 1H MRS-detected
metabolites identified from the S-line plot. *p<0.05; **p<0.01;
***p<0.001.
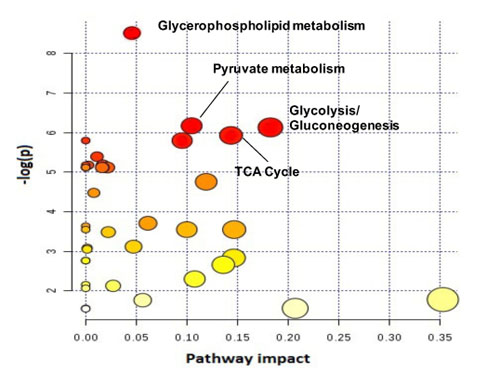
Figure 3: Metabolic pathway and topology
analysis showing the main pathways altered in TMZ-treated NHAIDHmut cells. Node
size indicates the degree of importance i.e. pathway impact score. Color
indicates the level of significance. Large red node represents the highest
level of changes in TMZ treated cells. Orange, yellow and white nodes are
indicating moderate, slight and zero importance pathways, respectively. The
most important pathways with statistical significance are indicated.
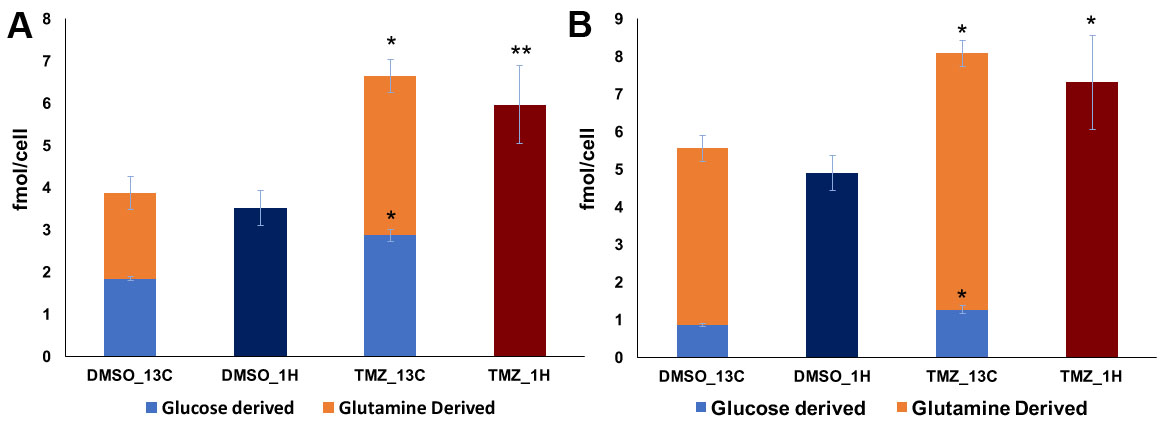
Figure 4: [1-13C]-Glucose and [3-13C]-Glutamine
derived glutamate (A) and 2-HG (B) production in NHAIDHmut cells treated with
either TMZ or DMSO.
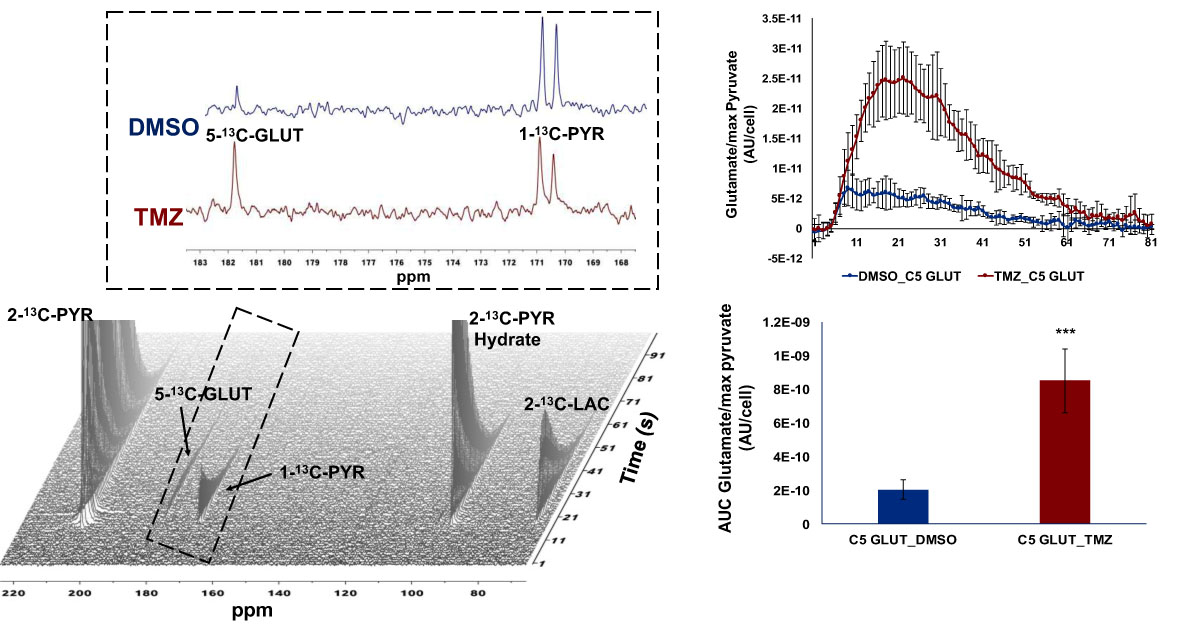
Figure 5: Dynamic 13C-MRS array
showing metabolism of hyperpolarized 2-13C-pyruvate to 5-13C-glutamate
in NHAIDHmut model treated with TMZ or DMSO for 72h. Inserts explain the sum of
all spectra within dotted region of the array. 2-13C-PYR: 2-13C
pyruvate, 2-13C-PYR Hydrate: 2-13C-pyruvate hydrate, 1-13C-PYR:
1-13C-pyruvate, 5-13C-GLUT: 5-13C-glutamate.
***p<0.0001