4314
Hyperpolarized 13C MRI Cellular Transport Modeling1School of Biomedical Engineering, Shanghai Jiao Tong University, Shanghai, China, 2Department of Radiology and Biomedical Imaging, University of California, San Francisco, San Francisco, CA, United States
Synopsis
Hyperpolarized (HP) 13C MRI is very appealing due to its potential in imaging the dynamic metabolic conversion and transport process. In this work, we tried to model the cellular transport process for dynamic HP 13C studies. Two highlights in this work are, (1) separating intra- and extracellular HP [1-13C] lactate based on dynamic HP 13C diffusion weighted imaging (DWI) technique, (2) extending standard kpl model to quantify cellular transport, with applications to cancer cell studies and cancer mouse studies.
Introduction
Hyperpolarized(HP) 13C MRI has shown potential to non-invasively image cancer, most commonly through imaging the metabolic conversion of [1-13C]pyruvate to [1-13C]lactate. In addition, HP 13C MRI can also measure the lactate efflux from the intra- to extracellular environment via diffusion weighted imaging(DWI) related techniques1. As HP [1-13C] lactate efflux is a dynamic process, dynamic DWI would better describe the process compared to single time point DWI. Recently, we developed a slice-selective double spin echo sequence(ss-DSE)2, and optimized it for the preclinical studies. According to the result, the apparent diffusion coefficients(ADC) in the tumor increased over time, which indicates the lactate efflux process.2
To quantitatively characterize the dynamic process, we firstly tried to separate intra- and extracellular lactate components via biexponential model fitting3-5. Then, we extended the standard kpl model6,7 to include lactate compartmentalization and efflux processes in order to estimate the lactate transport rate from the intra- to extracellular environment (kinex) in both renal cancer cell culture and transgenic adenocarcinoma of the mouse prostate(TRAMP) model.
Methods
HP 13C Dynamic DWI Data Acquisition
The dynamic DWI used ss-DSE sequence2, with a single metabolite and single b-value DWI image acquired in each TR. 6~8 time points images with ~3s interval were repeatedly acquired to cover 20~30s dynamic range. At each time, one low b-value (50s/mm2) pyruvate, and three b-values (50, 500, 1000s/mm2) lactate DWI images were acquired.
Modeling of Compartmentalization
Two widely-used models for ADC estimation, mono-exponential and bi-exponential model3-5, were used for modeling lactate compartmentalization:
$$S(b)=S_{average}*\exp{(-b*ADC_{average})}$$
$$S(b)=S_{in}*\exp{(-b*ADC_{in})}+S_{out}*\exp{(-b*ADC_{out})}$$
where b represents b-value, S(b) is the acquired lactate signal, ADCi (i=average/in/out) is the average, intra- and extracellular lactate ADC, and Si (i=average/in/out) is the average, intra- and extracellular lactate signal respectively.
HP 13C Cell Culture MRS Studies
For in vitro studies, data were acquired by using a 3D cell/tissue culture bioreactor compatible with HP 13C MR8 and measuring HP 13C lactate efflux in human renal cell carcinoma(RCC) cells from UOK262 cell line8. The compartmentalization of intra- and extracellular HP 13C lactate signals was resolved in dynamic 13C spectra of the cell line due to a chemical shift difference and the observation of a splitting of the lactate peak.8
Lactate Efflux Process Modeling
The biological processes in the tumor cells and the general form of the governing equation of kinex fitting for both cell and mice were shown in Figure 1. For RCC cell culture studies, pyruvate and lactate T1 were constrained within typical boundaries. The input function was modeled as a gamma function whose parameters were determined by extra studies. For TRAMP studies, the pyruvate component was ignored in the governing equation. The low b-value pyruvate images were used for calculating lactate generation function, assuming the pyruvate all converted to the intracellular lactate. Lactate T1 was fixed as 25s. Both models then were solved by constrained least-square fitting via CVX toolbox9.
Results and Discussion
Modeling of Compartmentalization for Dynamic DWI
The comparison of the two models was shown in Figure 2, taking the normalized Sin=0.3 as an example. According to the results, the bi-exponential model induced less bias compared to the mono-exponential model. Therefore, the bi-exponential model was selected to separate intra- and extracellular HP 13C lactate based on dynamic DWI images.
Lactate Efflux Process Modeling
RCC Cell Culture Study
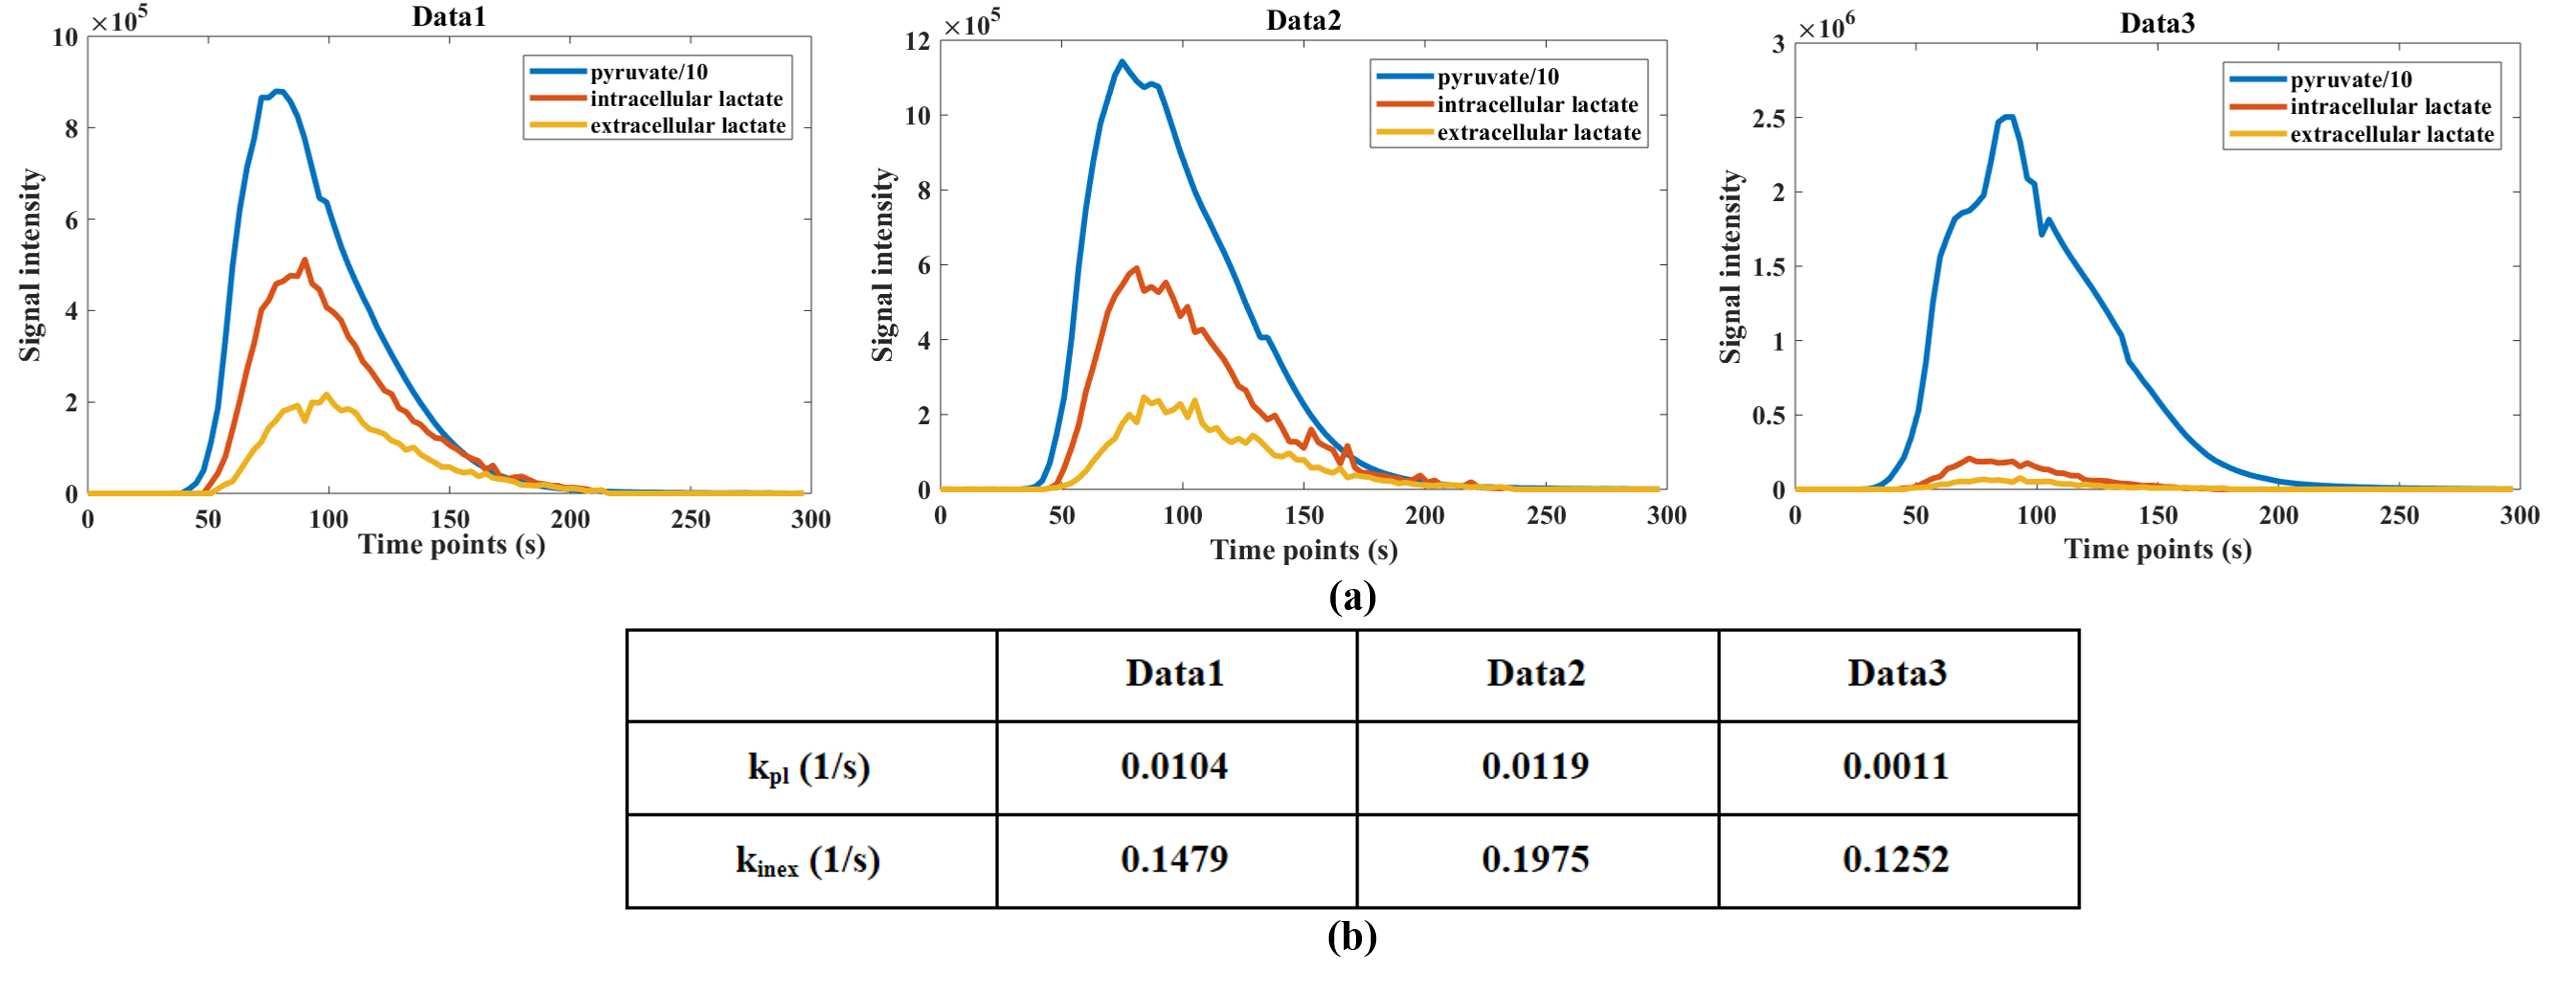
The pyruvate, intra- and extracellular lactate signals detected by 3 datasets of the cell culture study (UOK262 cell line) were shown in Figure 3(a). The fitting results for kpl and kinex were shown in Figure 3(b). Three different datasets showed a relatively consistent results on kinex estimation.
TRAMP Mice Study
ROI Fitting:
The tumor was first treated as a single ROI for compartmentalization and fitting. The acquired and fitting signals from one of the TRAMP dynamic data were plotted in Figure 4(a). The fitting results for kinex were shown in Figure 4(b). The results suggested the kinex values were consistent with the previous cell culture data modeling.
Pixel-by-pixel Fitting:
The pixel-by-pixel fitting could give us dynamic Sin, Sout and kinex mapping, shown in Figure 5. The dynamic change showed Sin decreases and Sout increases over time and indicated that kinex has the potential to serve as a biomarker for measurements of cellular transport for prostate tumor.
Conclusions
In this work, we proposed the HP 13C MR cellular transport modeling framework for quantification of metabolic conversion and transport. The biexponential model induced less bias to describe the compartmentalization of HP 13C intra- and extracellular lactate signals. We also built up the mathematical model to quantify the lactate transport rate, then applied to both tumor cell culture and TRAMP studies.Acknowledgements
The authors would like to acknowledge Subramaniam Sukumar, Ph.D., Zihan Zhu, and Shuyu Tang for help with the hyperpolarized experiments. The work is supported by NIH grants R01EB016741, R01EB017449, R01EB013427, R01CA166655, and P41EB013598; and American Cancer Society Research Scholar Grant 1 31715‐RSG‐18‐005‐01‐CCE.References
1. Haider MA, Van Der Kwast TH, Tanguay J, et al. Combined T2-weighted and diffusion weighted MRI for localization of prostate cancer. Am J Roentgenol. 2007;189(2):323-328.
2. Zhu X, Gordon JW, Bok RA, Kurhanewicz J, Larson PE. Dynamic diffusion-weighted hyperpolarized 13C imaging based on a slice-selective double spin echo sequence for measurements of cellular transport. Magnetic Resonance in Medicine. 2018. doi:10.1002/mrm.27501.
3. Koelsch BL, Sriram R, Keshari KR, Swisher CL, Criekinge MV, Sukumar S, et al. Separation of extra- and intracellular metabolites using hyperpolarized 13C diffusion weighted MR. Journal of Magnetic Resonance. 2016;270:115–23.
4. Inglis B, Bossart E, Buckley D, Wirth E, Mareci T. Visualization of neural tissue water compartments using biexponential diffusion tensor MRI. Magnetic Resonance in Medicine. 2001;45(4):580–7.
5. Wittsack H-J, Lanzman RS, Mathys C, Janssen H, Mödder U, Blondin D. Statistical evaluation of diffusion-weighted imaging of the human kidney. Magnetic Resonance in Medicine. 2010. doi:10.1002/mrm.22436.
6. Zierhut ML, Yen Y-F, Chen AP, Bok R, Albers MJ, Zhang V, et al. Kinetic modeling of hyperpolarized 13C1-pyruvate metabolism in normal rats and TRAMP mice. Journal of Magnetic Resonance. 2010;202(1):85–92.
7. Chen H-Y, Larson PE, Bok RA, Morze CV, Sriram R, Santos RD, et al. Assessing Prostate Cancer Aggressiveness with Hyperpolarized Dual-Agent 3D Dynamic Imaging of Metabolism and Perfusion. Cancer Research. 2017;77(12):3207–16.
8. Sriram R, Criekinge MV, Hansen A, Wang ZJ, Vigneron DB, Wilson DM, et al. Real-time measurement of hyperpolarized lactate production and efflux as a biomarker of tumor aggressiveness in an MR compatible 3D cell culture bioreactor. NMR in Biomedicine. 2015; 28: 1141–9.
9. CVX Research, Inc. CVX: Matlab software for disciplined convex programming, version 2.1. Dec 2017. http://cvxr.com/cvx. Accessed November 05, 2018.
Figures

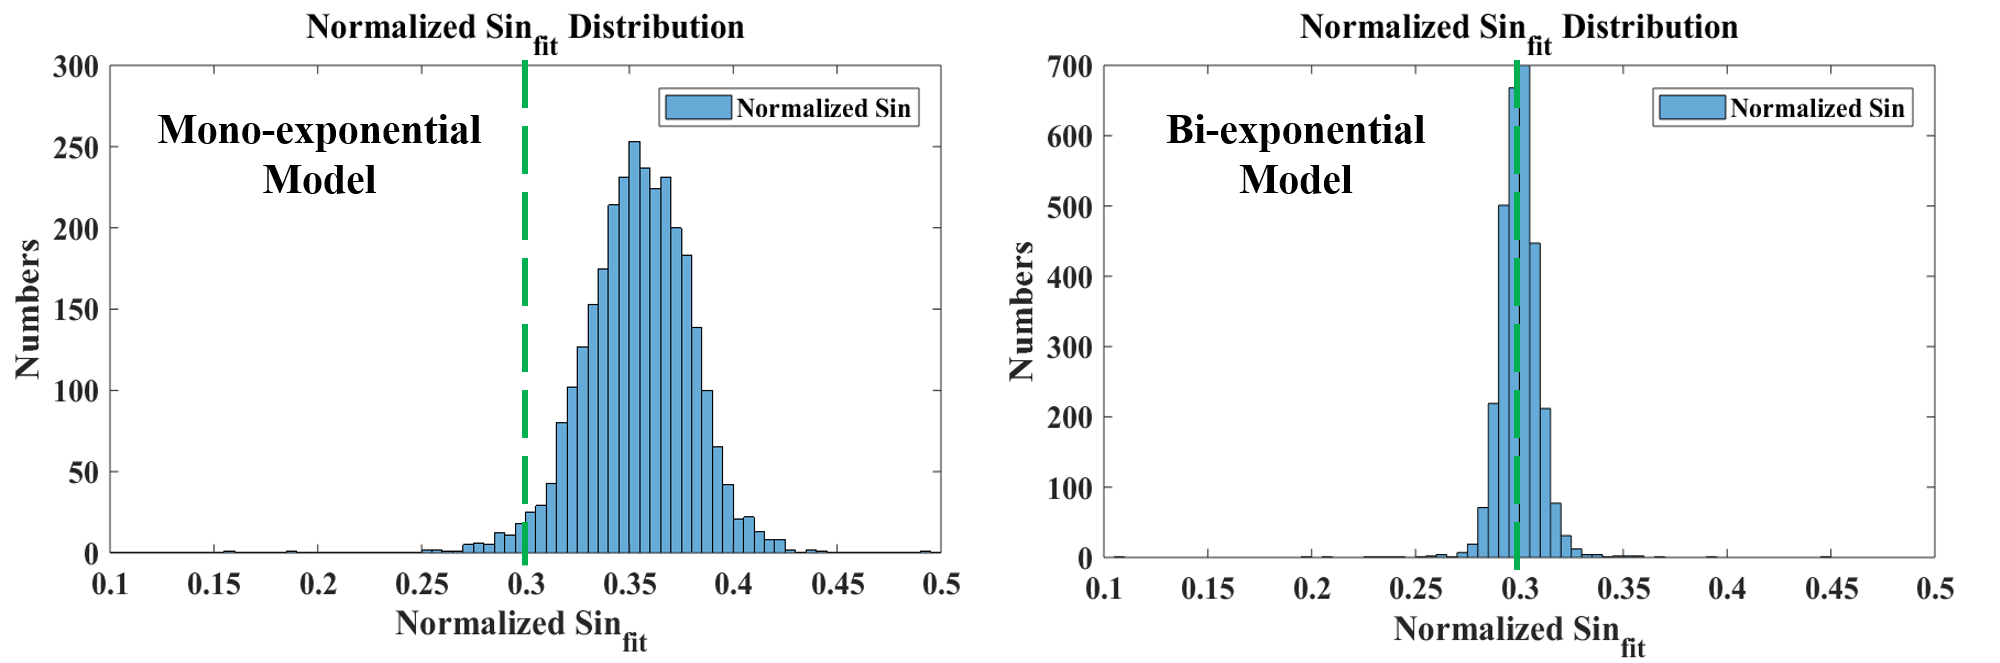
Figure 2: Comparison of mono-exponential model and biexponential model in bias tolerance for compartmentalization of HP 13C lactate via simulation study. The Green dotted line is the ground truth = normalized Sin = 0.3. Compared to the mono-exponential model, the biexponential model induced less bias in response to Gaussian noise, and thus was selected to separate intra- and extracellular HP 13C lactate for dynamic DWI.