4311
Feasibility and Reproducibility of Imaging Brain Metabolism Using Hyperpolarized 13C Pyruvate in Humans1Advanced Imaging Research Center, University of Texas Southwestern Medical Center, Dallas, TX, United States, 2Radiology, University of Texas Southwestern Medical Center, Dallas, TX, United States, 3Electrical and Computer Engineering, University of Texas Dallas, Richardson, TX, United States, 4GE Healthcare, Dallas, TX, United States, 5University of Texas Southwestern Medical Center, Dallas, TX, United States, 6University of Maryland, Baltimore, Baltimore, MD, United States, 7Clinical MR Solutions, Brookfield, WI, United States, 8Neurosurgery, University of Texas Southwestern Medical Center, Dallas, TX, United States, 9Internal Medicine, University of Texas Southwestern Medical Center, Dallas, TX, United States
Synopsis
Human brain metabolism was investigated using hyperpolarized [1-13C]pyruvate and [2-13C]pyruvate in vivo. Each subject received hyperpolarized pyruvate intravenously with a 45-min interval between the injections. [1-13C]lactate and [13C]HCO3– were consistently detected from hyperpolarized [1-13C]pyruvate. [5-13C]Glutamate was measured from hyperpolarized [2-13C]pyruvate. The levels of production and relative intensities of the 13C-labeled metabolites were reproducible.
Background
Normal brain metabolism has been studied using hyperpolarized [13C]pyruvate in animals. Pyruvate crosses blood brain barrier rapidly, followed by immediate conversion to lactate or acetyl-CoA + CO2. For instance, [1-13C]lactate and [13C]HCO3–, which rapidly equilibrates with [13C]CO2, can be detected in the brain from hyperpolarized [1-13C]pyruvate[1]. When hyperpolarized [2-13C]pyruvate is injected, the labeled carbon follows acetyl-CoA, entering the TCA cycle and creating a large [5-13C]glutamate signal. In particular, the levels of [13C]HCO3– and [5-13C]glutamate production were significantly increased in the brain when pyruvate dehydrogenase kinase (PDK) was inhibited by dichloroacetate[2], [3]. Recent advances in clinical translation of hyperpolarized pyruvate imaging led to successful imaging of human brain metabolism[4]-[7]. However, previous human brain studies focused on imaging altered tumoral lactate production from patients with intracranial malignancies. The imaging conditions (e.g., RF coil) used an inhomogeneous receive profile resulting in compromised sensitivities or homogeneity of [13C]-metabolites. In this study, we evaluated the feasibility of imaging cerebral metabolism using hyperpolarized [13C]pyruvate with a new 1H/13C volume RF coil. Moreover, the repeatability of hyperpolarized [13C]pyruvate in the brain was investigated by performing two injections of hyperpolarized pyruvate.Methods
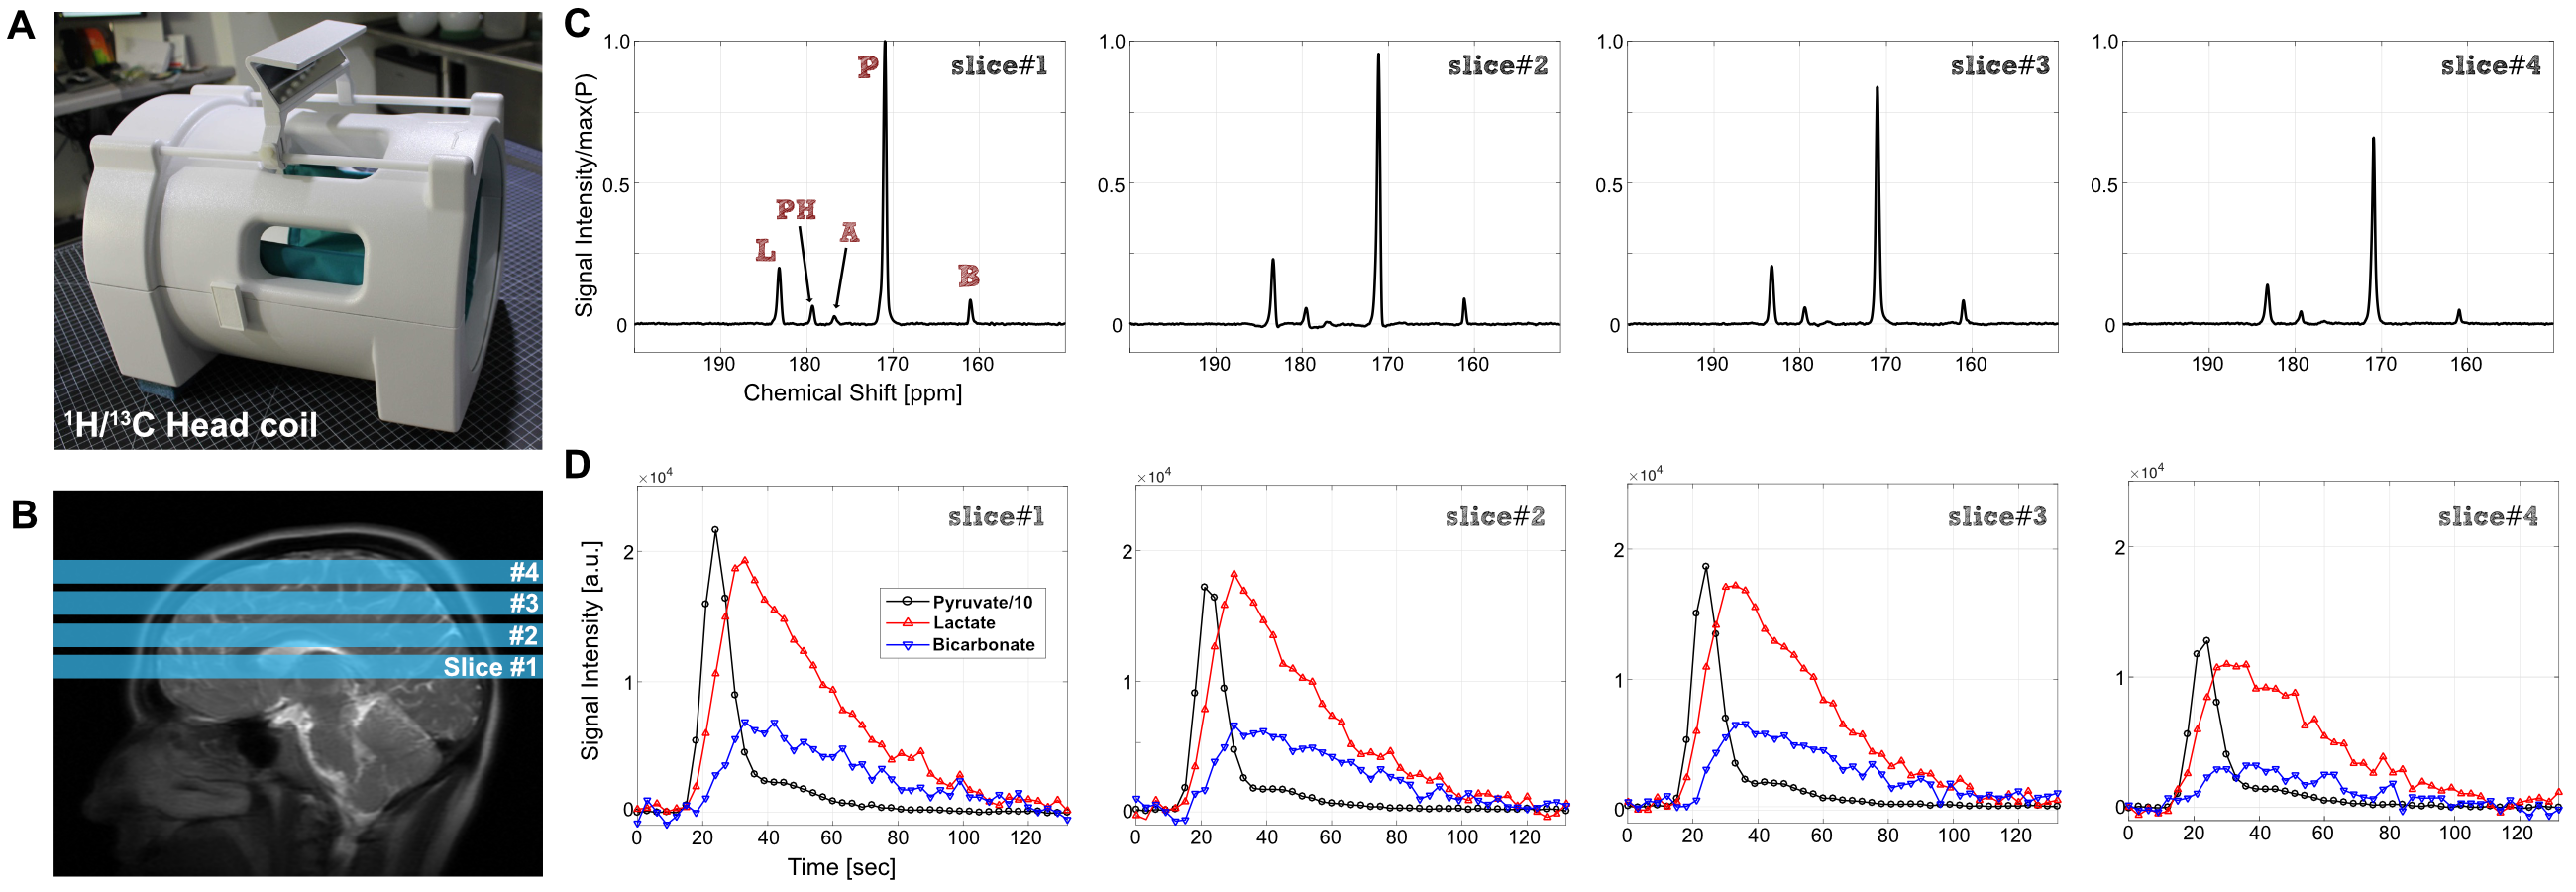
All the studies were performed using a clinical SPINlab polarizer (GE Healthcare), a 3T MR scanner (GE Healthcare, 750w Discovery), and a 13C/1H dual-frequency RF head coil (Clinical MR Solutions, Fig. 1A). Five healthy subjects (age: 25 – 63) were recruited for the study. Each subject was imaged with a brain MR protocol, which includes two injections of hyperpolarized [1-13C] or [2-13C]pyruvate (IND#: 133229, 136798) with at least a 45-min interval between the injections. The first hyperpolarized pyruvate solution was injected after a fast GRE localizer and 2D T2-weighted FLAIR scan. The remaining 1H images (DWI, SWI, T2-weighted FSE) were acquired during the 45-min time interval. 13C imaging with an injection of hyperpolarized pyruvate was either a slice-selective dynamic free-induction decay (FID; 10o flip angle, TR 3s, spectral width = 10,000Hz, spectral points = 4,096, scan time = 4min, slice thickness = 1.5cm, 4 slices) or a 2D dynamic spiral chemical shift imaging (spiral CSI; FOV = 24cm, matrix size = 16x16, slice thickness = 2-3cm, variable flip angle up to 30o each timepoint, TR = 5s, 7 spatial interleaves in spiral readout, spectral width = 814Hz, 48 echoes). The center frequencies were set on [1-13C]pyruvate and [5-13C]glutamate resonances for hyperpolarized [1-13C] and [2-13C]pyruvate scans, respectively. All clinical fluid paths were prepared in a sterile environment and the hyperpolarized pyruvate solutions passed a quality control analysis prior to the injection. For each 13C acquisition, a volume of 250-mM hyperpolarized pyruvate corresponding to a 0.1 mmol/kg dose was injected, followed by a 25-mL saline flush. The 13C data were reconstructed in an absorption mode via the automated reconstruction pipeline. Kinetic analysis was performed using a three-site exchange model. The imaging protocol was approved by the local Institutional Review Board.Results and Discussion
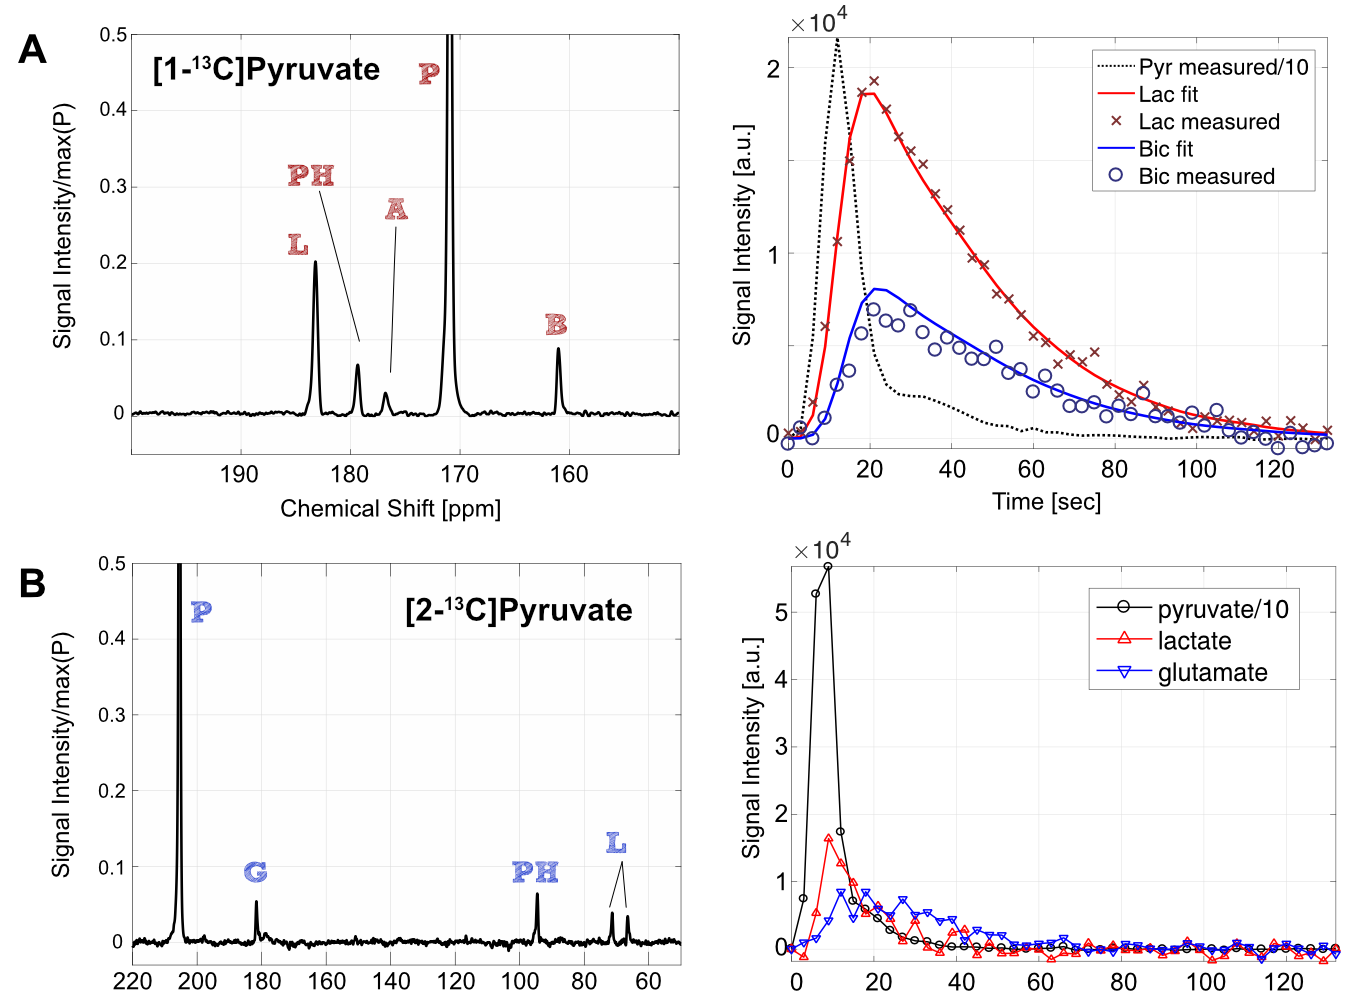
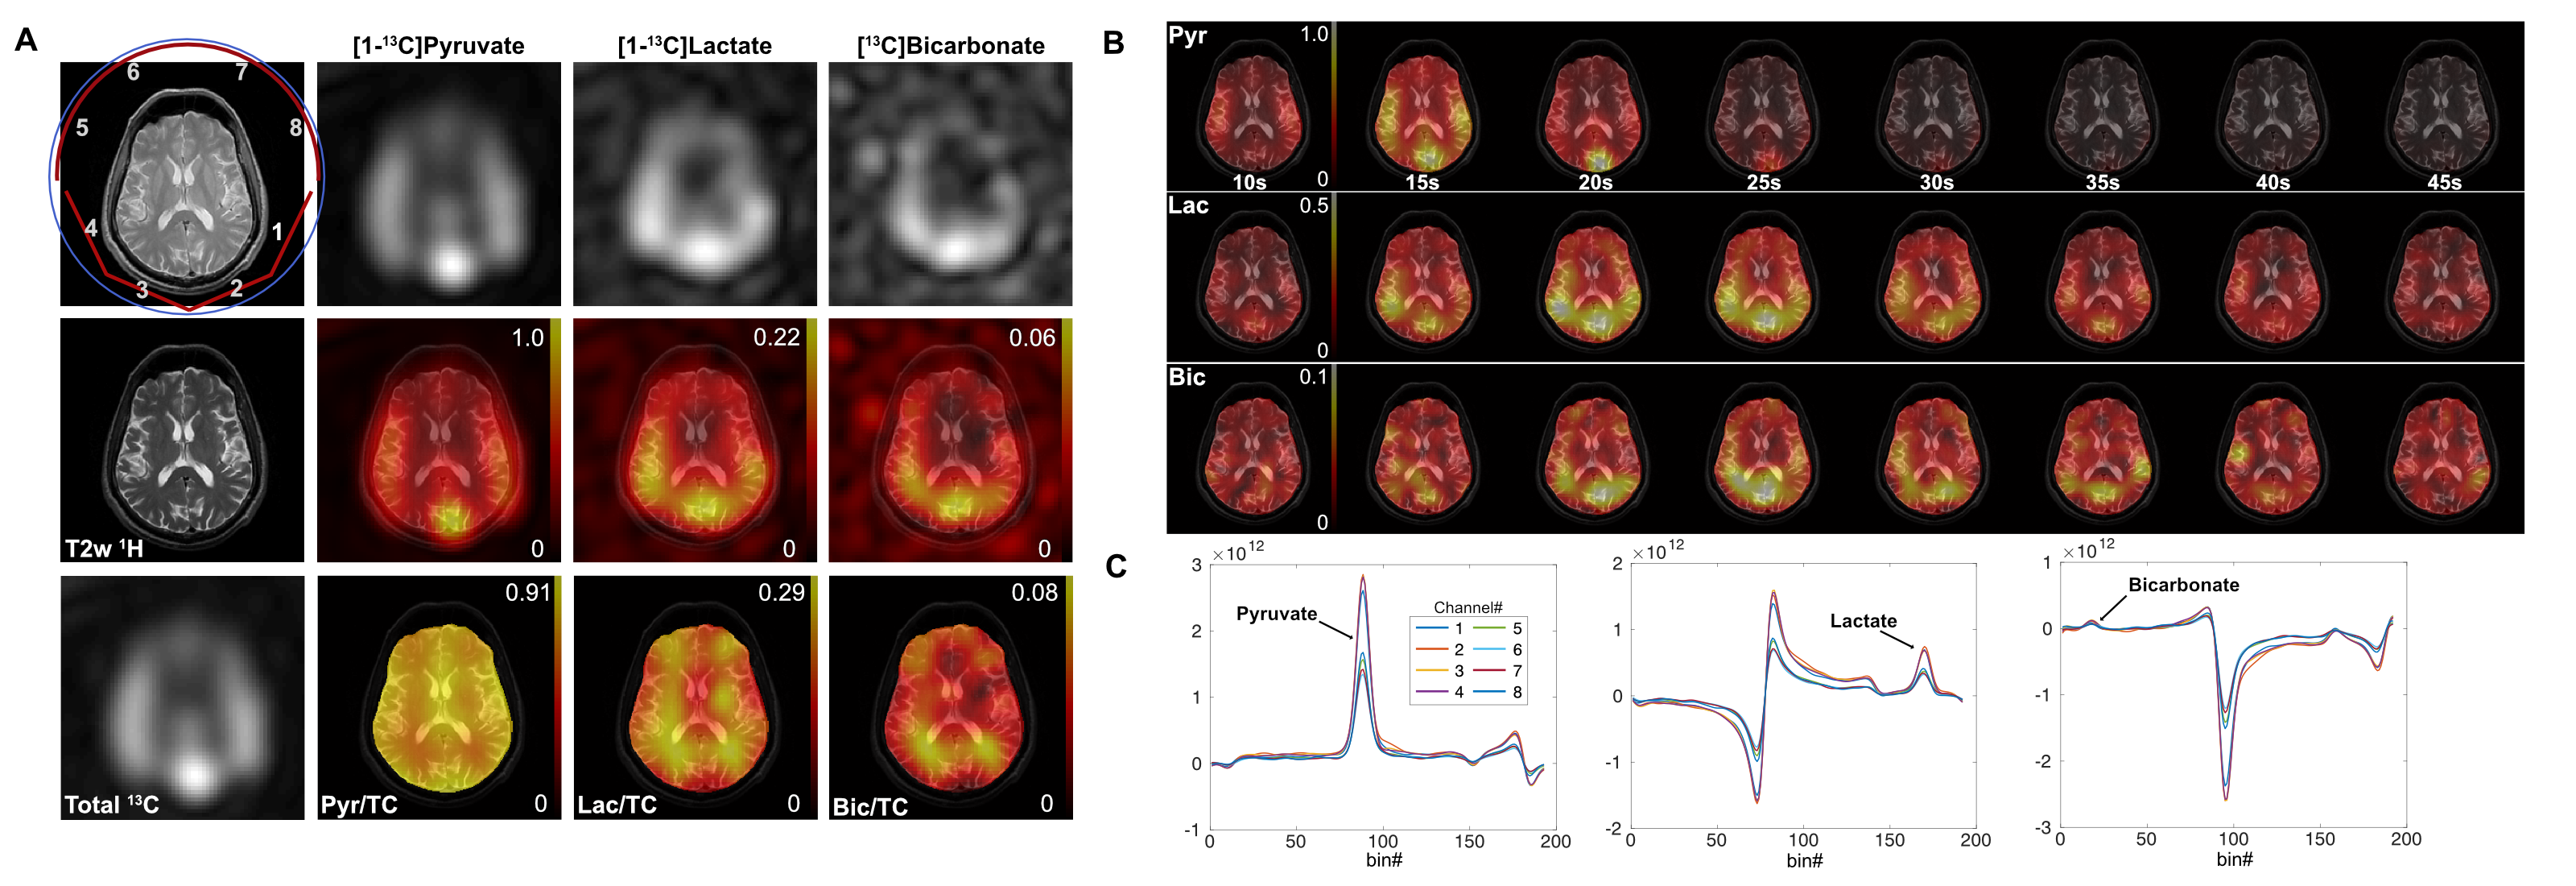
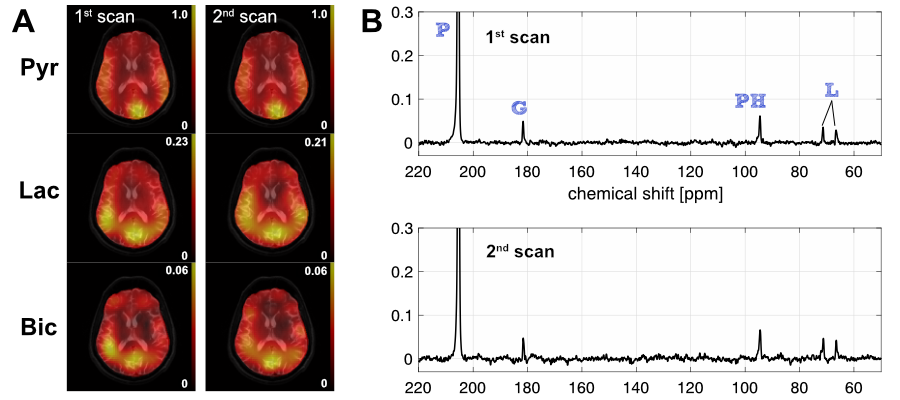
All subjects tolerated the procedure without incident. Figure 1 shows the time-averaged spectra (C) and time-curves (D) of hyperpolarized [1-13C]pyruvate and the products, [1-13C]lactate and [13C]HCO3–, from 4 different brain slice locations (B) from a 25-year old healthy male subject. The area under the curve (AUC) of lactate and HCO3– normalized by the total 13C signals (TC) showed relatively little variability throughout the slices (0.20, 0.21, 0.21, 0.21 for lactate/TC, and 0.082, 0.094, 0.092, 0.062 for HCO3–/TC). Variability was higher for kinetic parameters compared to the normalized AUC. For instance, kPL was calculated as 0.012 and 0.015 s-1 and kPB was calculated as 0.003 and 0.005 s-1 from slice#1 and #2, respectively. Figure 2 compares the spectra and the metabolite time-curves from (A) [1-13C] and (B) [2-13C]pyruvate. SNR, particularly for metabolic products, was significantly compromised when using [2-13C]pyruvate as compared to [1-13C]pyruvate, primarily due to the shorter relaxation times. Figure 2A includes both measured and fitted time-curves by the three-site exchange model. Note that kinetic analysis was not performed for [2-13C]pyruvate due to the large chemical shift displacement artifacts along slice-selective direction for [2-13C]lactate and [2-13C]pyruvate. Figure 3 shows imaging results of hyperpolarized [1-13C]pyruvate from a 63-year old man (top row: 13C images, middle row: 13C images overlaid on 1H image, bottom row: metabolite maps normalized by total 13C map). Although more subjects will need to be tested, both the imaging and the MRS data suggest the reproducibility of hyperpolarized 13C exams within a single imaging session (Fig. 4).Acknowledgements
Personnel Support: We appreciate research nurses and MR technicians - Lucy Christie, Jeannie Baxter, Kelley Durner, Carol Parcel, Maida Tai and Salvador Pena.
Funding: The Mobility Foundation; The Texas Institute of Brain Injury and Repair; National Institutes of Health of the United States (P41 EB015908, S10 OD018468).
References
[1]. D. Mayer, Y.-F. Yen, A. Takahashi, S. Josan, J. Tropp, B. K. Rutt, R. E. Hurd, D. M. Spielman, and A. Pfefferbaum, “Dynamic and high-resolution metabolic imaging of hyperpolarized [1-13C]-pyruvate in the rat brain using a high-performance gradient insert.,” Magn Reson Med, vol. 65, no. 5, pp. 1228–1233, May 2011.
[2]. J. M. Park, L. D. Recht, S. Josan, M. Merchant, T. Jang, Y.-F. Yen, R. E. Hurd, D. M. Spielman, and D. Mayer, “Metabolic response of glioma to dichloroacetate measured in vivo by hyperpolarized (13)C magnetic resonance spectroscopic imaging.,” Neuro-oncology, vol. 15, no. 4, pp. 433–441, Apr. 2013.
[3]. J. M. Park, S. Josan, T. Grafendorfer, Y.-F. Yen, R. E. Hurd, D. M. Spielman, and D. Mayer, “Measuring mitochondrial metabolism in rat brain in vivo using MR Spectroscopy of hyperpolarized [2-¹³C]pyruvate.,” NMR Biomed, vol. 26, no. 10, pp. 1197–1203, Oct. 2013.
[4]. I. Park, P. E. Z. Larson, J. W. Gordon, L. Carvajal, H.-Y. Chen, R. Bok, M. Van Criekinge, M. Ferrone, J. B. Slater, D. Xu, J. Kurhanewicz, D. B. Vigneron, S. Chang, and S. J. Nelson, “Development of methods and feasibility of using hyperpolarized carbon-13 imaging data for evaluating brain metabolism in patient studies.,” Magn Reson Med, Jan. 2018.
[5]. V. Z. Miloushev, K. L. Granlund, R. Boltyanskiy, S. K. Lyashchenko, L. M. DeAngelis, I. K. Mellinghoff, C. W. Brennan, V. Tabar, T. J. Yang, A. I. Holodny, R. E. Sosa, Y. W. Guo, A. P. Chen, J. Tropp, F. Robb, and K. R. Keshari, “Metabolic Imaging of the Human Brain with Hyperpolarized 13C Pyruvate Demonstrates 13C Lactate Production in Brain Tumor Patients.,” Cancer Res., p. canres.0221.2018, May 2018.
[6]. J. W. Gordon, H.-Y. Chen, A. Autry, I. Park, M. Van Criekinge, D. Mammoli, E. Milshteyn, R. Bok, D. Xu, Y. Li, R. Aggarwal, S. Chang, J. B. Slater, M. Ferrone, S. Nelson, J. Kurhanewicz, P. E. Z. Larson, and D. B. Vigneron, “Translation of Carbon-13 EPI for hyperpolarized MR molecular imaging of prostate and brain cancer patients.,” Magn Reson Med, Oct. 2018.
[7]. J. Grist, M. McLean, S. Deen, F. Riemer, C. Daniels, A. Gill, F. Zaccagna, R. Schulte, S. Hilborne, J. Mason, J. McKay, A. Comment, A. Chhabra, V. Fernandes, H. Loveday, M. Laurent, I. Patterson, R. Hernandez, R. Slough, T. Matys, I. Wilkinson, B. Basu, C. Trumper, D. Tyler, D. Lomas, M. Graves, A. Coles, K. Brindle, F. Gallagher, “Imaging the healthy human brain with hyperpolarized [1-13C] pyruvate.,” Intl Soc Magn Reson Med, #277, June 2017.
Figures