4308
Probing multiple metabolic pathways in vivo with 1H-decoupled 13C-MRS of hyperpolarized [2-13C]dihydroxyacetone1Institute for Bioengineering of Catalonia (IBEC), Barcelona, Spain, 2Cancer Research UK Cambridge Institute, University of Cambridge, Cambridge, United Kingdom, 3Department of Physiology, Anatomy and Genetics, University of Oxford, Oxford, United Kingdom, 4Oxford Centre for Clinical Cardiac Magnetic Resonance Research, John Radcliffe Hospital, Headington, United Kingdom, 5Department of Physics, University of Oxford, Oxford, United Kingdom, 6General Electric Healthcare, Chalfont St Giles, United Kingdom
Synopsis
Hyperpolarized [2-13C]dihydroxyacetone is a promising probe to investigate changes in glucose metabolism in different metabolic states, such as the alterations caused by diabetes or non-alcoholic fatty liver disease. Proton decoupled 13C-MR spectra of hyperpolarized [2-13C]dihydroxyacetone (DHAc) were acquired from the mouse liver using specialized spectral-spatial RF pulses. This optimized protocol for in vivo studies revealed metabolic products from three different metabolic pathways (gluconeogenesis, glycolysis and lipid synthesis) following the injection of this single hyperpolarized substrate. The metabolic products detected include glycerol 3-phosphate, glycerol, phosphoenolpyruvate, lactate, alanine, glyceraldehyde 3-phosphate and glucose 6-phosphate.
Introduction
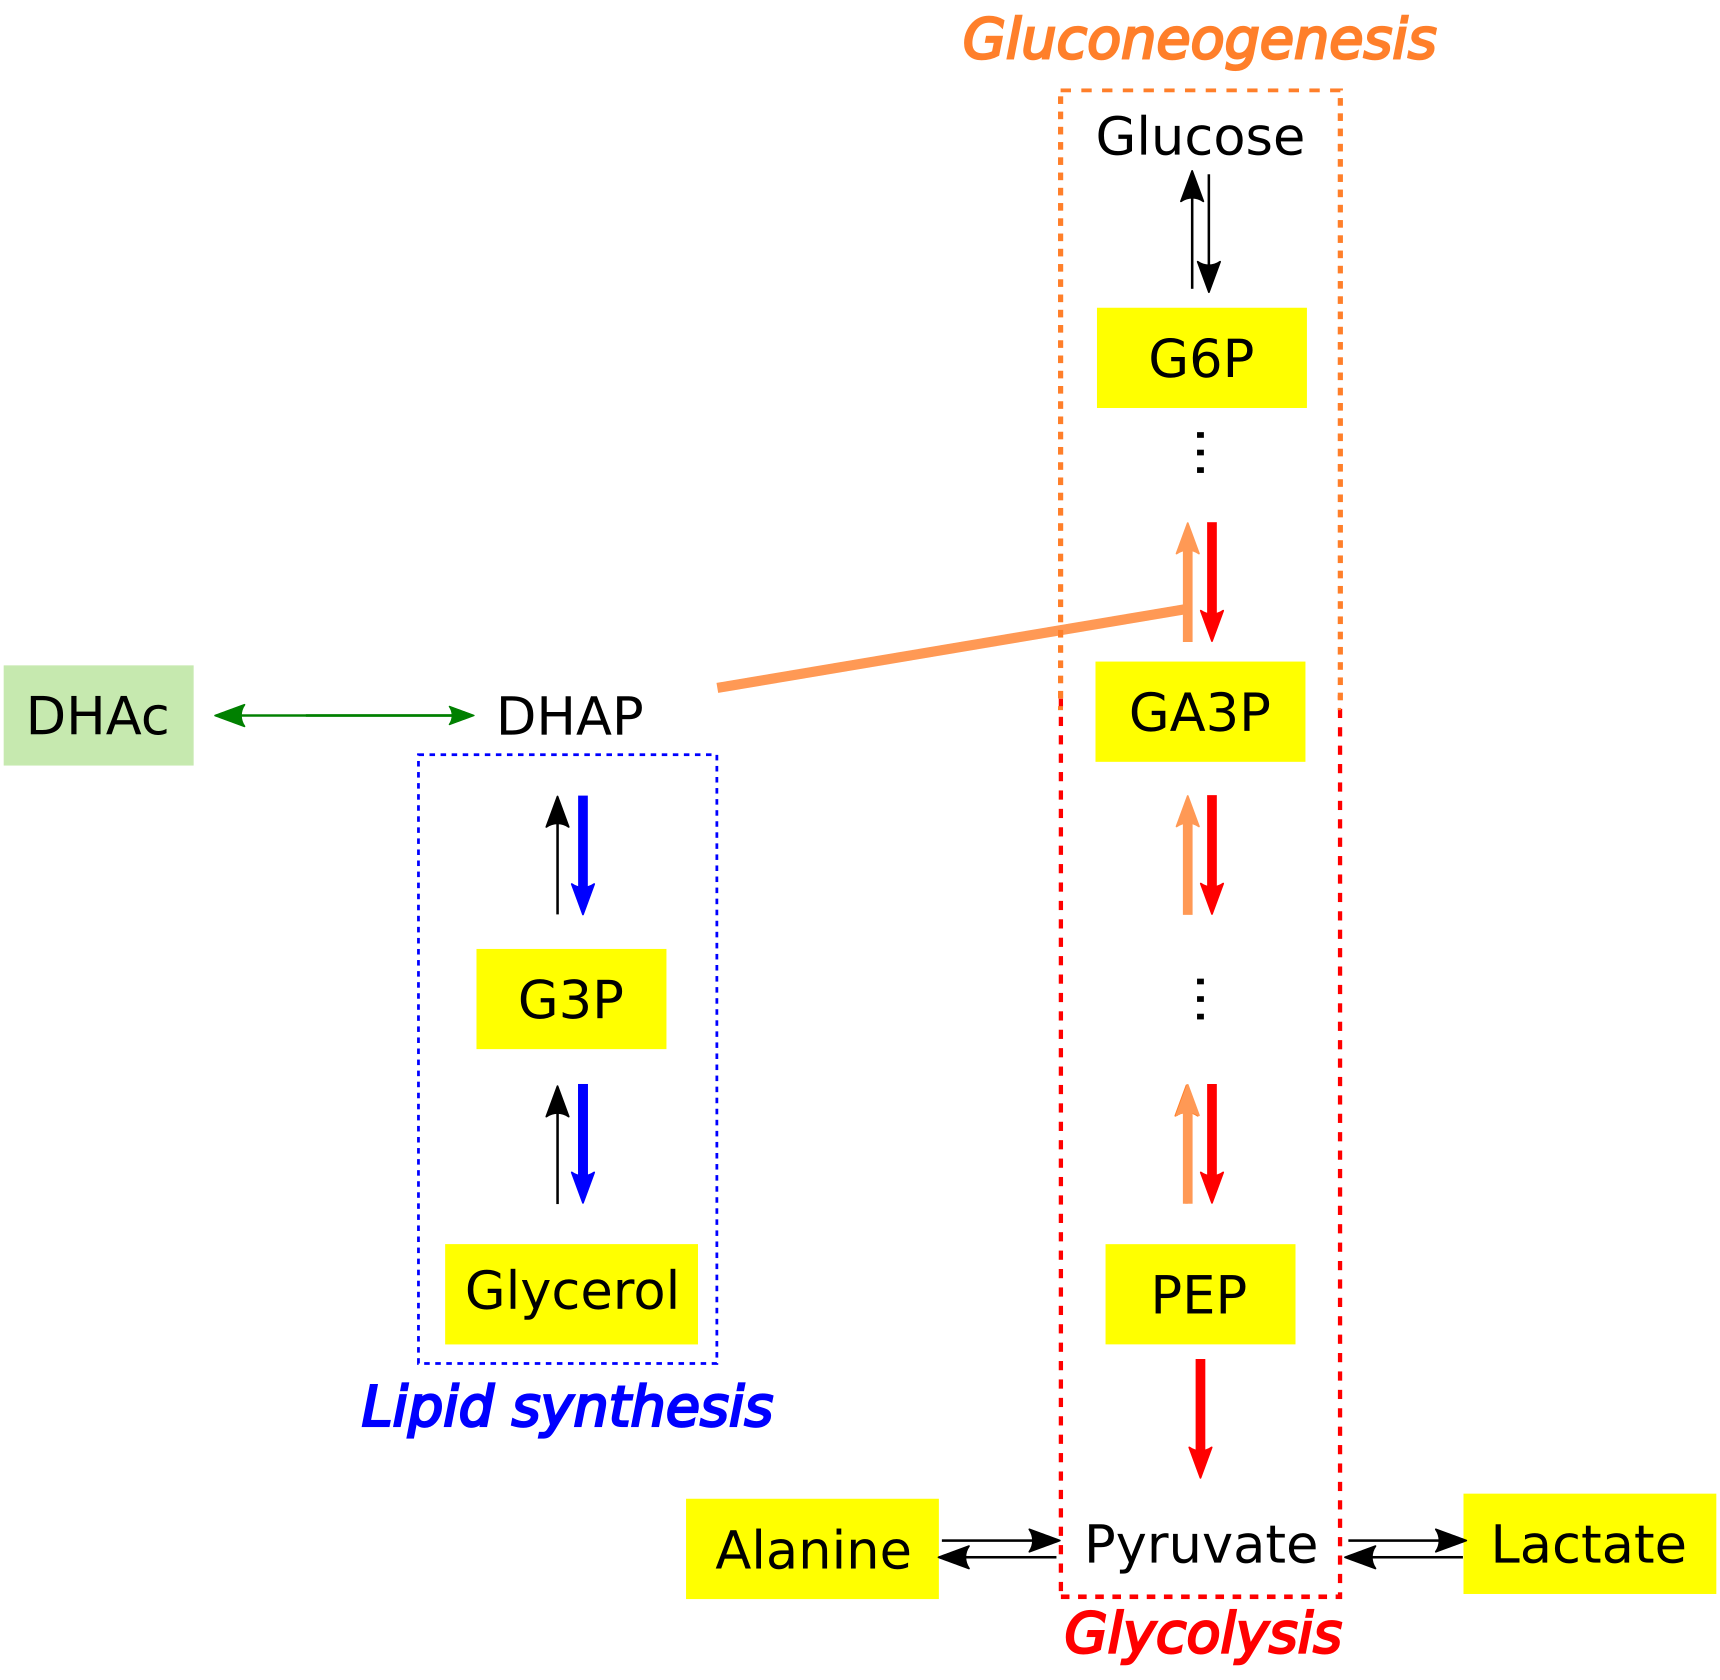
[2‑13C]dihydroxyacetone (DHAc) is a promising substrate for the investigation of gluconeogenesis in metabolic diseases such as non-alcoholic fatty liver disease (NAFLD). In perfused liver, proton decoupled 13C-MR spectra showed that DHAc metabolism could report on gluconeogenesis, glycolysis and lipid synthesis pathways [1] (Figure 1). However, such a level of detail has not previously been achieved in vivo [2].
As shown previously, 13C-MR of hyperpolarized DHAc in vivo presents some challenges due to the large chemical shift range covered by the substrate and its products (~144 ppm). In order to avoid chemical shift misregistration and unnecessary excitation of the substrate, spectral-spatial RF pulses may be used [3,4]. Furthermore, although proton decoupling increases SNR and T1, MR scanners used for in vivo applications are rarely prepared for decoupling experiments [2]. Here we have developed a protocol that involves proton decoupled 13C-MR acquisitions using specialized spectral-spatial pulses.
This study was designed to enhance the detection of the metabolic products of hyperpolarized DHAc and to allow assessment of three metabolic pathways in the liver in vivo.
Methods
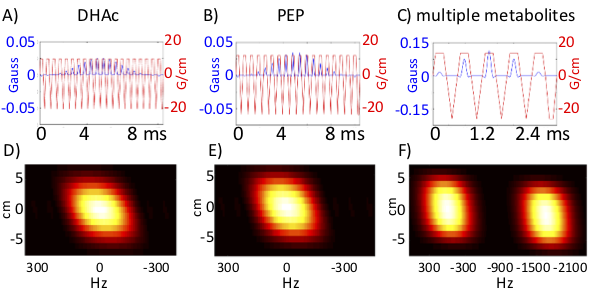
Real-time hepatic metabolism of three fed C57B6 mice (body weight = 20-25 g) was probed by 1H-decoupled 13C-MRS following injection of hyperpolarized [2-13C]DHAc. Three spectral-spatial pulses were designed to excite a spatial bandwidth of 8 mm with varying spectral bandwidths and central frequencies (chemical shifts) (Figure 2): ‘pulse #1’ excited DHAc (213 ppm, 250 Hz bandwidth), ‘pulse #2’ excited phosphoenolpyruvate (PEP; 150.5 ppm, 250Hz bandwidth), and ‘pulse #3’ excited the other metabolites of interest (72 ppm and 50 ppm, 780Hz bandwidth). Resonances acquired with ‘pulse #3’ included C5-β-glucose (C5-glc), C5-β-glucose-6-phosphate (C5-G6P), C2-3-phosphoglycerate (3PG), C2-β-glucose (glc), C2-β-glucose-6-phospate (G6P), C2-glyceraldehyde 3-phosphate (Ga3P), C2-glycerol, C2-glycerol-3-phosphate (G3P), C2-lactate (Lac) and C2-alanine (Ala).
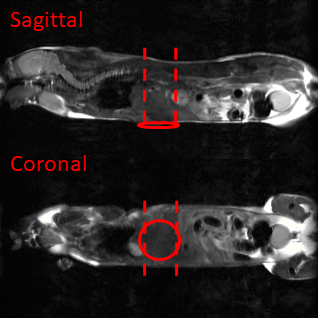
Data were acquired using a Varian (Palo Alto, USA) 7T MR system with a 42 mm volume 1H transmit/receive and 13C transmit coil and a 10 mm diameter 13C surface receive coil (Rapid Biomedical, Rimpar, Germany). Proton-decoupled, pulse-acquire spectra were acquired from 20 s after injection of the hyperpolarized DHAc (400 μl, 54 mM solution, ~10 s after dissolution), with spectral-spatial slice excitation in combination with the receive coil to localize acquisition to the liver. The three spectral-spatial pulse-acquisitions were interleaved - with an acquisition every second - and a nominal flip angle of 90º with 9 repetitions at each acquisition frequency. Data were summed for each frequency range to give three spectra that were processed for peak amplitude quantification using custom MATLAB code (TheMathworks Inc., Natick, USA). Positioning of the surface coil was confirmed with sagittal, coronal and axial T2-weighted 1H images.
Results and Discussion
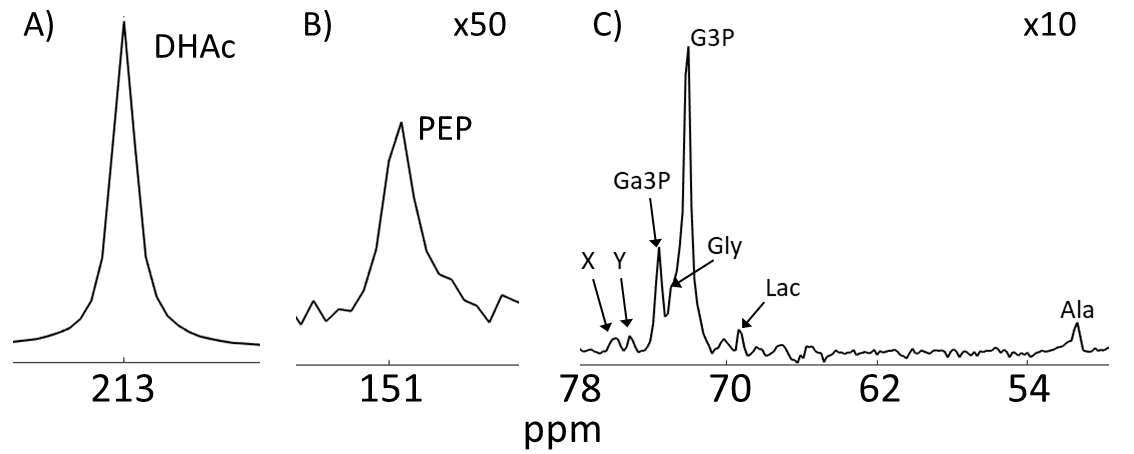
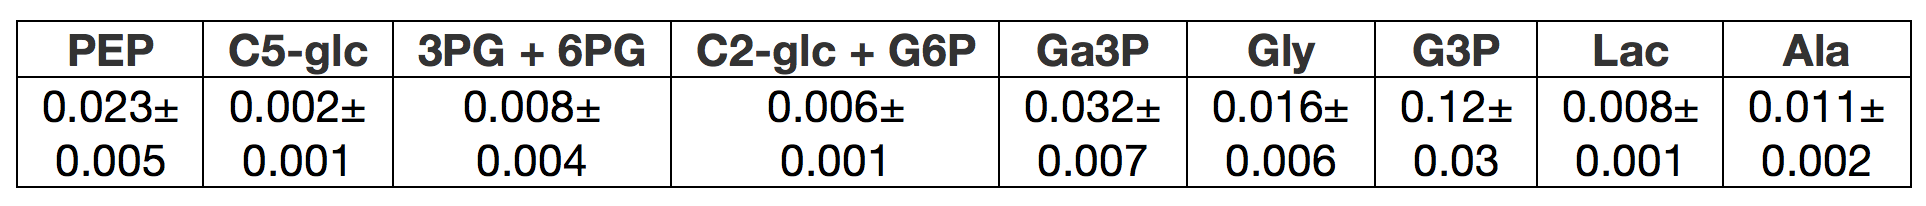
Figure 3 shows a representative 13C-MR spectrum in vivo acquired following injection of hyperpolarized DHAc (polarization level of ~16% at the time of injection), and positioning of the receive coil is shown in figure 4. Table 1 summarizes the metabolite integrals normalized to the DHAc integral in three mice. The peaks with largest SNR correspond to PEP, Ga3P, G3P and Ala. The SNR is affected by factors such as the metabolites’ T1, pool size and enzyme rates within each pathway. This protocol allowed for detection of intermediates in gluconeogenesis, glycolysis and glycerol synthesis in vivo with a spectral resolution and sensitivity similar to that reported in perfused liver [1].
Conclusion
Three metabolic pathways could be probed simultaneously, in real-time and in vivo using hyperpolarized [2-13C]dihydroxyacetone and the combination of 1H-decoupling and spectral-spatial radiofrequency pulses. This protocol could enable the investigation of changes in glucose metabolism and enable imaging of some downstream metabolites that may be of interest in different metabolic states, such as the alterations caused by diabetes or NAFLD, in a non-invasive manner. This could potentially alter patient care standards, minimizing patient pain and discomfort associated with biopsies (particularly in patients with clotting problems due to liver dysfunction) and enabling longitudinal studies of disease progression and the effects of treatment.Acknowledgements
IMR and AJW contributed equally to this work.
We thank Dr. Von Morze and Dr. Vigneron (University of California San Francisco), and Dr. Merritt (University of Florida) for valuable discussions. We also thank Dr. McIntyre for technical assistance. This work is part of a project that has received funding from the European Union’s Horizon 2020 European Research Council (ERC Consolidator Grant) under grant agreement No 682574 (ASSIMILES), a Cancer Research UK Programme grant (17242) and by the CRUK-EPSRC Imaging Centre in Cambridge and Manchester (16465). IMR received financial support through the Junior Leader Postdoctoral Fellowship Programme from “la Caixa” Banking Foundation.
References
[1] Moreno KX, et al. Real-time detection of hepatic gluconeogenic and glycogenolytic states using hyperpolarized [2-13C]dihydroxyacetone. J Biol Chem. 2014;289:35859–35867.
[2] Von Morze C, et al. Sensitivity enhancement for detection of hyperpolarized 13C MRI probes with 1H spin coupling introduced by enzymatic transformation in vivo. Magn Reson Med. 2018;80(1):36-41
[3] Marco-Rius I, et al. Multiband spectral-spatial RF excitation for hyperpolarized [2-13C]dihydroxyacetone 13C-MR metabolism studies. Magn Reson Med. 2017;77(4):1419-1428
[4] Marco-Rius I, et al. Monitoring acute metabolic changes in the liver and kidneys induced by fructose and glucose using hyperpolarized [2-13C]dihydroxyacetone. Magn Reson Med. 2017;77(1):65-73
Figures