4306
Rapid Visualization of the Effects of Lactate Dehydrogenase Inhibition in Breast Cancer using Hyperpolarized Pyruvate1Radiology, Beth Israel Deaconess Medical Center and Harvard Medical School, Boston, MA, United States, 2Hematology/Oncology, Beth Israel Deaconess Medical Center and Harvard Medical School, Boston, MA, United States, 3Medicine, Beth Israel Deaconess Medical Center and Harvard Medical School, Boston, MA, United States
Synopsis
High rates of glycolysis in cancer can be targeted by inhibition of lactate dehydrogenase (LDH), the enzyme responsible for conversion of pyruvate into lactate. Hyperpolarized pyruvate was employed to assess the effects of GNE140, a recently developed inhibitor of LDH. Administration of GNE140 results in a sizable reduction in lactate signal within 30 minutes of administration.
Introduction:
Many types of cancer exhibit the so-called Warburg effect [1], wherein cancer cells take in large quantities of glucose and metabolize it to lactate even in the presence of sufficient oxygen to support oxidative metabolism. Lactate dehydrogenase (LDH) is the final enzyme in this metabolic pathway, converting pyruvate generated by glycolysis into lactate. Hyperpolarized pyruvate provides an excellent probe of LDH activity. Here we present hyperpolarized spectroscopic imaging of pyruvate and its metabolites in a model of breast cancer during the first hour of treatment with a recently developed LDH inhibitor, GNE140 [2]. Similar studies with the inhibitor FX-11 [3,4] demonstrated a gradual, roughly 40%, reduction of lactate signal (relative to pyruvate) in a lymphoma model over a period of several days. Here we show that the effects of GNE140 can be observed as soon as 30 minutes after administration, with a roughly 80% reduction in relative lactate.
Methods:
Animal studies were undertaken with IACUC approval. A model of triple-negative BRCA1-related breast cancer was generated by transplantation of spontaneously developed tumor tissue from a K14-Cre BRCA1f/f p53f/f donor to the mammary pads of syngeneic recipients. Tumors were then allowed to grow to a size of approximately 10mm. Prior to imaging, animals were anesthetized and a catheter connected to an extension tube was placed in the tail vein. Animals were then situated in the MRI with temperature maintained at 37C. Imaging was performed using a 9.4T small animal MRI (Biospec 94/20, Bruker, Billerica MA) with a 74mm quadrature proton volume coil and a 28mm transmit/receive 13C coil situated around the tumor. 100mM hyperpolarized pyruvate solution was prepared using a commercial hyperpolarizer (Hypersense, Oxford Instruments, Oxfordshire UK) as described previously [5]. 150 microliters of pyruvate solution were administered via tail vein, and 13C images of the tumor were acquired using echo-planar spectroscopic imaging (EPSI) with 4 degree tip angle, 16x16 matrix, 2.5mm in-plane resolution, 5mm slice, 512 spectral points, and 4kHz spectral width. 32 repetitions were acquired with 2 second temporal resolution. Approximately 10 minutes later, mice received either 100mg/kg GNE140 in DMSO (n=5) or DMSO only (n=5) by intraperitoneal injection. Thirty minutes after administration of GNE140 (or vehicle), pyruvate imaging was repeated. Spectroscopic image data were reconstructed by combining even and odd echoes after application of a first-order phase correction to account for temporal offsets between the two echo sets. Pixel-by-pixel magnitude spectra were computed, and pyruvate and lactate signals were quantified by integrating their spectral peaks, after subtracting the mean magnitude noise from the spectra to eliminate spurious baseline signals. Magnitude noise was estimated from a noise-only spectrum. Lactate-to-pyruvate ratios were computed using the time integrals of each metabolite’s signal [6], summed over a region of interest covering the tumor.Results:
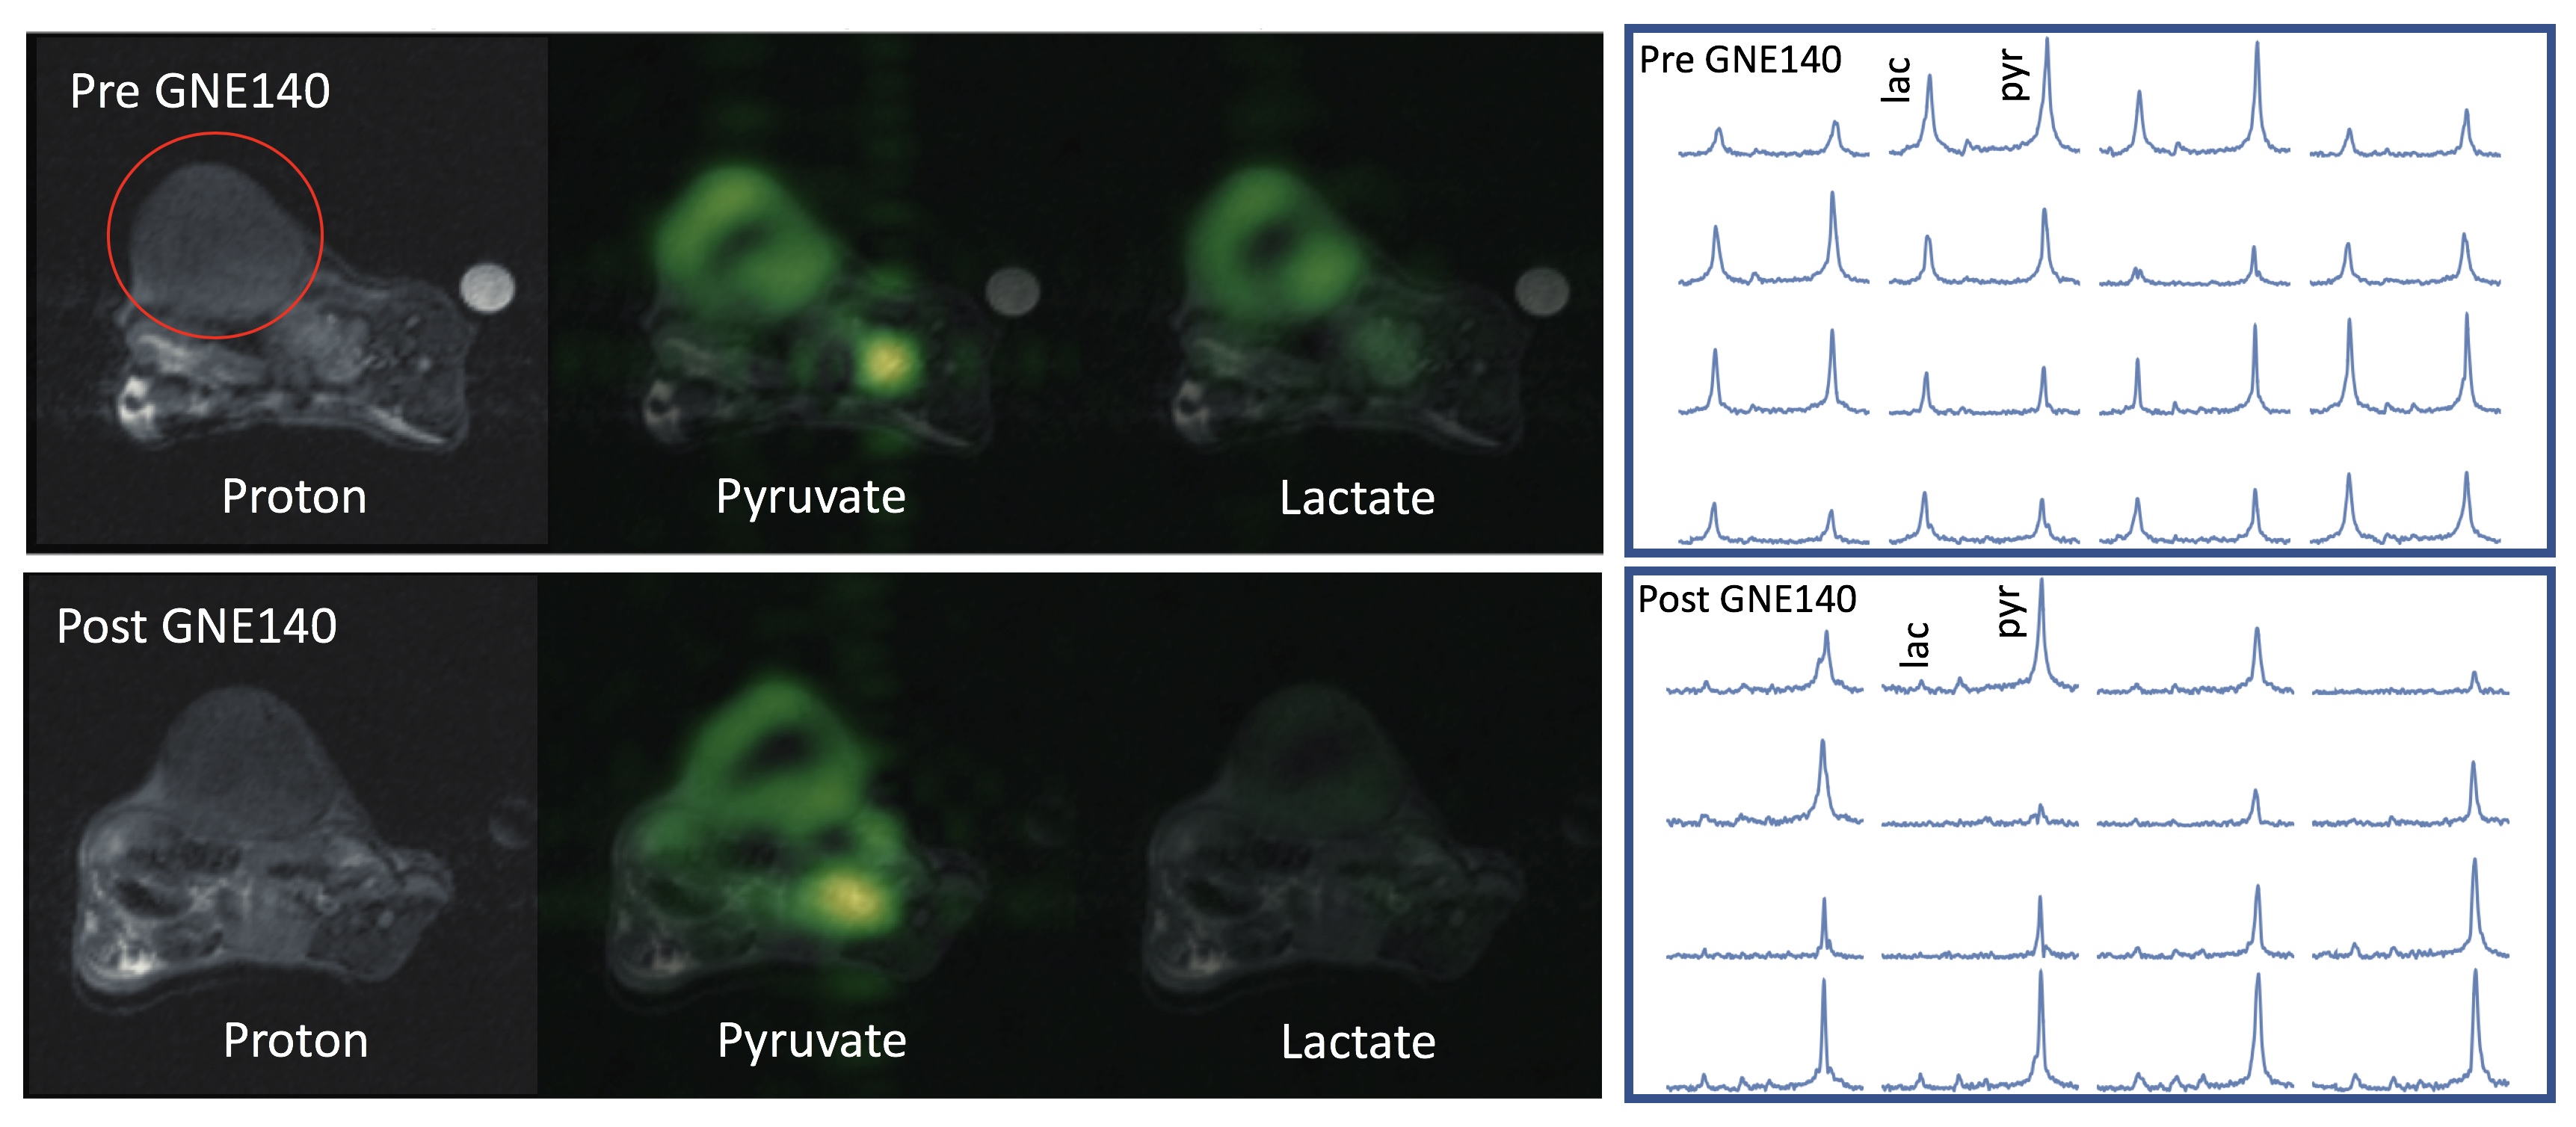
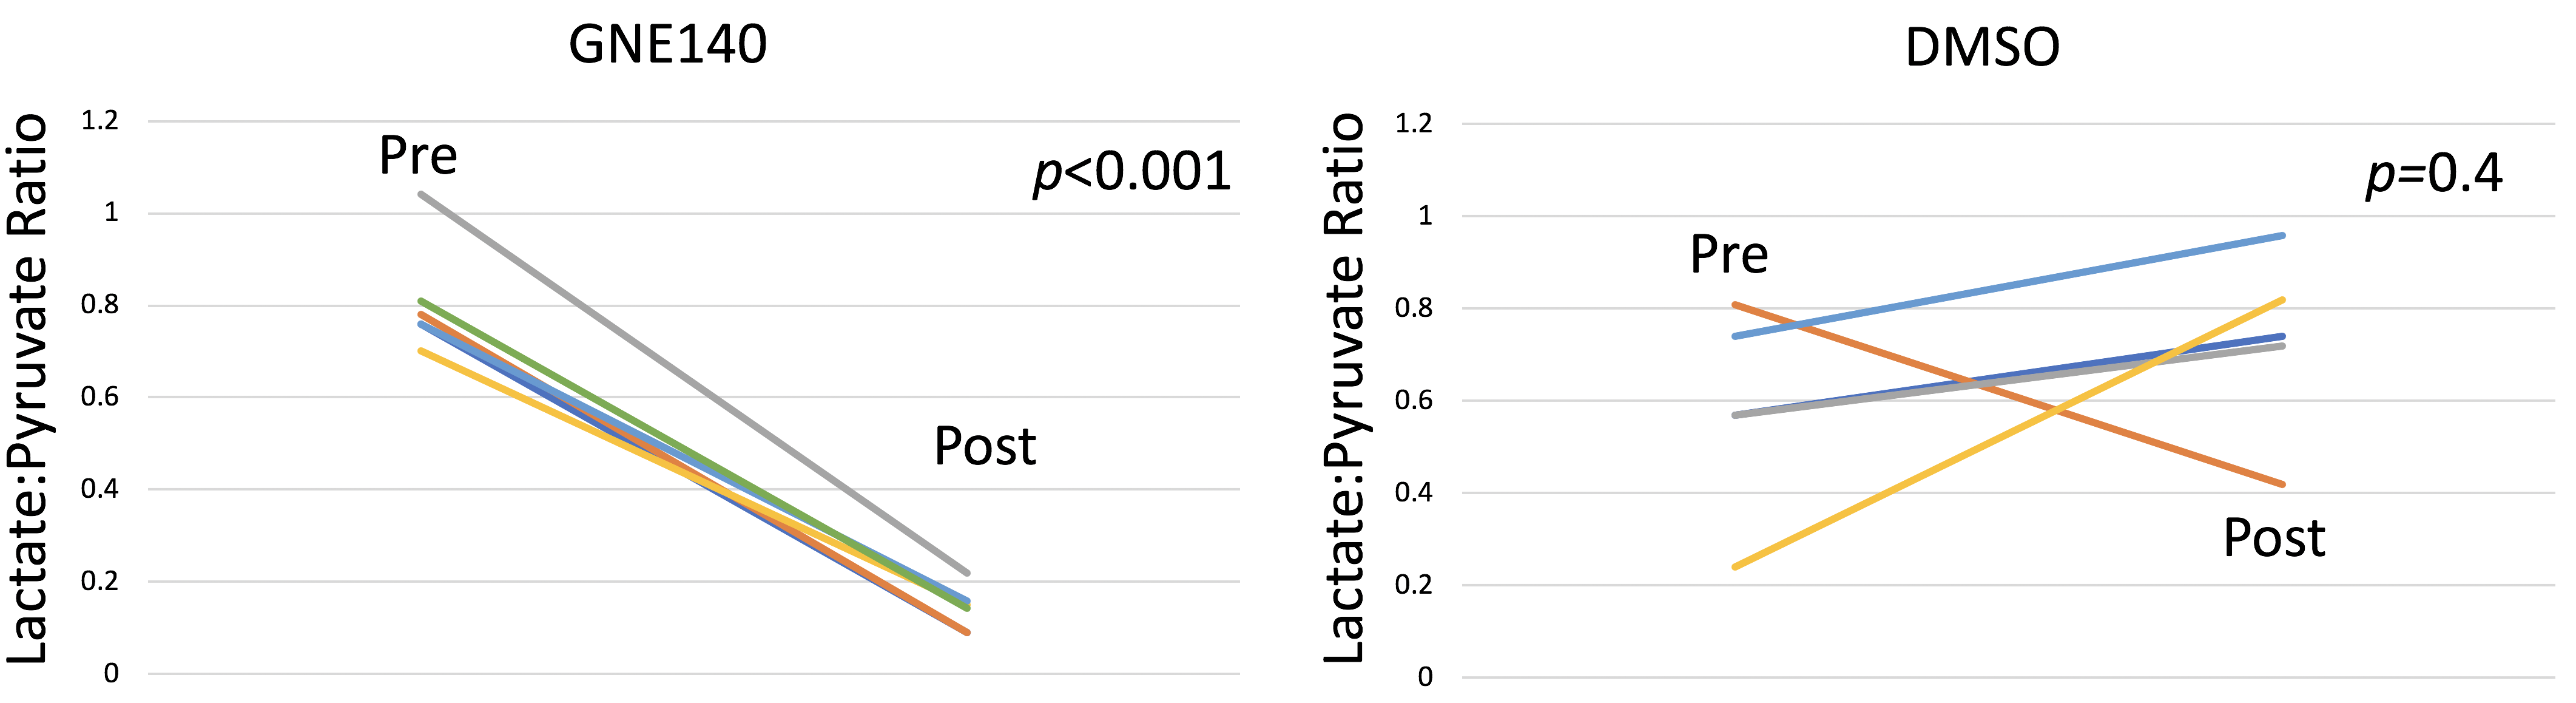
Representative data are shown in Fig. 1, which displays proton, pyruvate, and lactate images before and after administration of GNE140, together with spectra from an ROI covering the tumor, summed over the 32 repetitions. Fig. 2 displays the change in the lactate-to-pyruvate ratio for each of the treated and control animals before and after administration of GNE140 or DMSO. In GNE140-treated animals, the lactate-to-pyruvate ratio fell from 0.81±0.13 to 0.14±0.05 (mean±std. dev.), with significance p<0.001 (two sample t-test with unequal variance). In animals that received DMSO only, the ratios before and after treatment were 0.59±0.22 and 0.72±0.20, p=0.4.Discussion:
Non-invasive evaluation of the in vivo efficacy of candidate metabolic inhibitors poses a significant challenge in the development of targeted metabolic therapies. While previous studies have employed FDG-PET to indirectly assess the effects of GNE140 on glycolysis [2], hyperpolarized pyruvate provides a direct probe of inhibition of the target enzyme. The observed effects are sizeable, with a roughly 80% reduction in the lactate-to-pyruvate ratio. The impact of the inhibitor can be visualized as soon as 30 minutes after the first dose.Conclusions:
The metabolic inhibitor GNE140 results in a substantial reduction of pyruvate-to-lactate exchange when assessed with hyperpolarized pyruvate, indicating in vivo efficacy against LDH. These results further illustrate the potential of hyperpolarized pyruvate in assessing cancer response to therapy in near real-time.Acknowledgements
This work was supported in part by the National Institutes of Health through grants R21 EB014471 and R01 CA169470.References
[1] Warburg O, Wind F, and Negelein E. The metabolism of tumors in the body. J. Gen. Physiol. 8, 519-530 (1927).
[2] Boudreau A et al. Metabolic plasticity underpins innate and acquired resistance to LDHA inhibition. Nature Chemical Biology 12, 779-786 (2016).
[3] Le A et al. Inhibition of lactate dehydrogenase A induces oxidative stress and inhibits tumor progression. Proc. Soc. Natl. Acad. Sci. USA, 107(5) 2037-2042 (2010).
[4] Dutta P, Le A, Vander Jagt DL, Tsukamoto T, Martinez GV, Dang CV, Gillies RJ. Evaluation of LDH-A and glutaminase inhibition by hyperpolarized 13C pyruvate magnetic resonance spectroscopy of tumors. Cancer Res. 73(14) 4190-4195 (2013).
[5] Varma G et al. Selective spectroscopic imaging of hyperpolarized pyruvate and its metabolites using a single-echo variable phase advance method in balanced SSFP. Magn. Reson. Med. 76(4) 1102-1115 (2016).
[6] Hill DK, Orton MR, et al. Model free approach to kinetic analysis of real-time hyperpolarized 13C magnetic resonance spectroscopy data. PLoS One 8(9), e71996 (2013).
Figures