4305
Distinguishing metabolic signals of liver tumors from surrounding liver cells using hyperpolarized 13C MRI and Gadoxetate11Department of Radiology and Biomedical Imaging, University of California, San Francisco, CA, United States, 2Liver Center, University of California, San Francisco, CA, United States
Synopsis
Hyperpolarized (HP) 13C MRI is a new technique that can assess the metabolic pathways in a variety of tumors. In this study, we show the ability of a gadolinium-based contrast agent (gadoxetate) to selectively suppress the HP metabolic signal arising from normal hepatocytes by altering the relaxation rates of metabolites 13C pyruvate and 13C lactate in order to evaluate the metabolic profile of tumors within the liver.
Purpose
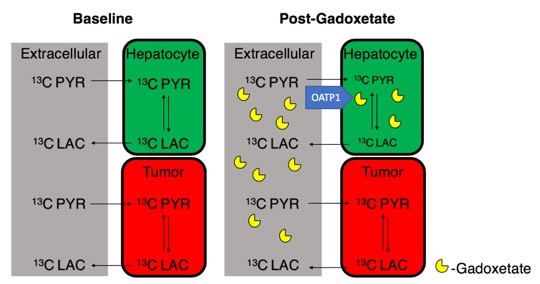
Improved metabolic imaging of liver tumors is important clinically, particularly for colon cancer metastases to the liver. Imaging liver tumor metabolism could assist in studying tumor viability, heterogeneity, aggressiveness, treatment response, tumor prognosis and to study metabolic biomarkers for development of novel therapies. Molecular imaging strategies such as FDG-PET have limited sensitivity for small intrahepatic lesions due to high background metabolism of normal hepatocytes. The metabolic conversion of pyruvate to lactate is upregulated in many tumors, a phenomenon known as the Warburg effect1. Conversely, hyperpolarized (HP) 13C MRI is a powerful emerging molecular imaging technique for evaluating metabolism in vivo1 but it is not selective for different cell types. Gadoxetate (Eovist™, Bayer Pharmaceuticals) is an FDA-approved gadolinium-based contrast agent that is used routinely for visualizing liver tumors. Gadoxetate is selectively taken into hepatocytes but excluded from tumors due to lack of organic anion transporting polypeptide 1 (OATP12; Fig 1). Gadoxetate has been previously shown to selectively suppress the metabolic signal arising from the liver as compared to kidneys3. In this study, we separate the metabolic signals arising from tumor cells by using gadoxetate to selectively quench the background signals arising from normal hepatocytes.Methods
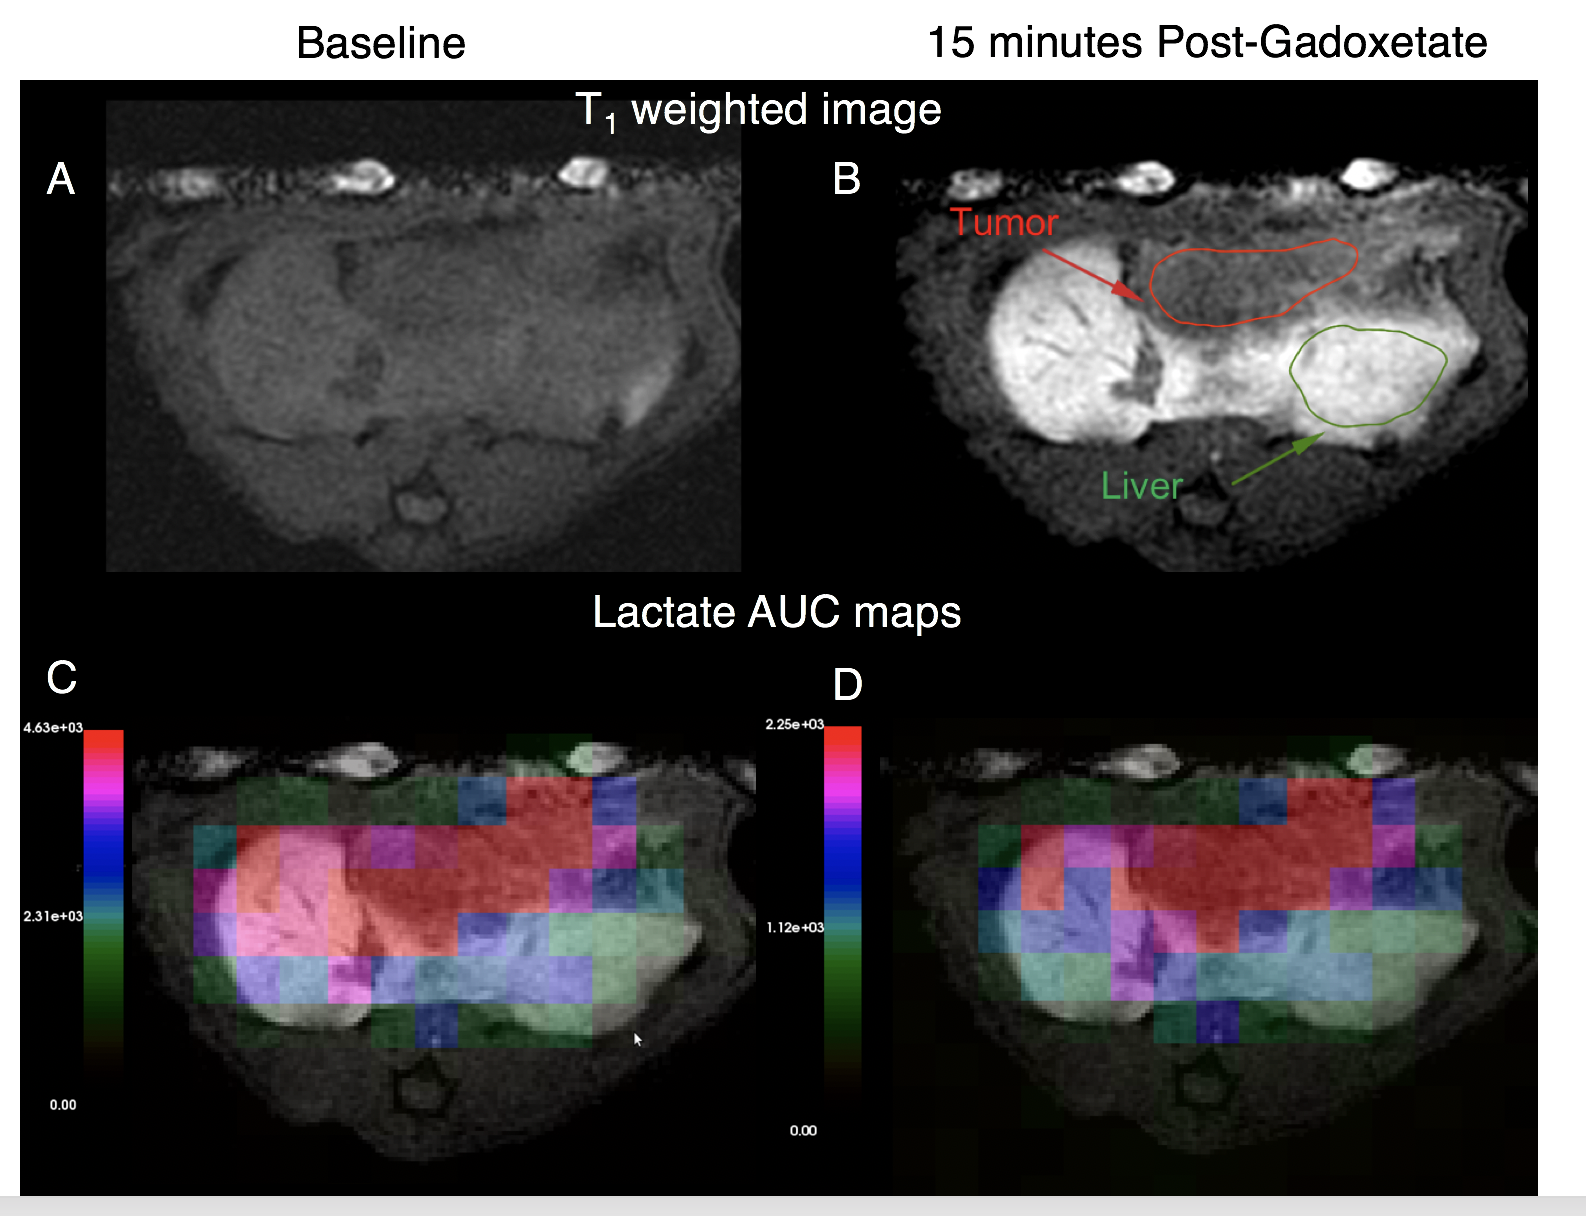
CC531 rat-derived colon cancer cells (Cell Lines Services, Heidelberg Germany, 0.5-1 x 10⁶ cells) were implanted into the livers of WAG-Rij rats (n = 2, Charles River Laboratories). Hyperpolarization of 1-13C Pyruvate (24 ml) was performed using a 3.35T dynamic nuclear polarizer (Hypersense, Oxford Instruments) at 1.35 K for one hour. The hyperpolarized pyruvate was rapidly dissolved with superheated 80 mM NaOH dissolution buffer and 2-2.5 mL was injected into each rat over 12 secs. Imaging was performed on a clinical 3T MRI (MR750, General Electric) scanner with multinuclear imaging capability and a custom-built dual tuned 1H/13C volume coil. Dynamic 13C images of pyruvate and lactate were acquired using a spectrally-selective echo planar imaging strategy4, beginning 10 sec after the start of the HP 1-13Cpyruvate injection. Images were acquired with a FOV of 64 x 64 mm, matrix size of 16 x 16, 8 mm slice thickness and with TR = 200 ms/metabolite and TE = 18.5 ms. Pyruvate and lactate dynamic images were acquired using an independent flip angle of 10 and 30 degrees respectively. A total of 20 time-frames were acquired for each metabolite, with a temporal resolution of 3 s and a total scan time of 60s. 13C images were acquired prior to and 15 minutes following injection of gadoxetate (0.1 mmol/kg) (Fig 2). Metabolite maps (pyruvate and lactate) were analyzed from two different ROIs: one through normal liver and one through liver tumor (Fig 2).Results
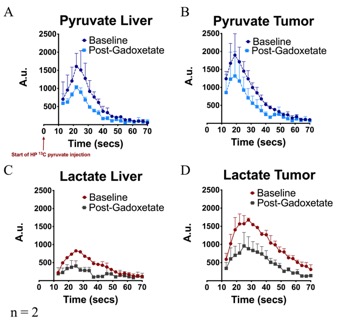
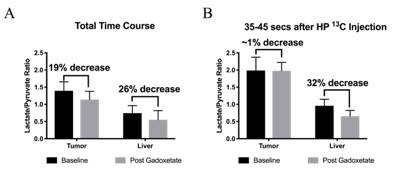
Proton images show expected hepatocyte enhancement following gadoxetate administration, with tumors appearing as defects in gadoxetate uptake (Fig 2B). Tumors demonstrated high levels of lactate at baseline, as expected (Fig 3). Under the influence of gadoxetate, the lactate/pyruvate ratio in normal livers reduced from 0.74 ± 0.22 to 0.55 ± 27 (26%), while lactate/pyruvate ratio in the tumors changed less (from 1.39 ± 0.26 to 1.14 ± 0.24, or 19%, Fig 4A). If only the later time points were used (30-45 s after injection), a much larger difference in the lactate/pyruvate ratio pre and post-gadoxetate between liver (0.96 ± 0.19 to 0.65 ± 0.17 (~32%)) and tumor (1.98 ± 0.39 to 1.97 ± 25 (~1%), Fig 4B) were observed, improving the contrast between the two.Discussion
The use of targeted relaxation agents with selective compartmentalization is a novel and promising tool for increasing the specificity of hyperpolarized 13C MRI. High quality hyperpolarized 13C images can be acquired post administration of gadoxetate despite the presence of residual gadolinium circulating in the bloodstream. Gadoxetate was able to successfully suppress the hyperpolarized 13C signal arising from hepatocytes as compared to tumors. Greater selectivity was observed at later time points, likely because earlier time points were dominated by metabolites still present in the blood pool rather than cells. Further experiments in a larger sample size are required to confirm these observations. Further optimization of gadoxetate dose (increasing or decreasing the dosage to achieve better contrast between liver and tumor) and timing (>10secs interval between HP 13C pyruvate injection and acquisition of 13C images) will potentially further improve metabolite contrast in liver and tumor.Acknowledgements
No acknowledgement found.References
1. Kurhanewicz J, Vigneron DB, Brindle K, et al. Analysis of cancer metabolism by imaging hyperpolarized nuclei: prospects for translation to clinical research. Neoplasia. 2011; 13:81–97.
2. Leonhardt M et al Hepatic uptake of the magnetic resonance imaging contrast agent Gd-EOB-DTPA: role of human organic anion transporters. Drug Metab Dispos. 2010 Jul;38(7):1024-8
3. Ohliger, M. A. et al. Combining Hyperpolarized 13C MRI With a Liver-Specific Gadolinium Contrast Agent for Selective Assessment of Hepatocyte Metabolism. Magn Reson Med 77, 2356–2363 (2017).
4. Gordon, J. W. et al. Development of a Symmetric EPI Framework for Clinical Translation of Rapid Dynamic Hyperpolarized 13C Imaging. Magn Reson Med. 2017 Feb; 77(2): 826–832.
Figures