4297
Frequency calibration methods for the use of 13C spectral-spatial pulses in human brain1Dept of Radiology, University of Cambridge, Cambridge, United Kingdom, 2Cancer Research UK Cambridge Institute, University of Cambridge, Cambridge, United Kingdom, 3MR Research Centre, University of Aarhus, Aarhus, Denmark, 4GE Healthcare, Munich, Germany
Synopsis
Spectral-spatial pulses demand accurate frequency setting, which is difficult for studies using hyperpolarized 13C substrates, as the calibration has to be performed prior to the injection of the labelled molecule. In this study we retrospectively analysed human 13C brain studies, comparing three methods of scan calibration: study date, external reference phantom, and 1H frequency. The latter method outperformed the other 2 by a large margin: the SD of differences (predicted minus actual frequency of pyruvate) was 11 Hz with 1H frequency, 39 Hz using study date, and 40 Hz when referenced to an external phantom.
Introduction
Hyperpolarized 13C imaging is complicated by the conflicting aims of maximizing signal using large flip angle pulses and minimizing loss of polarization with small flip angles. Both these aims can be achieved using spectral-spatial pulses to selectively excite the precursor pyruvate with a low flip angle pulse and the metabolic products such as lactate and alanine with higher flip angles1,2. However, the narrow bandwidth required for metabolite-specific excitation (~80Hz) requires precise setting of the frequency of the polarized peaks, which cannot be accurately determined until the injected material reaches the tissue of interest. Here we compare the efficacy of different methods for frequency calibration through retrospective analysis of human brain datasets obtained at our site.
Methods
Hyperpolarized 13C brain data was acquired in 17 subjects (8 with glioma, 1 with multiple sclerosis, and 8 healthy controls) using either slice-selective spectroscopy or IDEAL spiral CSI3: a cycle of typically 8 steps with 1 slice-localized spectrum and 7 single-shot spiral images with incremented TE, from which images were reconstructed for pyruvate, lactate, bicarbonate, alanine, and pyruvate hydrate. The spectra were used to measure the actual frequency of both pyruvate in the dynamic series and of a reference standard (a small phantom containing 13C-enriched urea or bicarbonate) during the pre-injection calibration scan. The drift in frequency with time was determined by a linear fit against the scan date, the slope of which was used to retrospectively predict pyruvate frequency in each subject. The difference between the observed and predicted frequency of pyruvate was compared for this method (‘date’) and two other methods: using an external 13C-labelled reference standard (‘phantom’), and using the water frequency in the previous 1H series (‘1H freq’), corrected by the ratio of γ for 1H/13C (3.97595) plus an additional average offset determined from the data. In separate experiments to characterize the effect of temperature on 13C frequency, an unenriched 5M lactate phantom was scanned on a 600 MHz Bruker NMR device at 19°C and 37°C.
Results
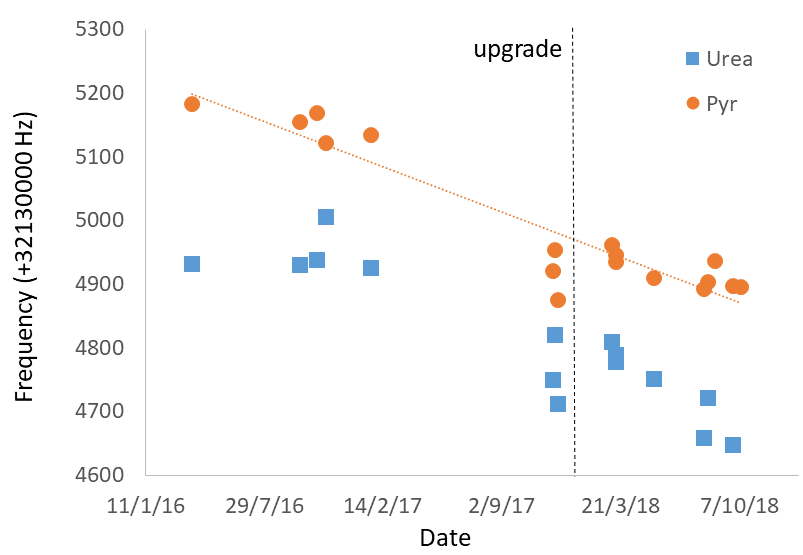
As expected, the frequencies of both pyruvate and urea drifted slowly downward over the two-year timescale of the experiments (Fig 1). The rate of drift calculated from a linear fit to the pyruvate frequencies was 0.36 Hz/day. An upgrade to scanner software occurred in December 2017, as indicated by the vertical line, but this induced no discernible step change in frequency. Shifts of other metabolites in vivo relative to pyruvate appeared very consistent, with the exception that the offset of pyruvate hydrate sometimes varied by a few Hz.
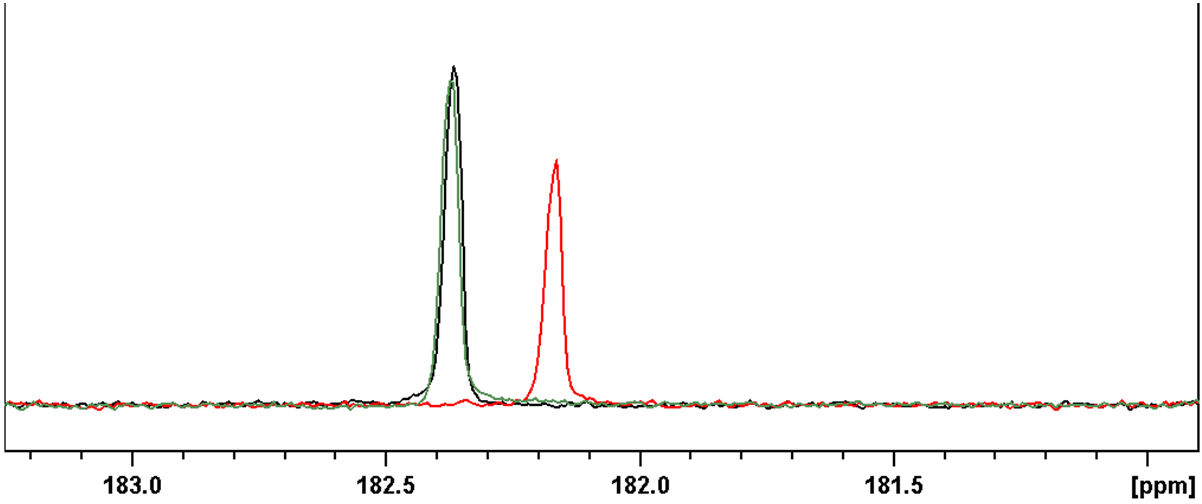
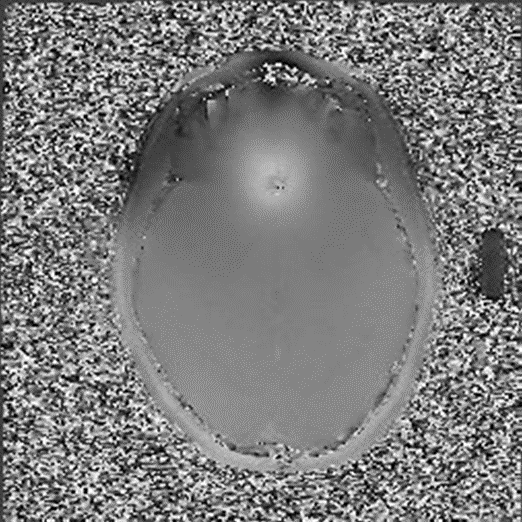
The difference between the frequencies of pyruvate and urea varied, dominated by variability in the urea resonance. The frequency separation was not correlated with date (R2 = 0.05), suggesting it was unlikely to be due to phantom degradation. The average separation was 186 ± 43 Hz, significantly lower than the separation predicted from their published chemical shifts at 3T (8.1 ppm = 260 Hz). Temperature of the phantom may partially explain the discrepancy, as phantom experiments at high field demonstrated a shift in [1-13C] lactate relative to [3-13C] lactate of >30 Hz at body temperature compared to room temperature (Fig 2). However, B0 variation is likely to be the dominant effect, as the shim was optimized over the brain and the 1H frequency was often very different in the small external phantom (Fig 3). Although B0 mapping was generally performed, the spatial discontinuity between the brain and phantom made it impossible to confidently unwrap the phase.
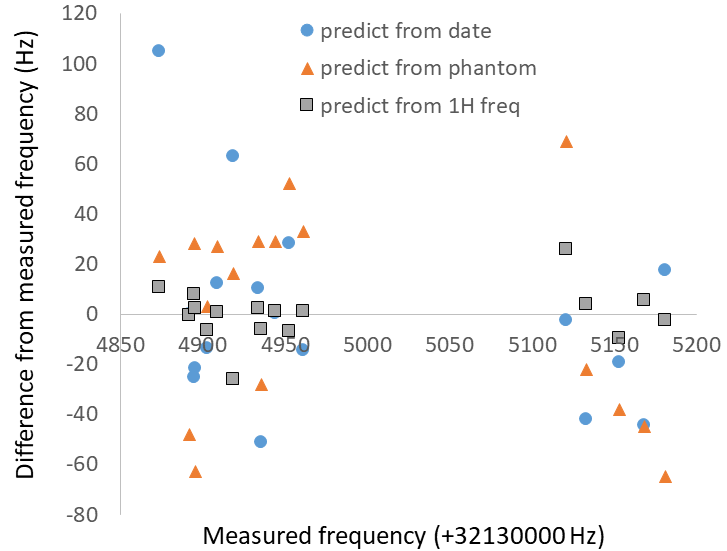
Frequency prediction using the scan date or by referencing to the external phantom both performed poorly (Fig 4): the standard deviation (SD) of differences (predicted – actual) was 39 and 40 Hz respectively, and 5 or 6 of 17 subjects respectively would have been outside the bandwidth of spectral-spatial excitation (error >40 Hz). Frequency prediction based on 1H frequency performed better, with an SD of only 11 Hz, and there were no subjects where spectral-spatial excitation would have failed.
Discussion
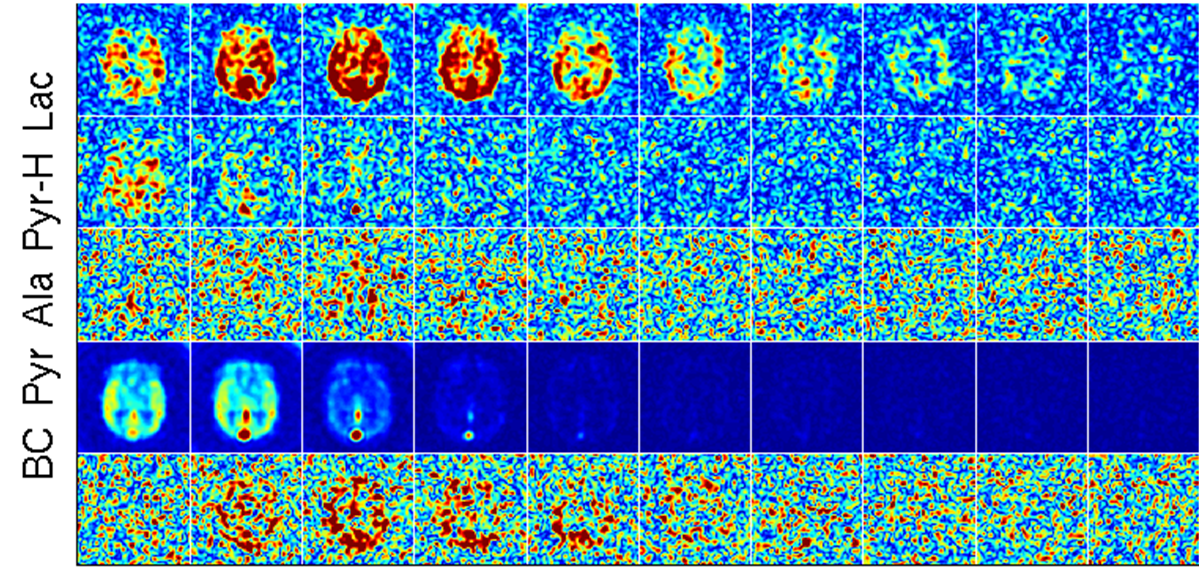
Neither calibrating from a reference phantom nor from a retrospective fit of pyruvate frequency in vivo against date resulted in sufficient accuracy in our subjects for confident application of spectral-spatial pulses. Better results were obtained using the 1H frequency from the previous series, dividing by the ratio of γ and subtracting the average offset to pyruvate over all subjects (2620 Hz), presumably because this approach best reflects the shim over the anatomy of interest. This retrospective analysis was enabled by using the IDEAL spiral technique, which produced robust metabolite images even when frequency was incorrect by >100 Hz (Fig 5).Acknowledgements
This study was made possible by the staff of the MRIS Unit of Addenbrooke's Hospital and funding from the Wellcome Trust, the Cancer Research UK Cambridge Centre, and the Cambridge Experimental Cancer Medicine Centre.References
1. Larson PEZ, Kerr AB, Chen AP, Lustig MS, Zierhut ML, Hu S, Cunningham CH, Pauly JM, Kurhanewicz J, Vigneron DB. Multiband excitation pulses for hyperpolarized 13C dynamic chemical-shift imaging. J Magn Reson 2008; 194:121-127.
2. Schulte RF, Sperl JI, Weidl E, Menzel MI, Janich MA, Khegai O, Durst M, Ardenkjaer-Larsen JH, Glaser SJ, Haase A, Schwaiger M, Wiesinger F. Saturation-recovery metabolic-exchange rate imaging with hyperpolarized [1-(13)C]pyruvate using spectral-spatial excitation. Magn Reson Med 2013; 69: 1209-16.
3. Wiesinger F, Weidl E, Menzel MI, Janich MA, Khegai O, Glaser SJ, Haase A, Schwaiger M, Schulte RF. IDEAL spiral CSI for dynamic metabolic MR imaging of hyperpolarized [1-(13) C]pyruvate. Magn Reson Med 2012; 68:8-16.
Figures