4295
Apparent metabolic exchange rate mapping using saturation-recovery acquisition and Michaelis-Menten modelling1GE Healthcare, Munich, Germany, 2MR Research Centre, Aarhus University, Aarhus, Denmark
Synopsis
Injecting high doses of hyperpolarised 13C pyruvate in vivo leads to saturation effects: more precursor will not increase the amount of downstream substrate, leading to errors when quantifying with the conventional two-site exchange model. Saturation effects can be modelled via a Michaelis-Menten kinetics, however requiring metabolic exchange rates measured at multiple time points as input. In this work we extend a previous saturation-recovery measurement to map apparent metabolic exchange rates taking saturation effects into account.
Introduction
Metabolic imaging with hyperpolarised [1-13C]pyruvate (Pyr) can
measure the metabolic conversion rate from substrate Pyr to downstream
metabolites X (lactate, alanine, bicarbonate) spatially localised[1,2]. Injecting
the large Pyr doses can saturate the system due
to limited cellular update and depletion of enzymes required for conversion[3,4]. These saturation effects can be measured by
injecting different doses of Pyr[3] or by saturation-recovery of
downstream metabolites[4] and quantifying them using a Michaelis-Menten
kinetic model. Objectives was to extend the saturation-recovery
metabolic exchange-rate mapping[2] to a Michaelis-Menten type of kinetics.
Simulations and in vivo results confirm feasibility, with the benefit of
removing dose effects from the apparent conversion rate maps.Methods
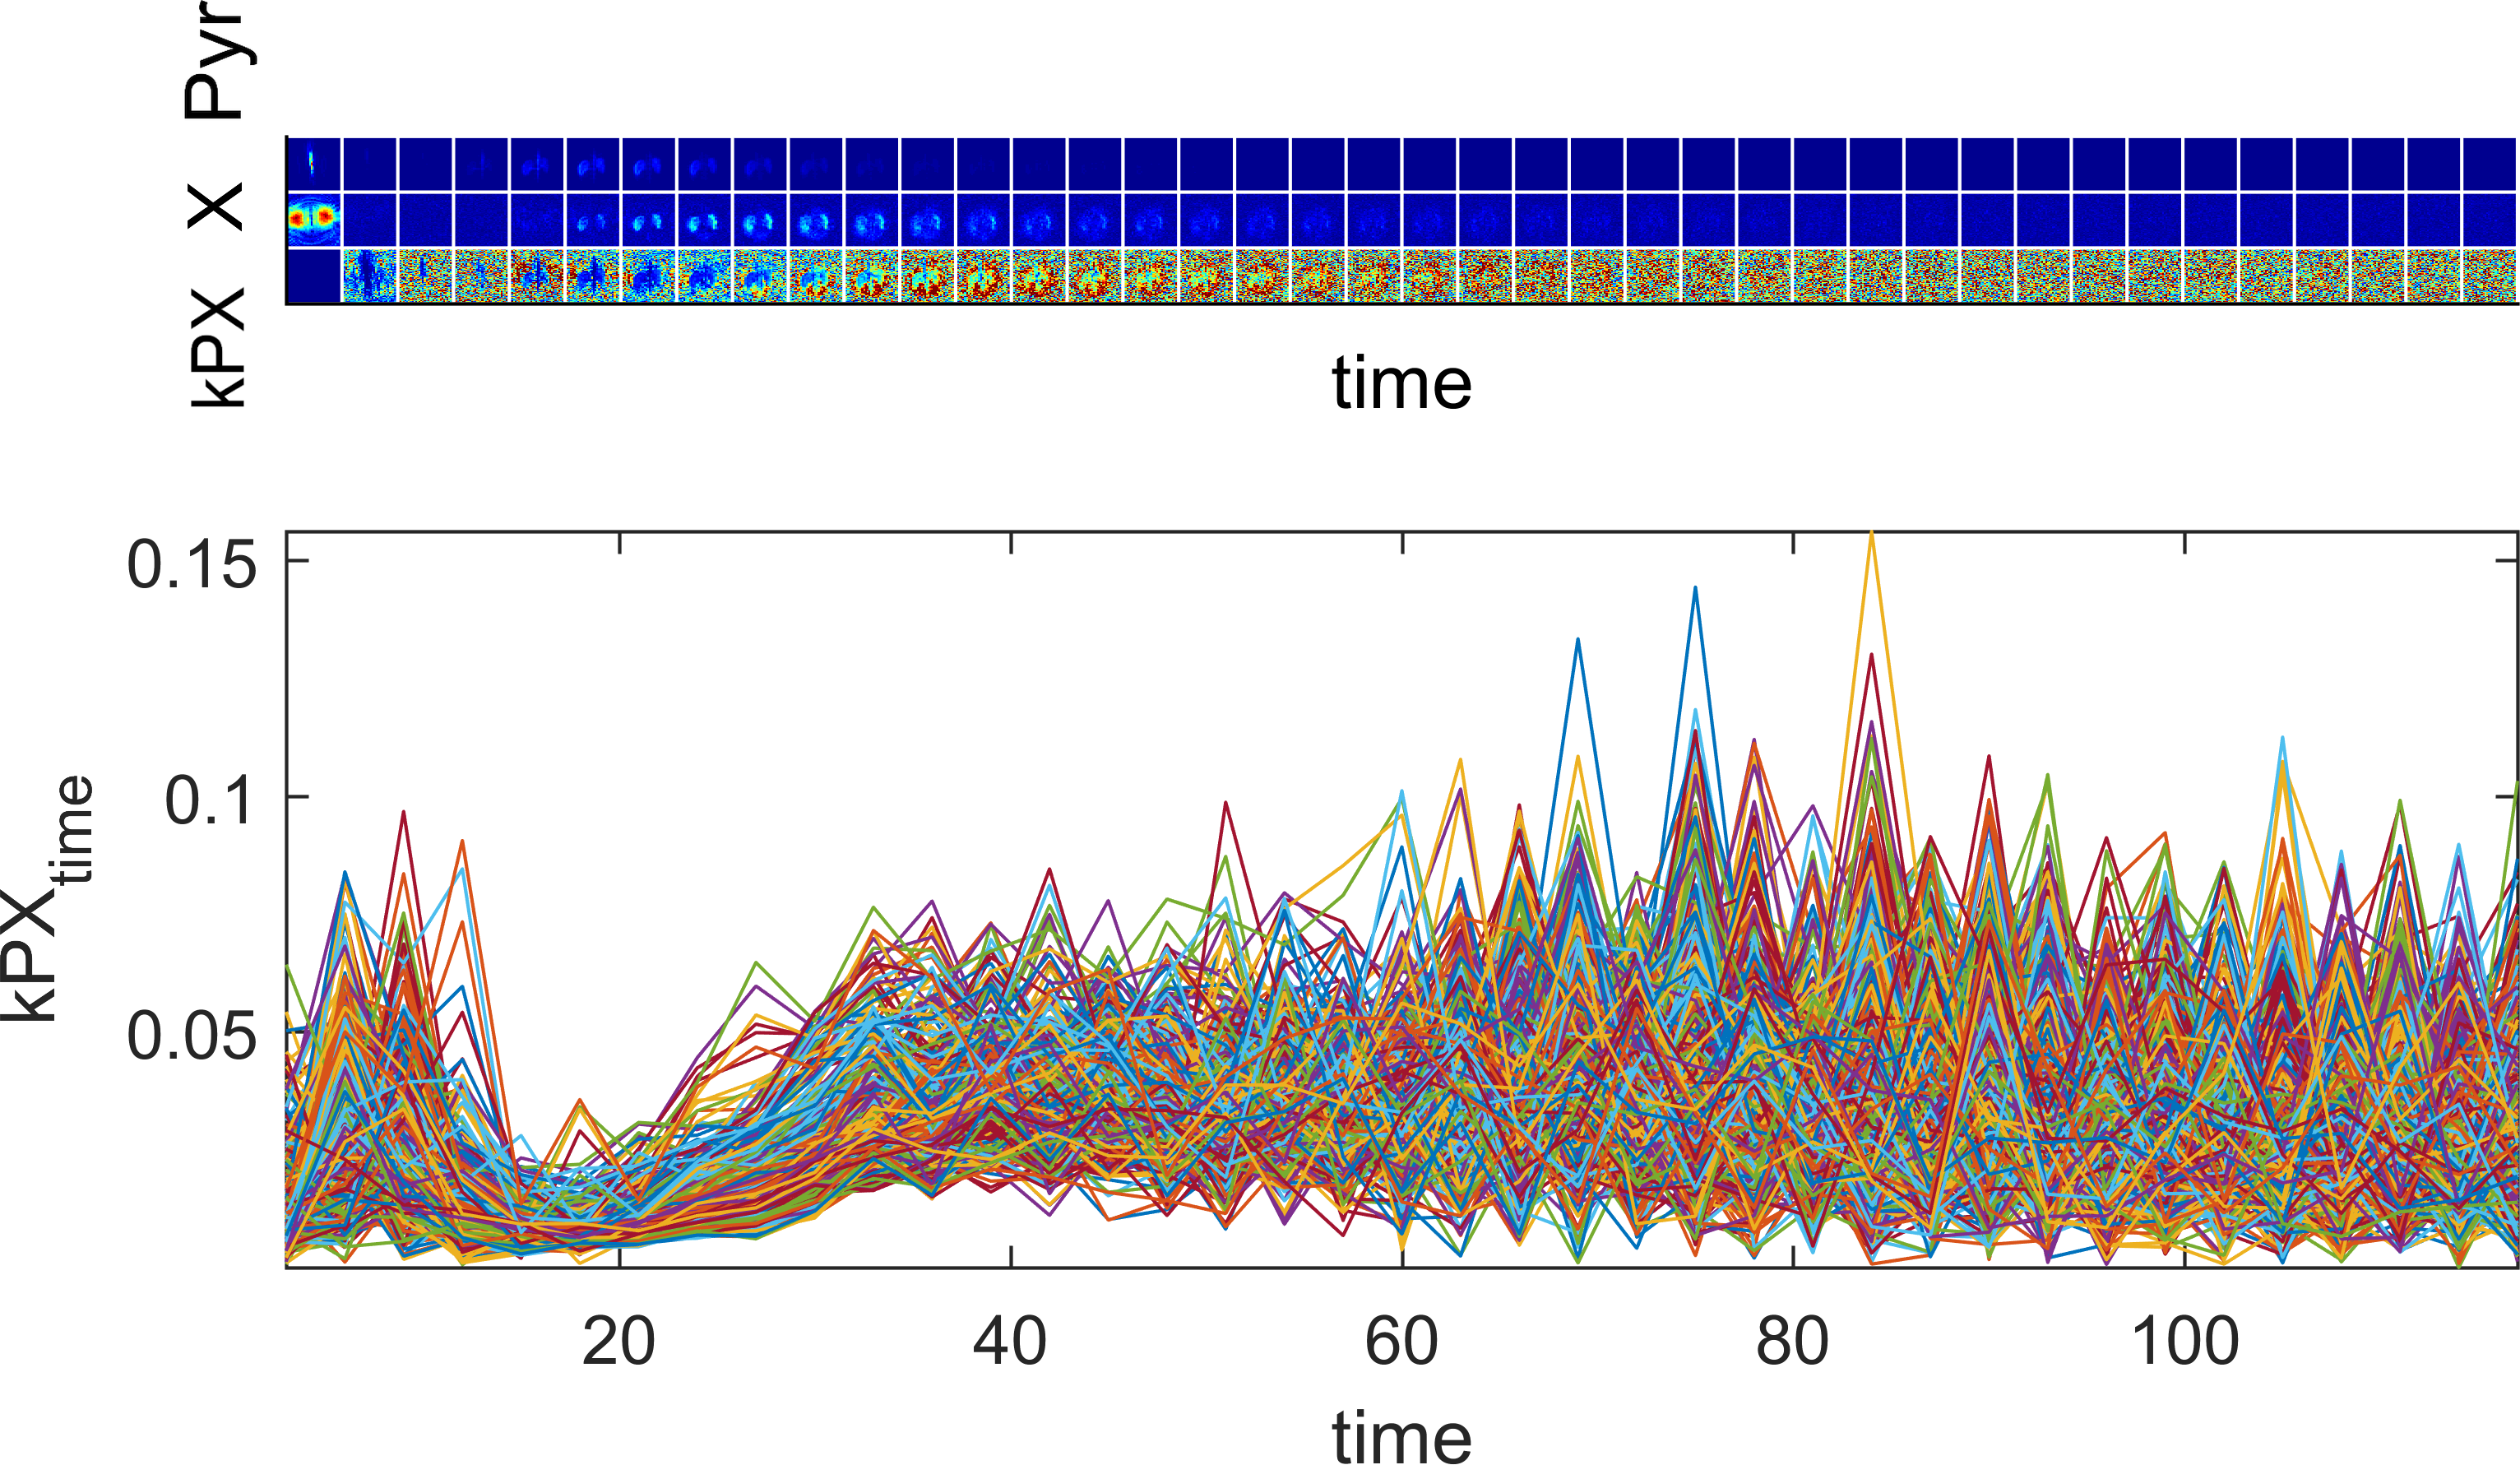
Saturation-Recovery: The initial part of a typical metabolic time course of Pyr and its downstream metabolites is dominated by conversion, while the later part is dominated by relaxation effects. Exciting metabolite X with 90° flip angle yields signal for imaging and at the same time saturates it. Hence signal during the next excitation of X stems mainly from fresh conversion, enabling to directly extract the metabolic conversion rate at time point I via the X-to-Pyr ratio according to $$$k_{PX}^i=\frac{P_i}{X_i}$$$. This saturation-recovery measurement is repeated several times as shown in Fig. 1, hence measuring the conversion rate $$$k_{PX}^i$$$ temporally resolved.
Michaelis-Menten: Saturation effects lead to dose-dependent variations of the
metabolic exchange rate, which can be modelled by Michaelis-Menten according to
Eq. 3 in [5] $$$k_{PX}=\frac{Vmax}{KM+Dose_P}$$$, where $$$Vmax$$$
denotes the maximum reaction velocity, $$$Km$$$
the Michaelis constant and $$$Dose_P$$$ the administered Pyr dose. For a saturated Pyr system, $$$k_{PX}^i$$$ temporarily drops when the bolus arrives, but quickly recovers to
its equilibrium constant, where the dose effects are negligible (Figs. 1 and 2).
The exchange rate during equilibrium (in units [s-1]) independent of
dose effects is given by $$$k_{PX}=\frac{Vmax}{KM+\lambda}$$$, where $$$Dose_P \ll KM$$$ is neglected and $$$\lambda$$$ is a
(small) regularisation term to prevent division by zero. $$$Vmax$$$ and $$$KM$$$
(in the same (arbitrary) units as the acquired metabolite images) can be
extracted from a saturation-recovery experiment according to Eqs. 3 and 4 in
[6] $$$X_i=\frac{tm}{\cos \theta_P} Vmax \frac{P_i}{KM+P_i}$$$, where $$$tm$$$ denotes
metabolite repetition time, $$$\cos \theta_P$$$
the flip angle of Pyr, $$$X_i$$$
and $$$P_i$$$ the time-resolved
metabolic images. Back-conversion and relaxation effects are neglected.
Reformulating this equation leads to a standard linear least-squares fit.
Experimental: Four Fischer rats with subcutaneous MAT B III tumours received injections of 2.5ml/kg 80mM [1-13C]pyruvate, while 12 pigs received a dose of a 0.93ml/kg (heart) and 0.7ml/kg (kidney) 195mM Pyr. Measurements were performed on 3T whole-body scanners (HDx and MR750, GE Healthcare, Milwaukee, WI). A spectral-spatial pulse in combination with a single-shot spiral readout was used to acquire metabolic images in the rats, iterating through four chemical-shifts (lactate-pyruvate- bicarbonate-alanine) and four slices in subsequent excitations (TR=1s, tm=4s, $$$\theta_P$$$=15°, $$$\theta_X$$$=90°; 45ms spiral with FOV=8cm, 32×32 nominal and 16×16 real matrix size). In the pigs, the spectral-spatial pulses were iterated in a single slice through six difference chemical shifts (lactate-pyruvate-bicarbonate-pyruvate-alanine-pyruvate) to measure more of the pyruvate dynamics (TR=0.5s, tm=3s, $$$\theta_P$$$=8°, $$$\theta_X$$$=90°; 45ms spiral with FOV=30-32cm, 75×75 nominal and 38×38 real matrix size).
Results and Discusion
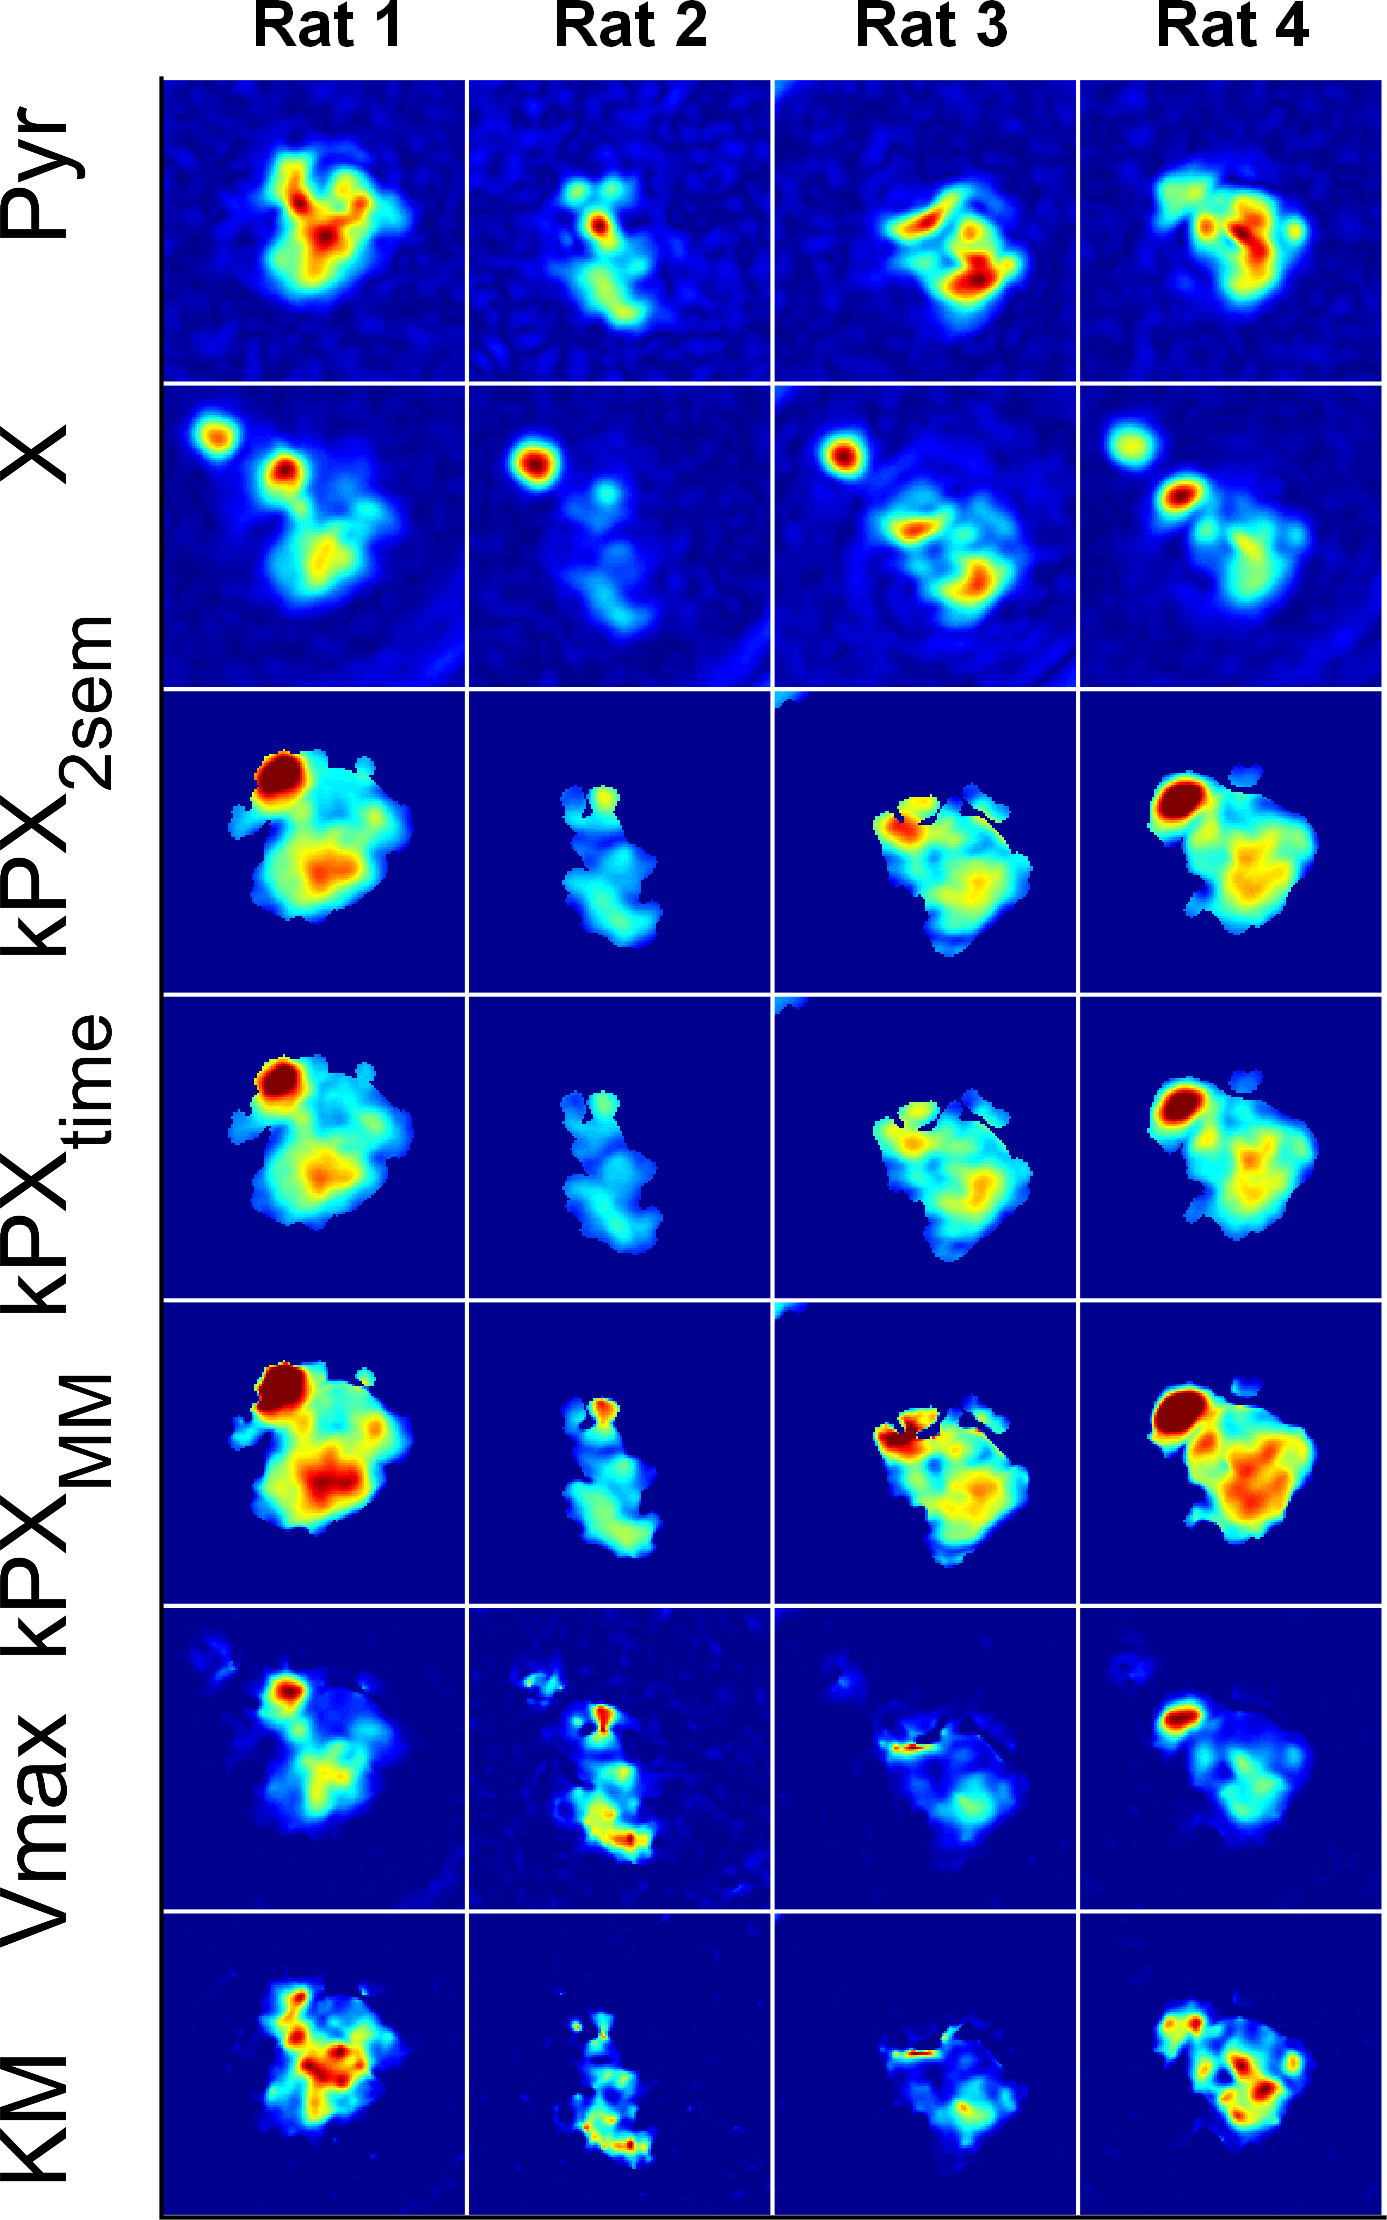
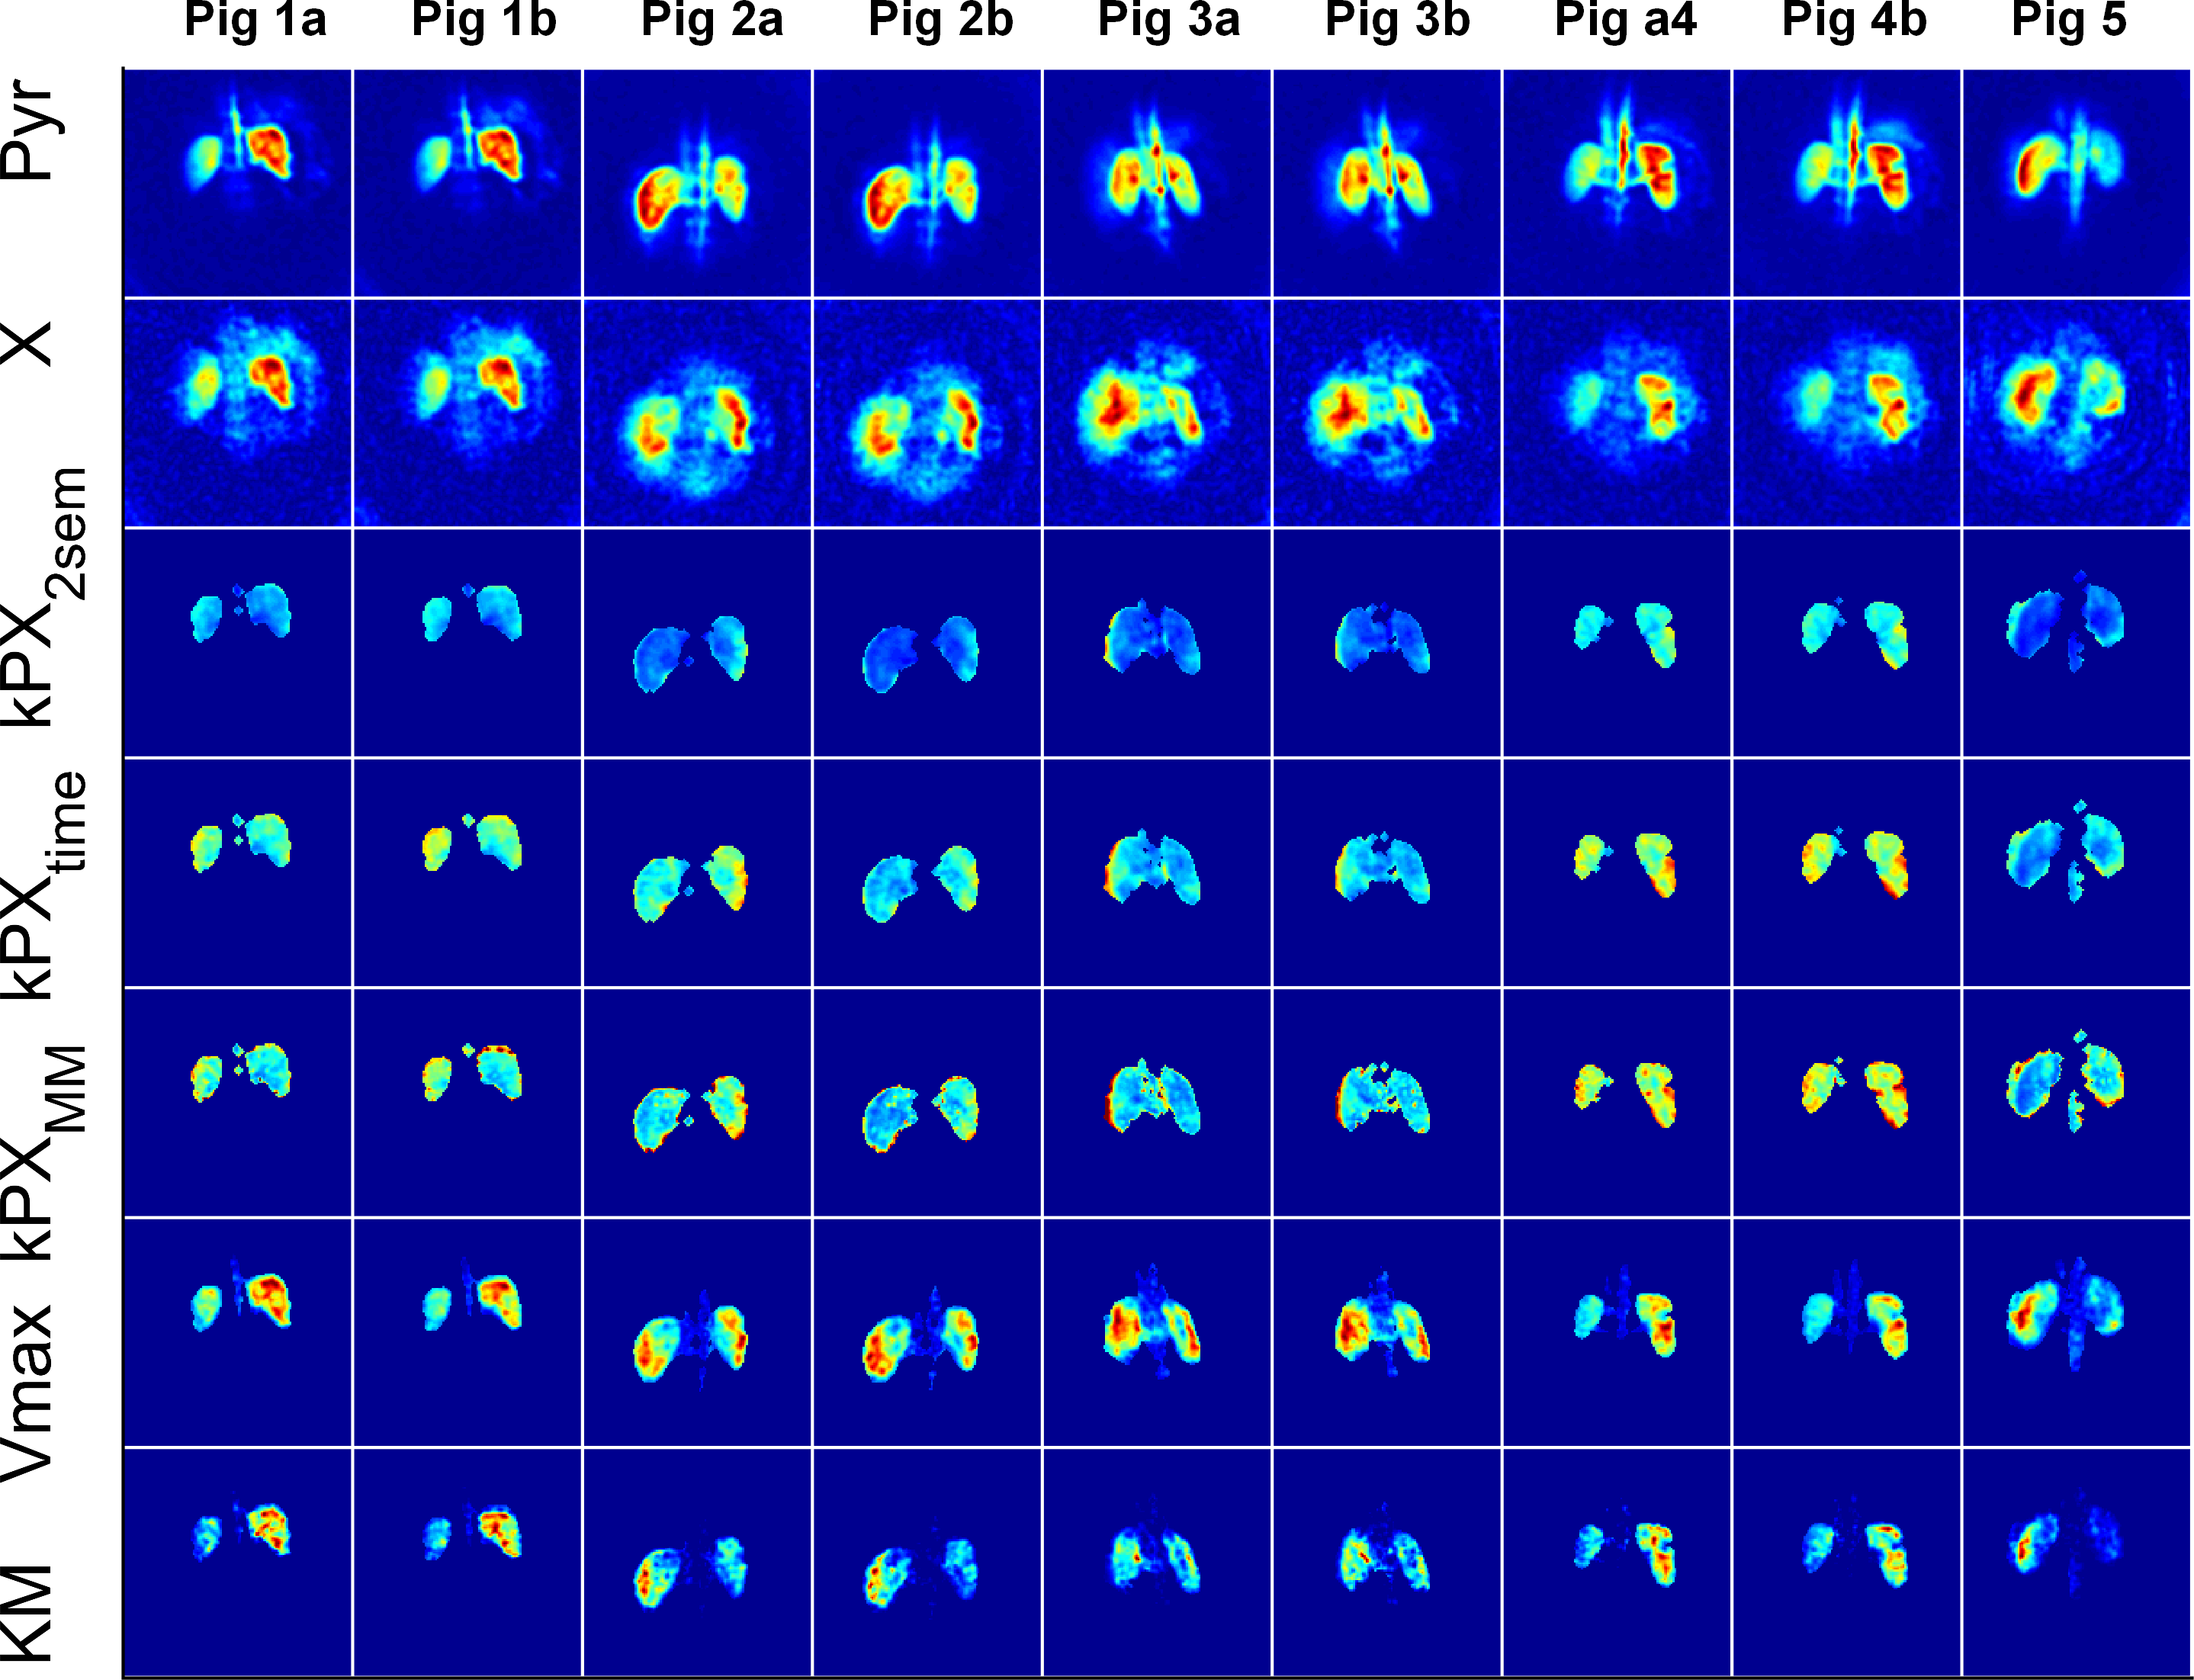
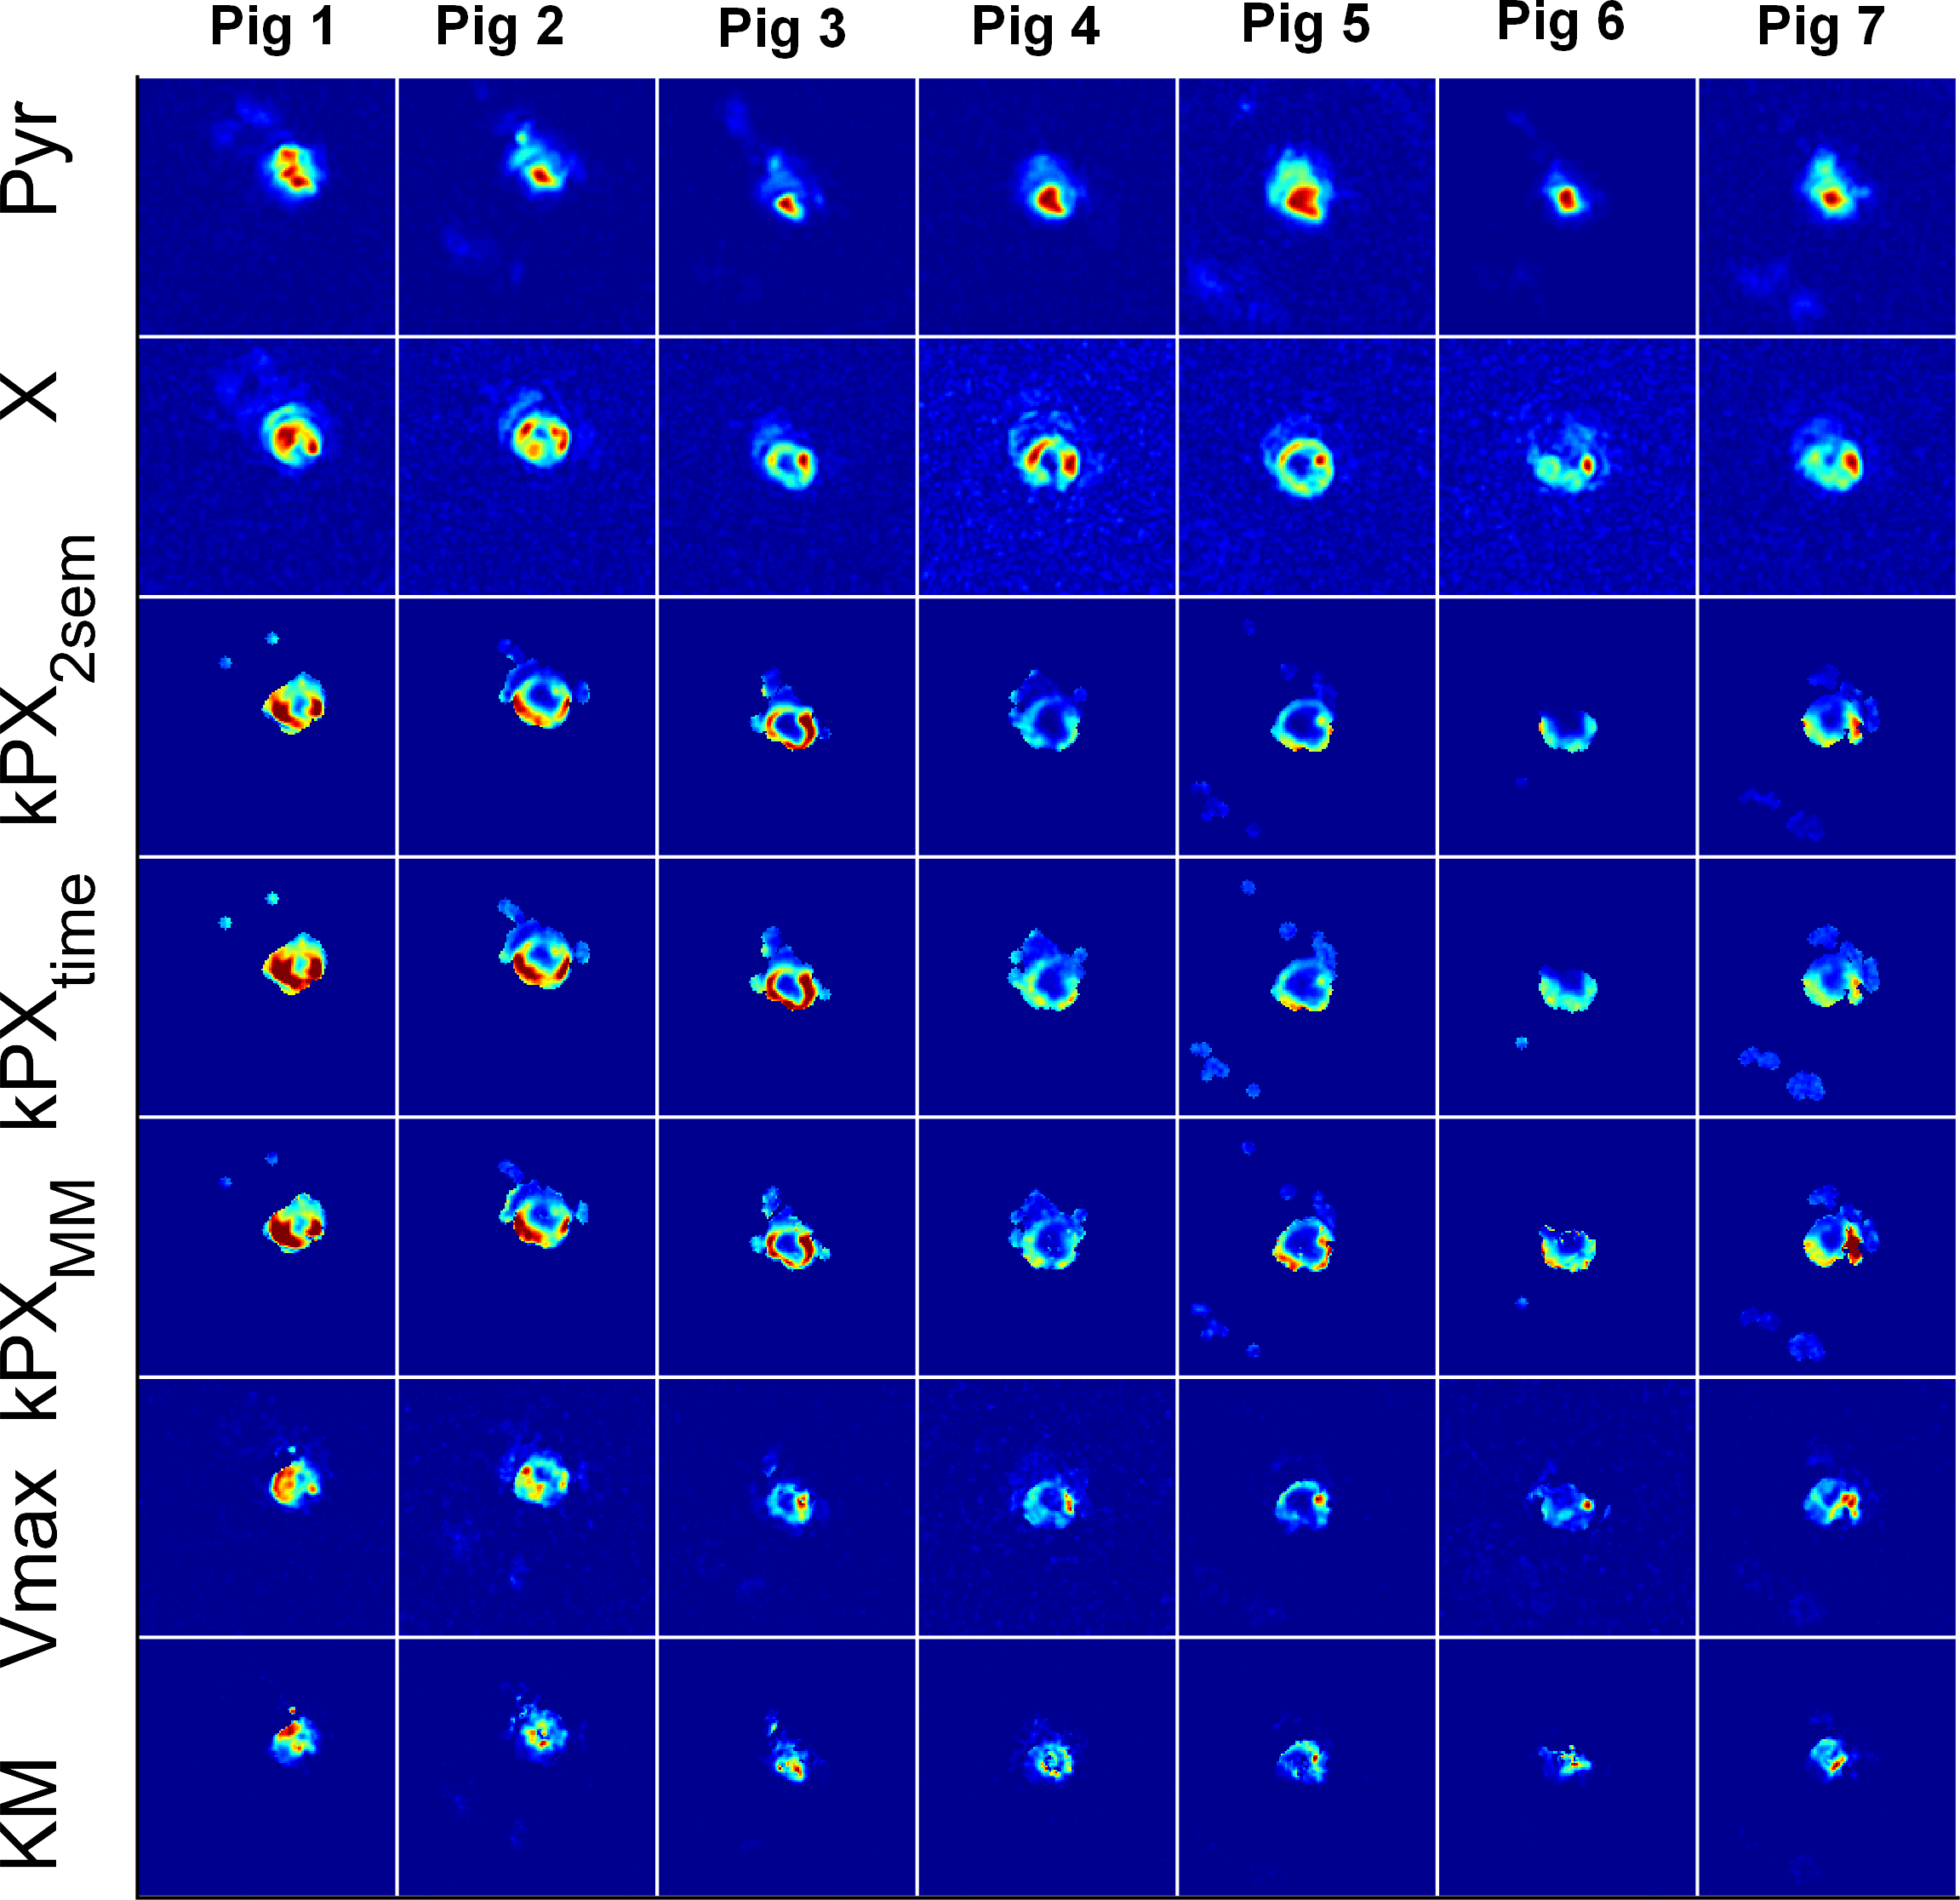
Apparent metabolic exchange rate maps of all measured (and not just selected “typical”) rat tumours, pig kidneys and pig hearts are shown in Figs. 3 to 5 for saturation-recovery fitted with Michaelis-Menten ($$$kPX_{MM}$$$) and the two-site exchange model ($$$kPX_{2SEM}$$$). Exchange rates are higher with Michaelis-Menten, which is expected as saturation effects lead to a temporary drop in $$$k_{PX}$$$.
Extensive simulations were performed with the forward model (Fig.
1) using both Michalis-Menten and two-site exchange, and subsequently fitting
it to both models. The characteristic dip in $$$k_{PX}$$$ during bolus arrival is well
represented in the measured data (Fig. 2). The two site-exchange model yields
smaller values in case of an underlying Michalis-Menten simulation, while the
latter is closer to the input values. The Michaelis-Menten model breaks down in
certain instances, leading to negative $$$Vmax$$$
and $$$KM$$$, or large
covariances of the linear least-squares fit. Fitting two-site exchange model
simulations with Michaelis-Menten leads to large covariances. In case of the in
vivo data, fitting results inside the object generally made physically sense
and covariances are reasonably small, indicating that this is indeed a suitable
model for quantifying the data.
Conclusion
Saturation-recovery with spectral-spatial excitation and spiral imaging can measure exchange rates at multiple time steps. In combination with a Michaelis-Menten quantification, apparent metabolic exchange rate maps can be generated independent of saturation effects. This is less of a problem in a well-controlled animal model with a reproducible dose and good perfusion, but most likely will be particularly important for human applications.Acknowledgements
No acknowledgement found.References
[1] Apparent rate constant mapping using hyperpolarized [1-(13)C]pyruvate. Khegai O, Schulte RF, Janich MA, Menzel MI, Farrell E, Otto AM, Ardenkjaer-Larsen JH, Glaser SJ, Haase A, Schwaiger M, Wiesinger F. NMR Biomed. 2014;27:1256-65.
[2] Saturation-recovery metabolic-exchange rate imaging with hyperpolarized [1-13C] pyruvate using spectral-spatial excitation. Schulte RF, Sperl JI, Weidl E, Menzel MI, Janich MA, Khegai O, Durst M, Ardenkjaer-Larsen JH, Glaser SJ, Haase A, Schwaiger M, Wiesinger F. Magn Reson Med. 2013;69:1209-16.
[3] Kinetic modeling of hyperpolarized 13C1-pyruvate metabolism in normal rats and TRAMP mice. Zierhut ML, Yen YF, Chen AP, Bok R, Albers MJ, Zhang V, Tropp J, Park I, Vigneron DB, Kurhanewicz J, Hurd RE, Nelson SJ. J Magn Reson. 2010;202:85-92.
[4] Quantification of in vivo metabolic kinetics of hyperpolarized pyruvate in rat kidneys using dynamic 13C MRSI. Xu T, Mayer D, Gu M, Yen YF, Josan S, Tropp J, Pfefferbaum A, Hurd R, Spielman D. NMR Biomed. 2011;24:997-1005.
Figures
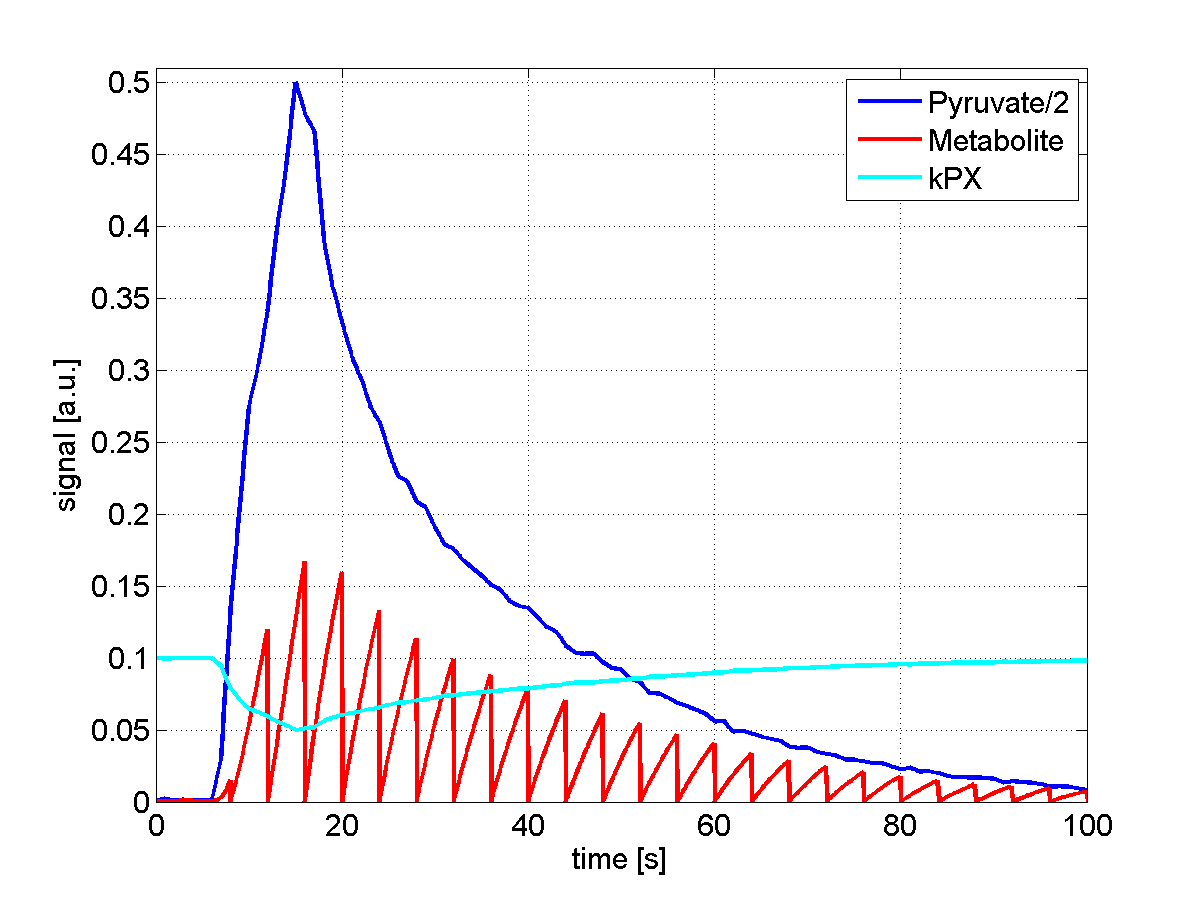
Fig. 1: Forward Michaelis-Menten simulation. The input function (blue curve) is a typical
pyruvate signal measured in rats averaged over multiple slices. The conversion to downstream metabolite X (red curve) is simulated with the Michaelis-Menten equation in a saturation-recovery experiment (tm=4s, T1=20s, Vmax=0.1, KM=1). The time-resolved conversion rate is calculated according to $$$k_{PX}^i=\frac{P_i}{X_i}$$$. Saturation
effects lead to a temporary drop in exchange rate $$$k_{PX}^i$$$ at bolus arrival, which quickly recovers.