4292
Multi-Slice Correction for Metabolic Rate Quantification of Hyperpolarized Pyruvate1Imaging Physics, MD Anderson Cancer Center, Houston, TX, United States
Synopsis
Due to the non-renewable nature of
Introduction
The ability to image metabolic rates non-invasively with hyperpolarized pyruvate is currently being investigated for multiple disease states, including oncology1,2. In the setting of cancer, complete organ coverage is often critical. Therefore, many studies use contiguous multi-slice acquisition. Deviations from the ideal slab excitation will result in unexpected signal evolution that could bias metabolic quantification3,4. In this work, a correction algorithm is used that accounts for multiple slices during pharmacokinetic analysis and improves metabolic rate quantification.Methods
To account for slice profile effects, the slice was decomposed into 64 sub-slices. The fit was performed for each sub-slice using the expected excitation angle determined from the slice profiles as shown in Figure 1. To account for excitation losses form the adjacent slices, magnetization losses were also calculated for every excitation not just those for the slice being fit. Essentially, the fitted data set was expanded by a factor of (n x m), where n is the number of sub-slices used for fitting (64 in this case) and m is the number of acquired slices (3 in this case).
A multi-slice pulse acquire sequenced on a slab of perfused tissue was simulated using a custom-built simulation platform written in MatLab5. The sequence consisted of three 10 mm slices with no space between each slice. The Slices were excited by a 5 kHz, Blackman filtered sinc pulse centered between pyruvate and lactate’s resonance frequency. The slice packet repetition time was 2 seconds with 0.5 seconds between each slice excitation. Resulting signal curves were fit either assuming that each slice received the prescribed excitation angle, or using the proposed method to account for overlapping slice profile effects. Pharmacokinetic analyses assumed that all tissue and relaxation parameters were known exactly except for the two fit variables, metabolic exchange rate (kPL)and a scale factor for the tissue arterial input function. Errors in were calculated as the difference between the fitted kPL and the kPL used during simulation.
Results
Figure 2 shows the magnetization evolution demonstrating that slice excitation results in excess signal from the slice penumbra, as well as how excitation from adjacent slabs can impact magnetization. The additional signal from the slice penumbra is most pronounced for the lactate signal which builds up over time from chemical exchange. Slice profile asymmetry is a result of both cross-talk between slices as well as the offset between the pyruvate and lactate slices.
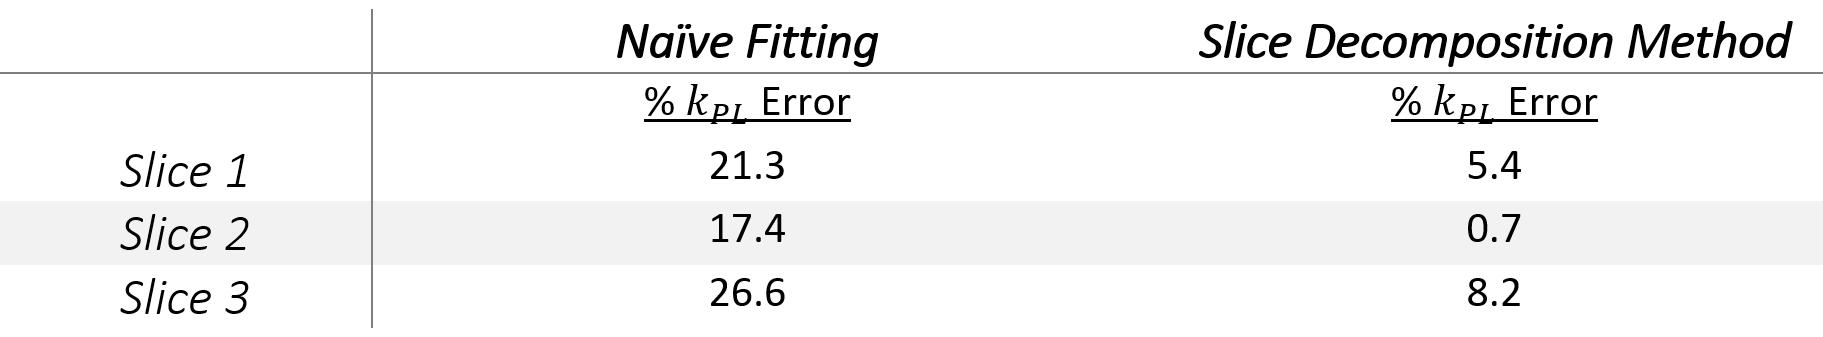
The signal curves and pharmacokinetic fits for naïve and multi-slice decomposed fitting are shown in Figure 3 and fit values are shown in Table 1. The naïve fitting results in metabolic overestimation of about 20%, particularly in the slices on the edge of the slice packet. Using the slice decomposition method, the overestimation in kPL is mostly eliminated; the central slice which had an error of less than 1%.
Discussion
These simulation studies suggest that the cumulative effect of serial slice selective excitation and resulting dynamic slice profile can deteriorate kPL accuracy. Increased kPL arises from an increase in lactate signal from the slice penumbra, and slice offset while slice cross-talk likely reduces the lactate signal. The slice correction method assumes that the organ is homogeneous along the slice direction which will not always be the case, especially for larger organs. The performance of this technique in the presence of tissue variations along the slice select direction is an area of ongoing investigation. While the slice decomposition method described above will lead to increased calculation times, it was shown to improve kPL accuracy using simulation data.Conclusion
While this work focused on slice selective spectroscopy, these effects should directly translate into slice selective imaging strategies. Future work will focus on an analysis of more advanced excitation pulses which could be designed to reduce the slice penumbra and spectral-spatial excitations which could eliminate the chemical shift offset. Overall these results suggest that dynamic hyperpolarized signal is sensitive to the slice profile for multi-slice acquisition and the proposed correction method can improve metabolic quantification.Acknowledgements
This work was supported in part by the National Cancer Institute of the National Institutes of Health (R01CA2111150), the Cancer Prevention and Research Institute of Texas (RP14002-P5, RP140106, RP170366), and GE Healthcare. The authors acknowledge the Texas Advanced Computing Center (TACC) at The University of Texas at Austin for providing the Lonestar5 HPC resource that has contributed to the research results reported within this work. URL: http://www.tacc.utexas.eduReferences
1. Nelson, S. J. et al. Metabolic imaging of patients with prostate cancer using hyperpolarized [1-(1)(3)C]pyruvate. Sci Transl Med 5, 198ra108, doi:10.1126/scitranslmed.3006070 (2013).
2.Kurhanewicz J, Vigneron D, Bankson J, Brindle K, Cunningham C, Keshari K, Kjaer A, Laustsen C, Mankoff D, Nelson S, Pauly J, Lee P, Ronen S, Tyler D, Rajan S, Spielman D, Wald L, Zhang X, Malloy C, Rizi R. Hyperpolarized 13C MRI: Path to Clinical Translation in Oncology. Neoplasia, forthcoming.
3. Deppe, M. H., Teh, K., Parra-Robles, J., Lee, K. J. & Wild, J. M. Slice profile effects in 2D slice-selective MRI of hyperpolarized nuclei. J Magn Reson 202, 180-189, doi:10.1016/j.jmr.2009.11.003 (2010).
4. Gordon, J. W. et al. Mis-estimation and bias of hyperpolarized apparent diffusion coefficient measurements due to slice profile effects. Magn Reson Med 78, 1087-1092, doi:10.1002/mrm.26482 (2017).
5. Walker, C. M., Chen, Y., Lai, S. Y. & Bankson, J. A. A novel perfused Bloch-McConnell simulator for analyzing the accuracy of dynamic hyperpolarized MRS. Med Phys 43, 854-864, doi:10.1118/1.4939877 (2016).
Figures