4288
Data-driven Nyquist ghost correction for hyperpolarized 13C EPSI and EPI1Physical Sciences, Sunnybrook Research Institute, Toronto, ON, Canada, 2Department of Neurology, University of New Mexico, Albuquerque, NM, United States, 3Department Physics and Astronomy, University of New Mexico, Albuquerque, NM, United States, 4Department Electrical and Computer Engineering, University of New Mexico, Albuquerque, NM, United States, 5Department of Electrical Engineering, Center for Hyperpolarization in Magnetic Resonance, Technical University of Denmark, Lyngby, Denmark, 6Danish Research Centre for Magnetic Resonance, Centre for Functional and Diagnostic Imaging and Research, Copenhagen University Hospital Hvidovre, Copenhagen, Denmark, 7Department of Clinical Physiology, Nuclear Medicine & PET and Cluster for Molecular Imaging, Rigshospitalet, University of Copenhagen, Copenhagen, Denmark, 8Department of Medical Biophysics, University of Toronto, Toronto, ON, Canada
Synopsis
Echo-planar readout is often used in hyperpolarized imaging because of its rapid sampling of the k-space. This scheme, however, suffers from Nyquist ghosting artifacts. We present a data-driven approach to correct Nyquist ghosting in hyperpolarized 13C-EPSI and EPI . The method exploits the sparsity of the spectra in hyperpolarized 13C imaging spectroscopy, and estimates the phase discrepancies from the odd and even data in 13C-EPSI. The method was demonstrated in phantoms and in vivo. We show that it performs better than the 1H reference-based reconstruction, and it eliminates the need for reference scans, which may be an unnecessary source of error.
Introduction
Hyperpolarized MRI is often performed using echo planar (EP) trajectories, for example using echo-planar spectroscopic imaging (EPSI) 1 or echo-planar imaging (EPI) 2. The EP readout in these sequences allows rapid and efficient sampling of k-space. Symmetric EP readout typically causes Nyquist ghosting artifacts, which often necessitates a separate reconstruction for the odd and even echo-data at the expense of bandwidth, or reference scans to correct the phase discrepancies between odd and even data. A reference scan is difficult to acquire in the context of hyperpolarized imaging, due to the lack of signal prior to substrate injection, and time constraints after the substrate is injected.
We propose a referenceless calibration method that uses only the 13C-EPSI data after substrate injection, to correct the Nyquist ghosting. Data-driven calibration methods have earlier been applied to correct Nyquist ghosting in 1H-EPI 3-5. Here we exploit the fact that such methods are ideally suited for hyperpolarized 13C imaging due to the spectrum sparsity, and we show that it can be more accurate than approaches that rely on 1H referencing 1,6. This method is extended by using the 13C-EPSI as a reference to correct the ghosting in 13C-EPI.
Method
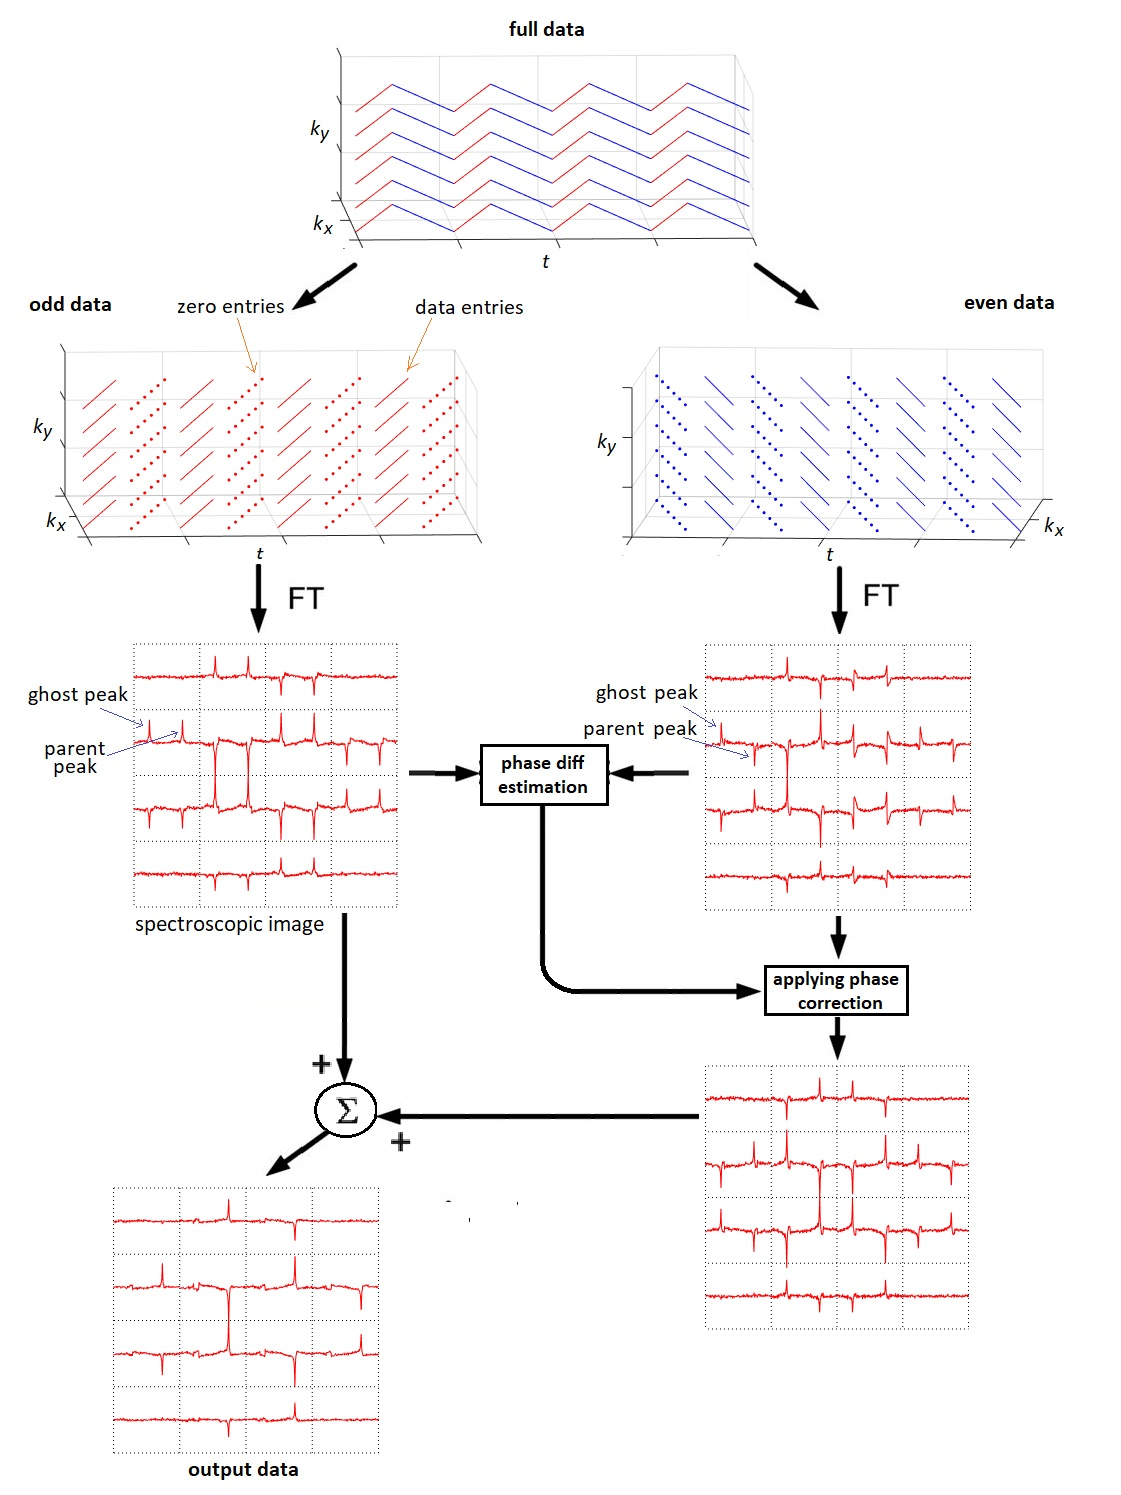
The proposed reconstruction, Fig 1, works by dividing the data into two separate odd and even echo-data matrices. Subsequently, a spatial Fourier transform was applied to obtain odd and even x-y-t matrices. Data from the different gradient polarities are pinned into pre-zeroed arrays with the same size as the original full data. A temporal Fourier transform was applied to the two data sets to obtain two x-y-f arrays. For each x position, the phase correction to the odd echoes that maximizes the integral of the parent peaks at that location was computed, which simultaneously minimizes the ghost peaks.
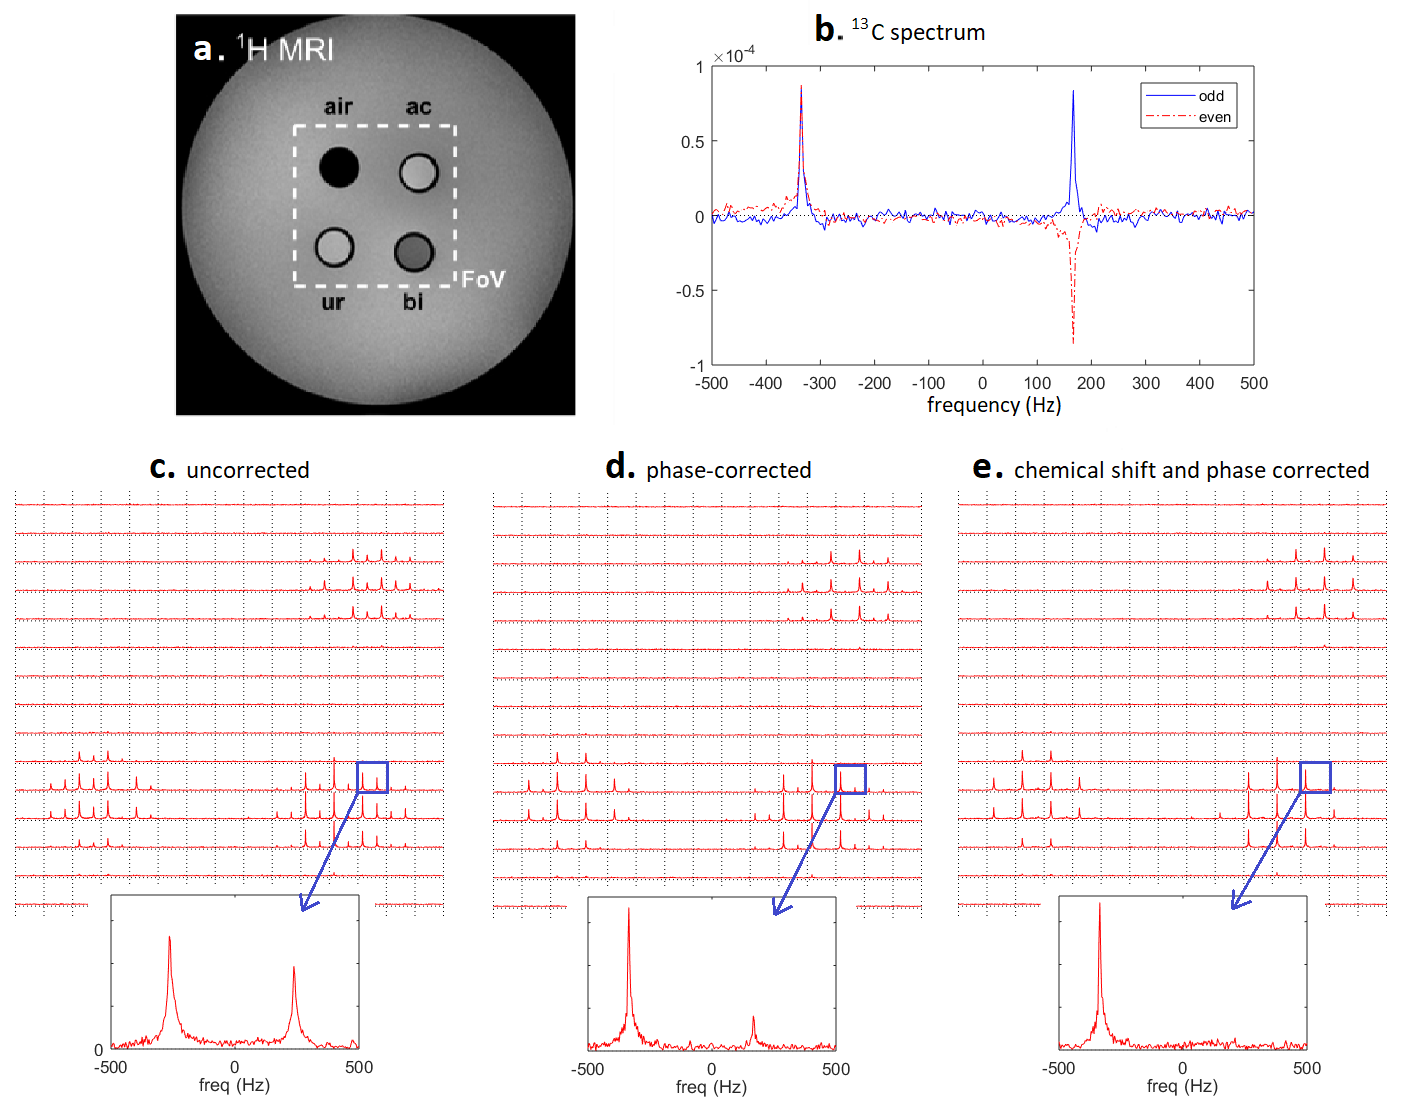
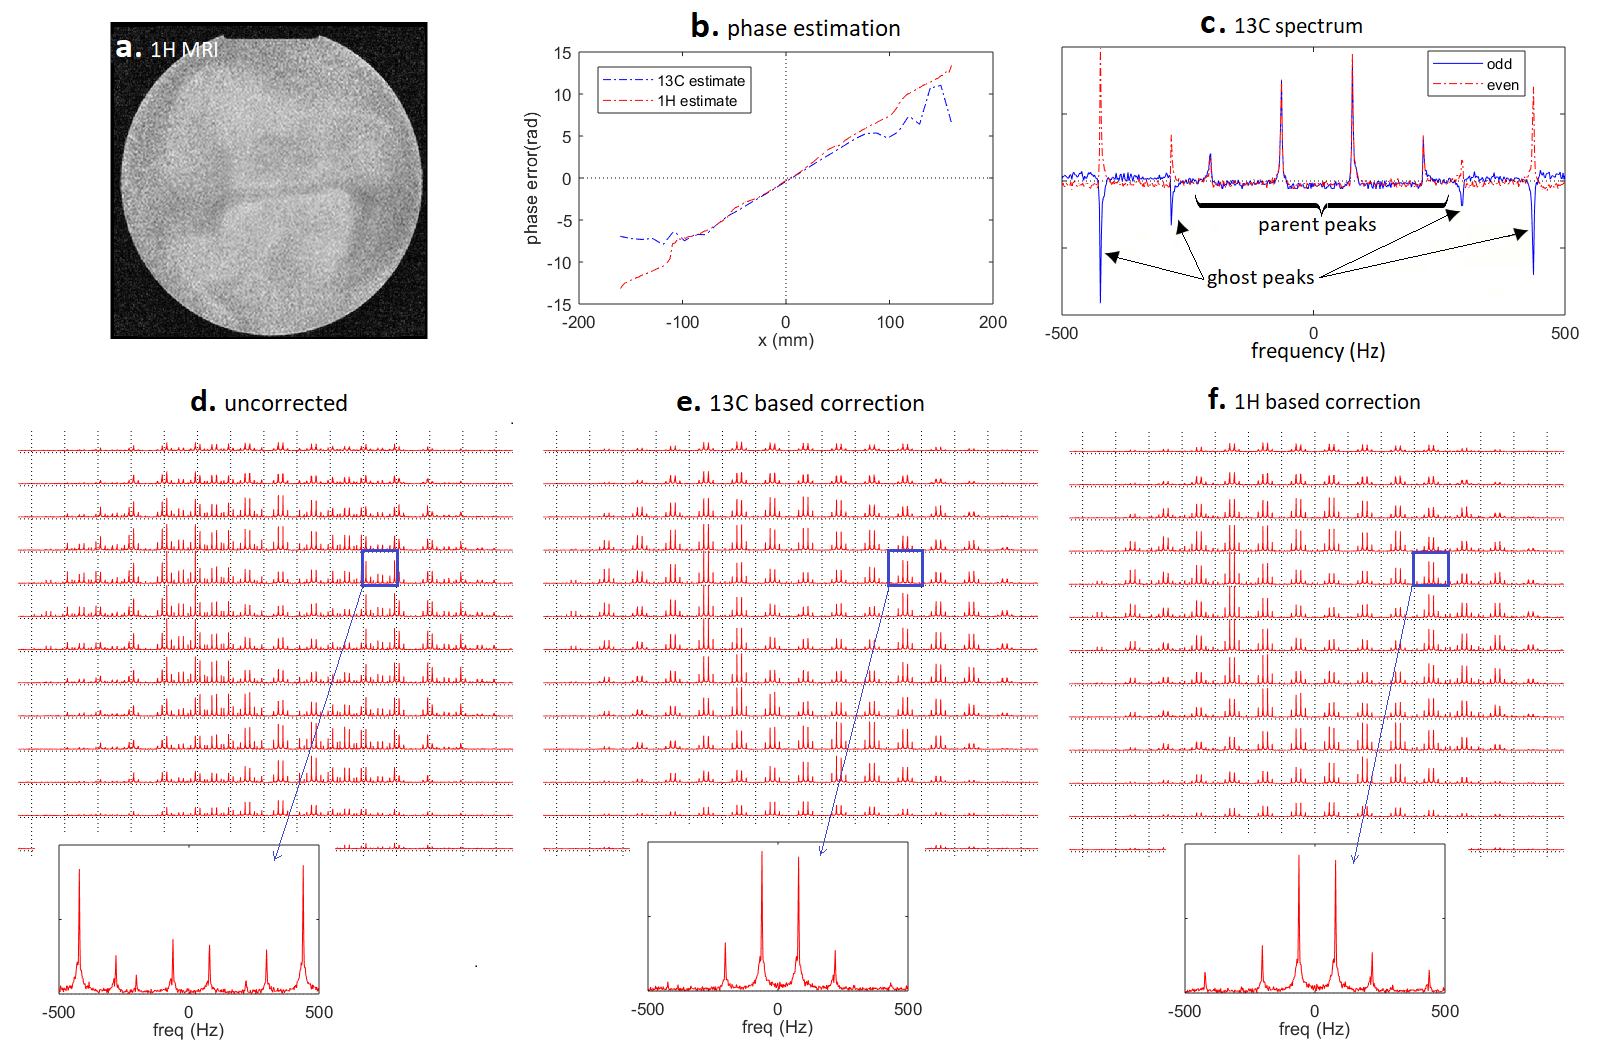
The method was evaluated in two phantoms and in vivo, in a rat after injection of hyperpolarized [1-13C]pyruvate, using mMR-biograph scanner (Siemens Healthcare). The first phantom had multiple cylindrical compartments with 19 mm diameter, filled with 1 M 13C-bicarbonate, [1-13C]acetate, and 13C-urea. The other was a cylindrical phantom with a diameter of 250 mm that contained methanol. The phantoms were imaged with 13C-EPSI using a 270 mm diameter birdcage 13C coil (RAPID Biomedical). The methanol phantom was also imaged using 1H-EPSI with the same EP readout as 13C-EPSI.
The rat data were acquired using a 1H/13C transmit/receive flex coil (RAPID Biomedical; 110-mm diameter loop for 13C and 180 x 244 mm2 butterfly for 1H). A 13C-EPSI scan was acquired, as well as a 13C-EPI scan using spectral-spatial excitation. The two sequences employed the same EP readout gradient. As a demonstration of the flexibility of the proposed method, the phase estimated from EPSI was used to correct the error in the EPI metabolic images.
The level of ghosting was quantified by calculating the average ghost intensity in the image with respect to the average parent intensity.
Results
Fig 2 shows the results of the first phantom experiment. A small residual ghost was still prevalent around the edges after phase correction. This occurred due to the chemical shift displacement in opposite directions for odd and even echoes. The ghosting level was 42.2% in the uncorrected image, 13.5% for phase only correction, and 2.0% when both chemical shift, using the method described in 7, and phase were corrected. The results for the second phantom are shown in Fig 3. The level of ghosting was 66.5% in the uncorrected image, 5.9% in the image with 13C data-driven correction, and 10.2% in the one with 1H reference-based correction.
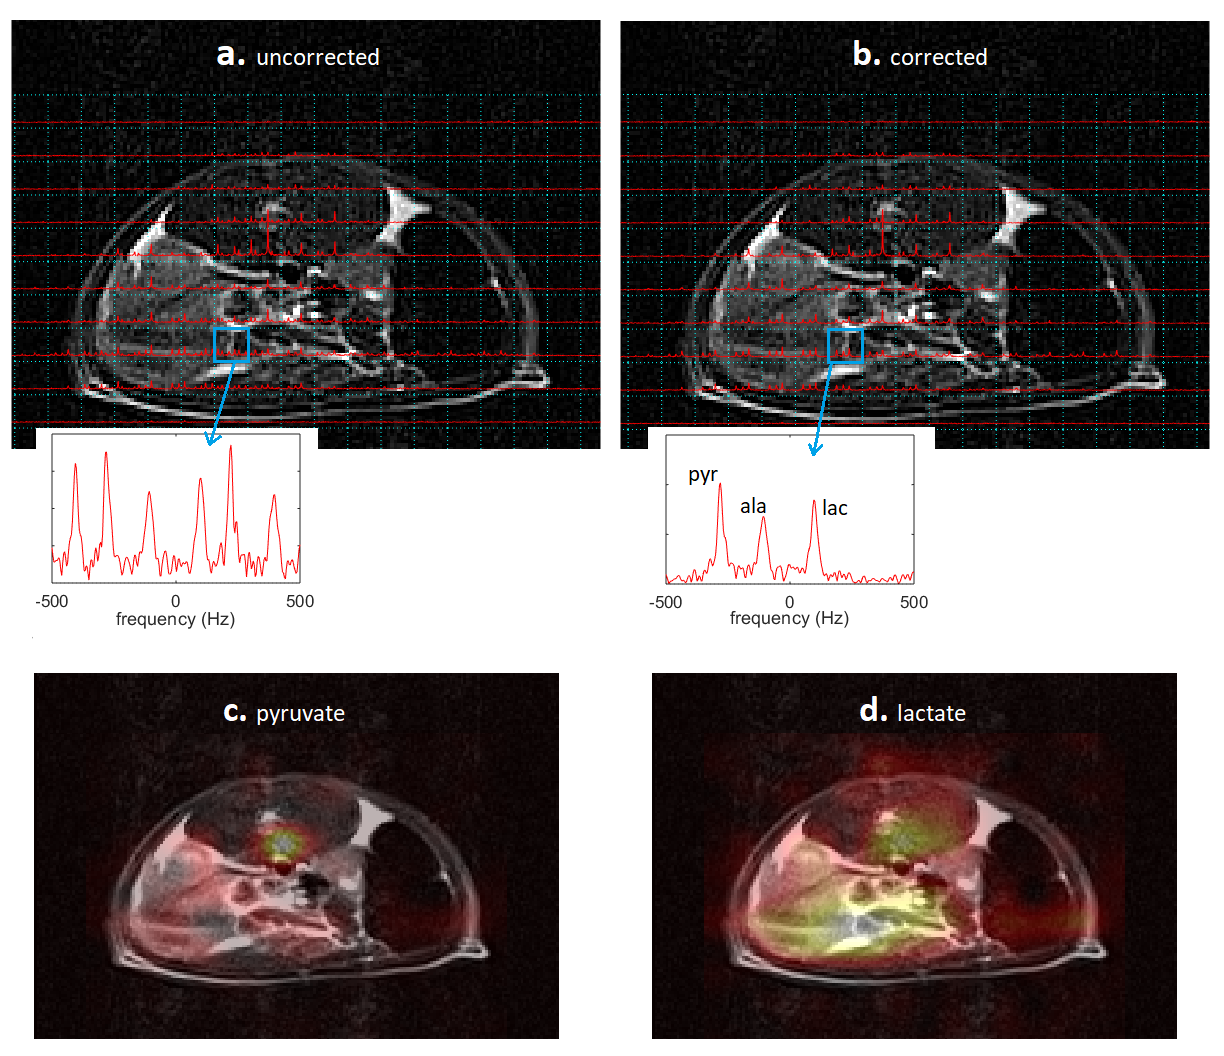
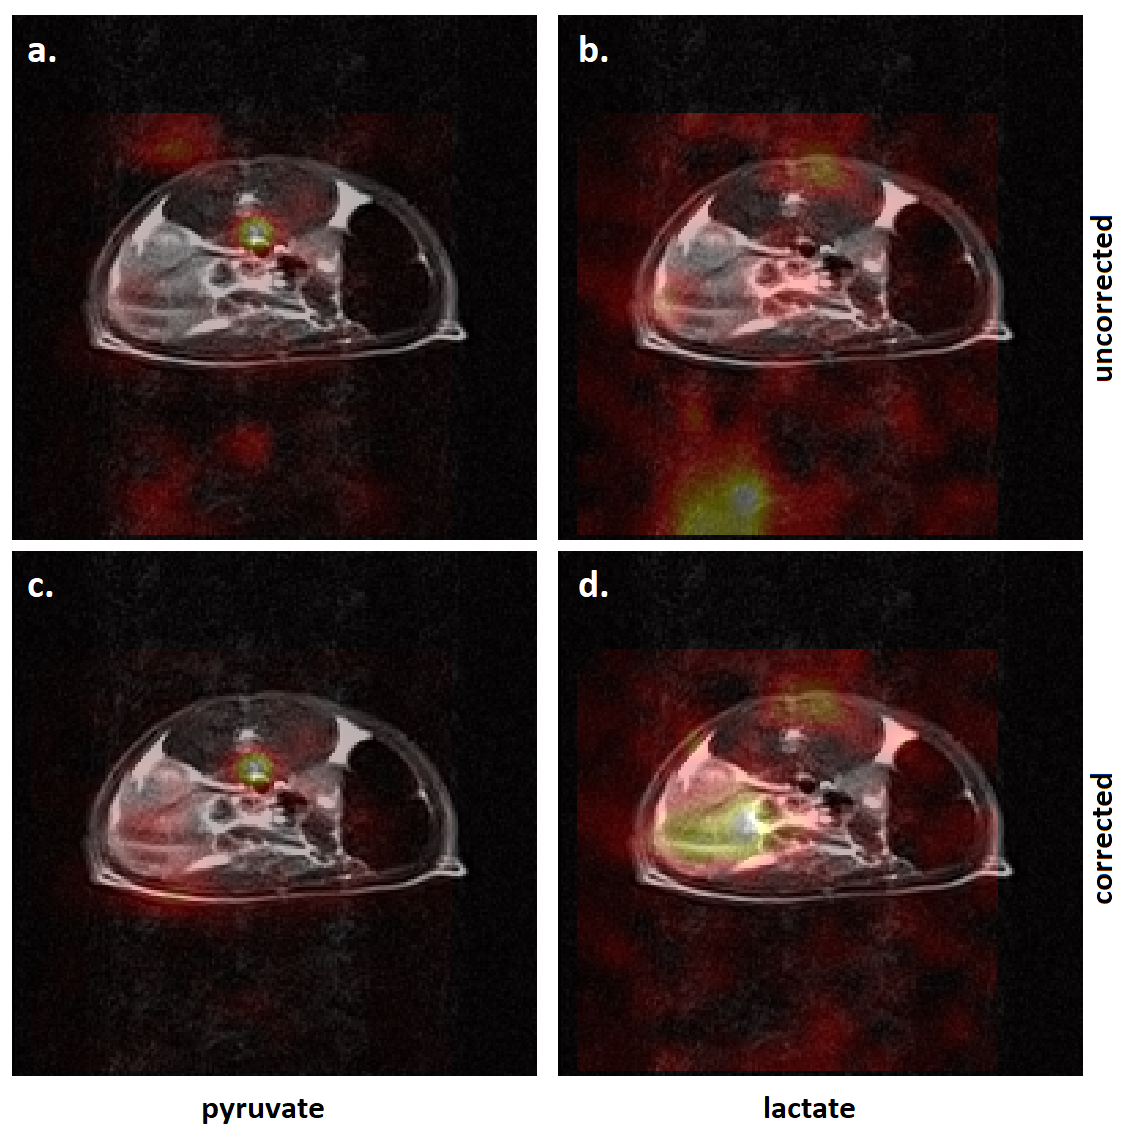
Fig 4 shows the uncorrected and corrected EPSI data acquired in the in vivo experiment and the pyruvate and lactate maps quantified from 13C-EPSI data. Fig 5 shows the pyruvate and lactate maps obtained from EPI acquisition, both corrected and uncorrected.
Discussion
The 13C data-driven reconstruction performed better than 1H reference-based correction. The main advantage of the method proposed is that it eliminates the need for additional scan time which may not be available in hyperpolarization applications. This data-driven approach is also attractive for 13C-EPSI because, unlike in EPI, the locations of parents and ghosts are known a priori along the spectral dimension and therefore there is a well-defined optimization to solve. Also, the sparsity of 13C spectrum makes it easier to ensure that there is sufficient separation between parent and ghost peaks. This is important because the requirement for this approach to work is that the parent and ghost peaks from at least one metabolite do not overlap with other metabolites peaks.Conclusion
We presented a data-driven approach to correct Nyquist ghosting in 13C-EPSI, and we showed that it can be extended to correct ghosting in 13C-EPI.Acknowledgements
No acknowledgement found.References
1. Cunningham CH, Chen AP, Albers MJ, et al. Double spin-echo sequence for rapid spectroscopic imaging of hyperpolarized 13C. J Magn Reson. 2007;187(2):357-62.
2. Gordon JW, Vigneron DB, Larson PE. Development of a symmetric echo planar imaging framework for clinical translation of rapid dynamic hyperpolarized 13C imaging. Magn Reson Med. 2017;77(2):826-32.
3. Buonocore MH, Gao L. Ghost artifact reduction for echo planar imaging using image phase correction. Magn Reson Med. 1997;38(1):89-100.
4. Foxall DL, Harvey PR, Huang J. Rapid iterative reconstruction for echo planar imaging. Magn Reson Med. 1999;42(3):541-7.
5. Clare S. Iterative Nyquist ghost correction for single and multi-shot EPI using an entropy measure. In Proc Intl Soc Mag Res Med. 2003 (p. 1041).
6. Geraghty BJ, Lau JY, Chen AP, Cunningham CH. Dual-Echo EPI sequence for integrated distortion correction in 3D time-resolved hyperpolarized 13C MRI. Magn Reson Med. 2018;79(2):643-53.
7. Eldirdiri A, Posse S, Hanson LG, et al. Development of a Symmetric Echo-Planar Spectroscopy Imaging Framework for Hyperpolarized 13C Imaging in a Clinical PET/MR Scanner. Tomography. 2018 Sep;4(3):110-122.
Figures