4281
Limits of Kinetic Modeling for Myocardial Infarction and Border Zone Detection Using Hyperpolarized 13C Magnetic Resonance Imaging1Institute for Biomedical Engineering, University and ETH Zurich, Zurich, Switzerland
Synopsis
Kinetic modeling of hyperpolarized [1-13C]-pyruvate imaging allows quantification of cardiac metabolism. In this work, SNR is identified as a limiting factor for the detection of focal lesions and border zones with hyperpolarized 13C imaging under typical in-vivo conditions. Moreover, limits are determined with respect to SNR and resolution requirements. Based on calculated maps of kinetic conversion rates, infarcted areas with transmuralities ≥ 33% are distinguishable from remote myocardium even at a modest resolution of 10mm, while altered metabolism in the border zone (area-at-risk) is not detectable, even at higher resolutions of 5mm.
Introduction
Cardiac metabolism of various pathologies has been probed using hyperpolarized 13C imaging in animal models1 and recent trials indicate the feasibility of the method in humans2. Despite the advances, hyperpolarized 13C imaging is inherently limited by the low signal-to-noise ratio (SNR) in-vivo. For better interpretability, quantitative assessment of cardiac metabolism by kinetic modeling is desired.
In
the present work, a comprehensive simulation framework for hyperpolarized [1-13C]-pyruvate
imaging was developed to generate synthetic image series that closely reflect
in-vivo data with high physical and physiological accuracy. Using this data, a
sensitivity analysis to establish the limits in terms of SNR and image
resolution as well as ischemic transmurality and circumferentiality for the
detection of infarcted areas (IA) and the salvageable area-at-risk (AAR) in
myocardial infarction is performed. Building on previous work3, the analysis is expanded towards kinetic
modeling of metabolic conversion of [1-13C]-pyruvate under realistic
imaging conditions derived from in-vivo data.
Methods
A simulation framework (Fig-1) was developed and implemented to generate synthetic echo-shift encoded image series of metabolic signals. In addition to partial volume effects in three spatial dimensions ($$$\vec{x}$$$), the framework considers magnetic field inhomogeneities ($$$B_0$$$), transversal ($$$T_2^*$$$) and longitudinal ($$$T_1$$$) relaxation, spectral-spatial excitation4 ($$$\alpha$$$) and noise. For each dynamic $$$d$$$, the k-space is sampled along an arbitrary gradient-derived EPI trajectory ($$$\vec{k}$$$) at time points $$$t_s$$$, yielding the encoded signal
$$\vec{s}(\vec{k},d,e)=\sum_{\vec{x}}\left(\sum_m{}\rho(\vec{x},d,m)\cdot{}e^{j2\pi{}\cdot{}f(m)\cdot t(e) }\cdot{}e^{-\frac{t(e)}{T^{*}_2(\vec{x},m)}}\cdot{}e^{-\frac{t_{Dyn}(d)}{T_1(m)}}\cdot\sin\left(\alpha(\vec{x},m)\right)\cdot\cos\left(\alpha(\vec{x},m)\right)^{e-1}\right)e^{j2\pi\cdot B_0(\vec{x}) \cdot t(e)}\cdot e^{j\vec{k}\vec{x}}$$ where $$$t=t_s+TE$$$ with $$$TE$$$ being the echo time of echo $$$e$$$ and $$$f$$$ denoting the chemical shift of metabolite $$$m$$$.
Metabolite intensities ($$$\rho$$$) are based on myocardial contours from the extended cardiac-torso (XCAT)5 phantom with the right and left ventricular blood pools (RV/LV) as well as the myocardium divided into six segments according to the American Heart Association (AHA).
Dynamic ($$$t_{Dyn}$$$) signals of pyruvate, lactate and bicarbonate were derived using a first-order kinetic model neglecting back-conversion:$$\frac{d}{dt}\begin{bmatrix}P(t)\\L(t)\\B(t)\end{bmatrix}=\begin{bmatrix}-(k_{PL}+k_{PB})&0&0\\k_{PL}&0&0\\k_{PB}&0&0\end{bmatrix}{}\cdot \begin{bmatrix}{}P(t)\\L(t)\\B(t) \end{bmatrix}+\begin{bmatrix}\frac{dP_{myo}(t)}{dt}\\0\\0\end{bmatrix}$$where the myocardial input function $$$P_{myo}(t)$$$ was determined using a perfusion model applied to an in-vivo measured pyruvate signal of the LV.
Rate constants for kPL/kPB were assumed as 0.05s-1/0.03s-1 (remote area, RA), 0.06s-1/0.01s-1 (AAR) and 0.0002s-1/0.0001s-1 (IA), respectively to reflect increased lactate dehydrogenase activity in the AAR.
Image reconstruction of the noisy ($$$\eta$$$) k-space signal ($$$\vec{s}$$$) was performed using a conjugate gradient descent algorithm minimizing$$||E\cdot\vec{I}-(\vec{s}+\eta)||_2^2$$For reconstruction, all parameters in Eq.-1 were considered as known. Realistic B0-maps were simulated and interpolations at target resolution were used for reconstruction.
Rate constants were estimated pixel-wise using a least-squares curve-fit of the signal time curves extracted from the reconstructed images $$$\vec{I}$$$.
The detectability of MI and AAR was determined by comparison of pixel-wise fitted rate constant maps (k-maps), reconstructed images as well as quantitative signal statistics between RA, AAR and MI. Detection limits w.r.t. ischemic expansion were determined for transmuralities of 33%/66%/100% and circumferential IA:AAR sizes of 40%:60%/50%:50%/75%:25%.
Acquisition limits were assessed for noise levels observed in-vivo (SNRLactate=2.1-14.2, SNRBicarbonate=1.3-8.4) and image resolutions of 3mm/5mm/7mm/10mm.
Fitting errors w.r.t. noise-only were analyzed separately with metabolite signals directly simulated from the kinetic model with different SNR values.
Results
Fig-2 plots the relative error for kPL and kPB as a function of respective SNRs. The fundamental accuracy and precision amounts to 7.2+/-6.6% and 9.2+/-7.2% for kPL and kPB at a peak SNR (pSNR) of 7.1/4.2 for lactate and bicarbonate, respectively.
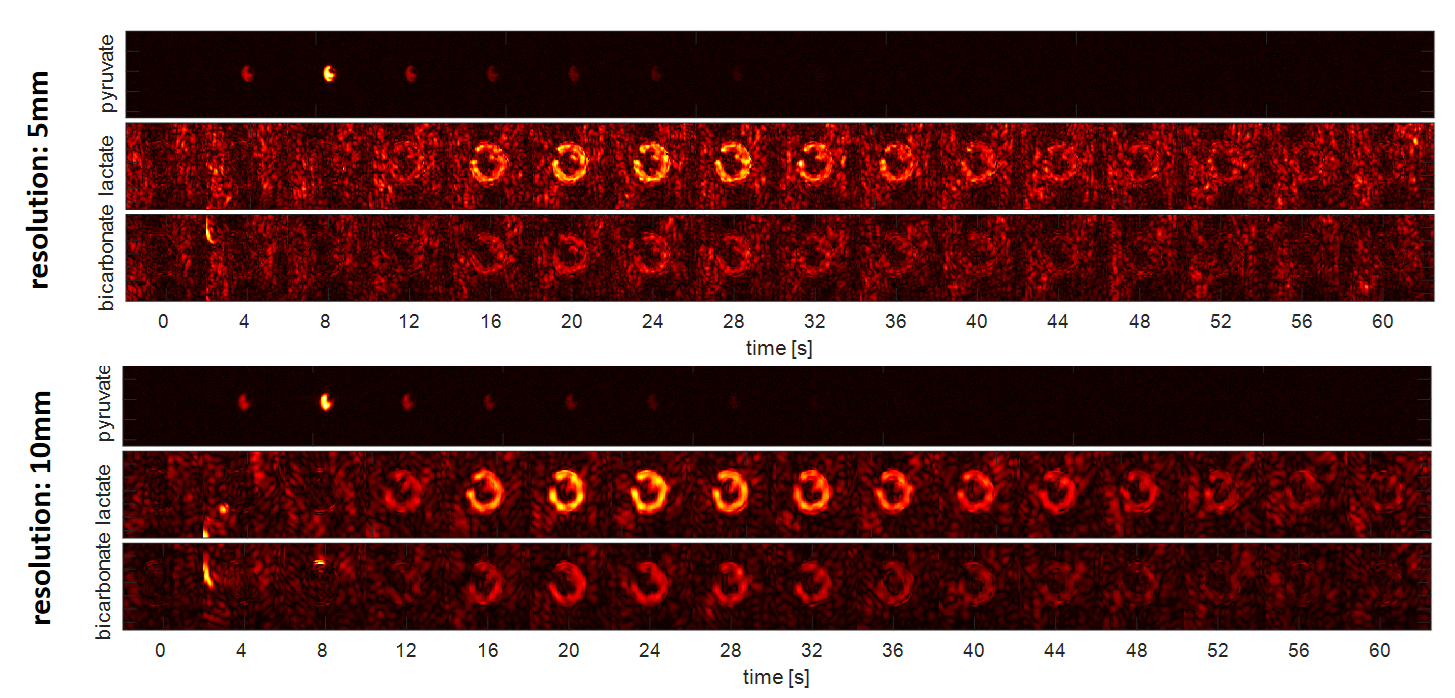
Fig-3 shows reconstructed metabolic image-time [1-13C]pyruvate, [1-13C]lactate and [13C]bicarbonate as obtained for 5mm and 10mm resolutions and lactate/bicarbonate pSNR levels of 7.1/4.2.
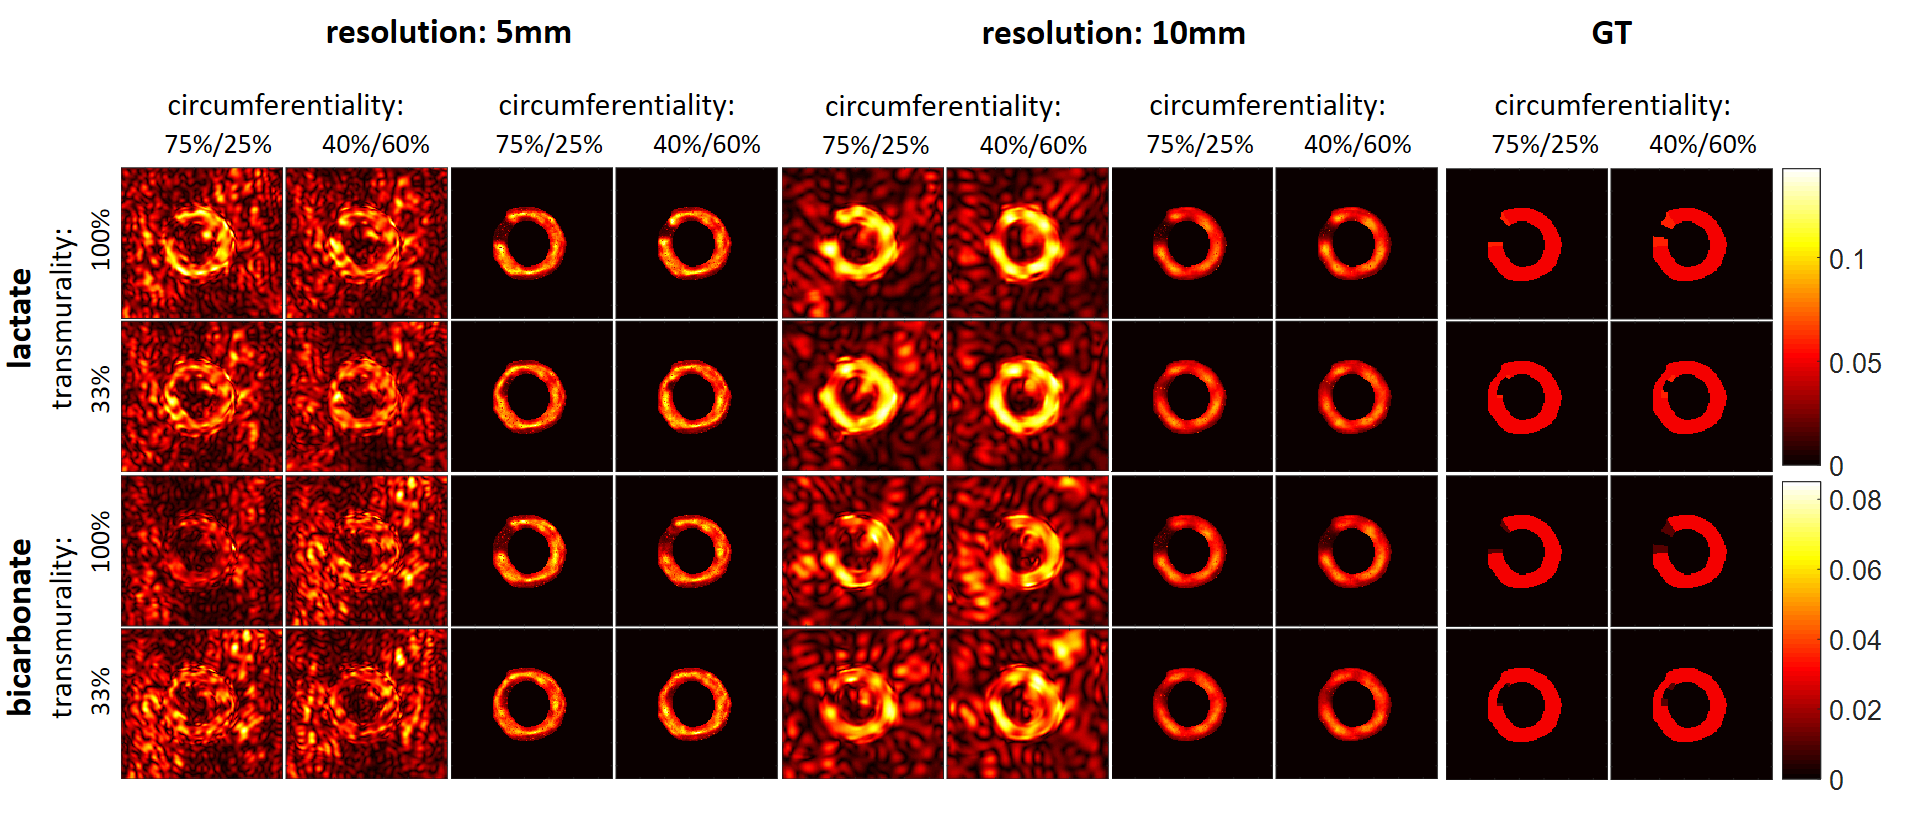
Fig-4 displays reconstructed images and k-maps depending on resolution and transmurality/circumferentiality. The detection limit of an IA w.r.t. to transmurality is 33%. The AAR could not be distinguished for the examined parameters.
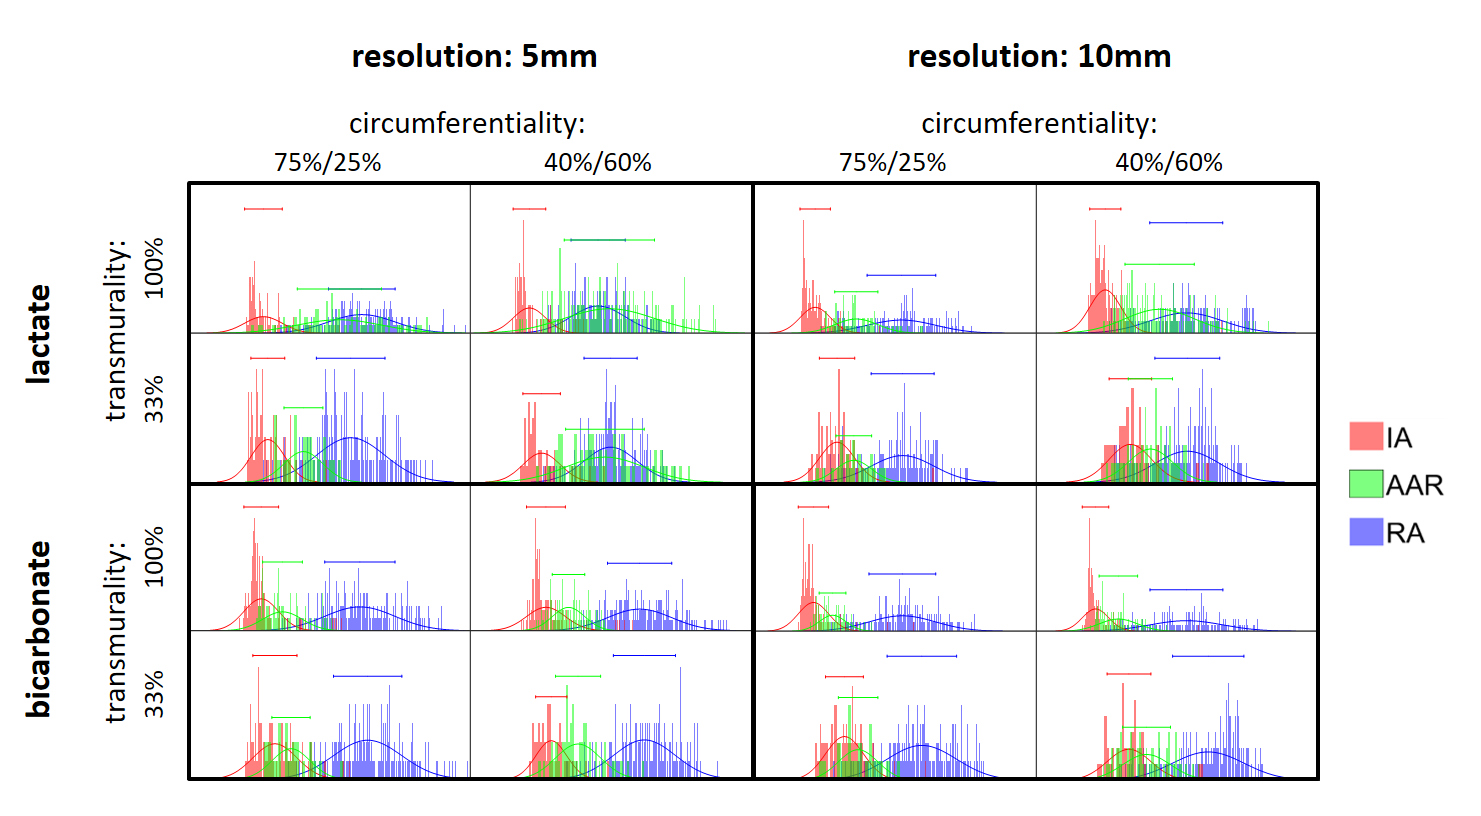
Fig-5 presents histograms of the estimated rate constants within the IA/AAR/RA depending on the resolution and transmurality/circumferentiality. In case of MI detection, low resolutions perform better than higher ones, whereas the mean error of kPL in the AAR is decreased for lower resolutions.
Discussion
Our data confirms that kinetic analysis of focal lesions in the heart requires sufficient base SNR. At 10mm spatial resolution, infarct sizes of 33-100% transmurality and 40-75% circumferentiality are detectable provided a minimum lactate/bicarbonate pSNR of 7.1/4.2. At 10mm and 5mm, discrimination is insufficient to distinguish AAR and RA for kinetic rate differences ≤ 20%. Moreover, the SNR reduction incurred by the smaller voxel size decreases the confidence in detecting larger, focal lesions.
For in-vivo applicability, further efforts are required to increase baseline SNR through optimized polarization, signal detection and encoding. Furthermore, accurate parameter estimations for the reconstruction of Eq-1 are essential, as well as reliable methods to infer on myocardial pyruvate concentrations from blood-pool signals.
Acknowledgements
No acknowledgement found.References
1. Schroeder MA, Lau AZ, Chen AP, Gu Y, Nagendran J, Barry J, et al. Hyperpolarized 13C magnetic resonance reveals early- and late-onset changes to in vivo pyruvate metabolism in the failing heart. Eur J Heart Fail. 2013;15:130–40.
2. Cunningham CH, Lau JYC, Chen AP, Geraghty BJ, Perks WJ, Roifman I, et al. Hyperpolarized 13C Metabolic MRI of the Human Heart: Initial Experience. Circ Res. 2016;119:1177–82. doi:10.1161/CIRCRESAHA.116.309769.
3. Mariotti E, Weiss K, Kozerke S, Eykyn TR. Exploring detection limits of cardiac ischemia using dynamic imaging of hyperpolarized 13C pyruvate. In: Proc. Intl. Soc. Mag. Reson. Med. 2013. p. 1580.
4. Sigfridsson A, Weiss K, Wissmann L, Busch J, Krajewski M, Batel M, et al. Hybrid multiband excitation multiecho acquisition for hyperpolarized 13C spectroscopic imaging. Magn Reson Med. 2015;73:1713–7.
5. Segars WP, Sturgeon G, Mendonca S, Grimes J, Tsui BMW. 4D XCAT phantom for multimodality imaging research. Med Phys. 2010;37:4902–15.
Figures
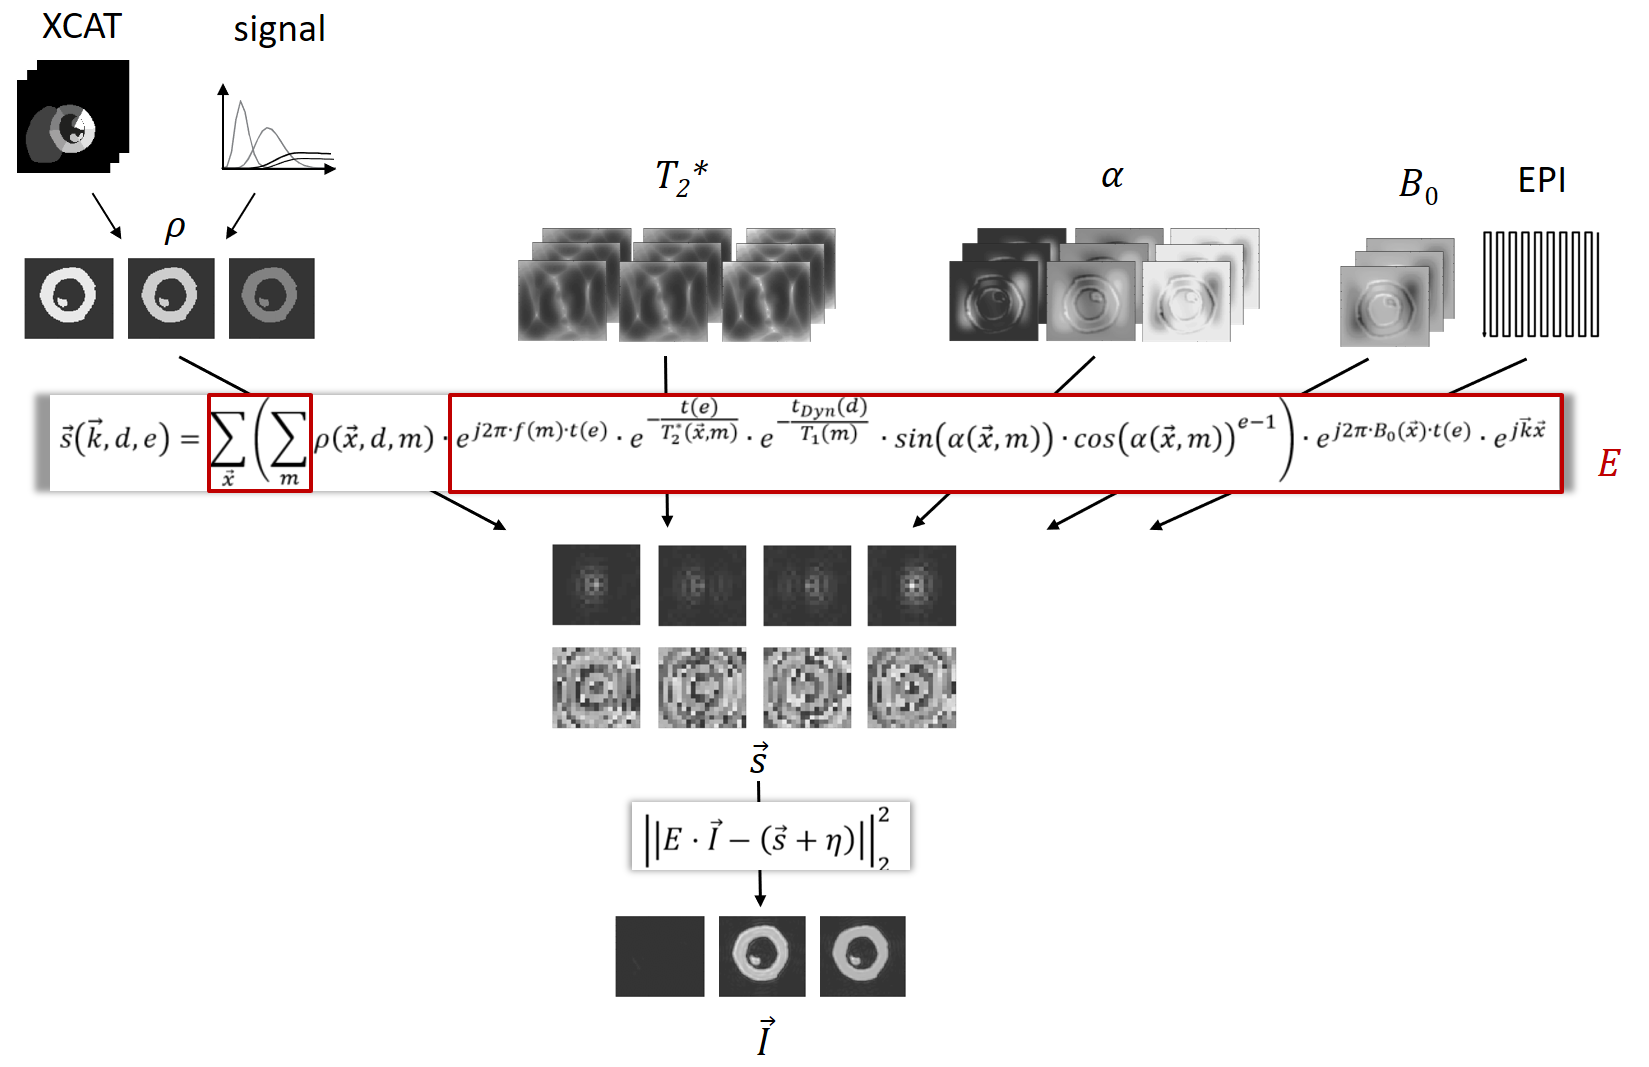
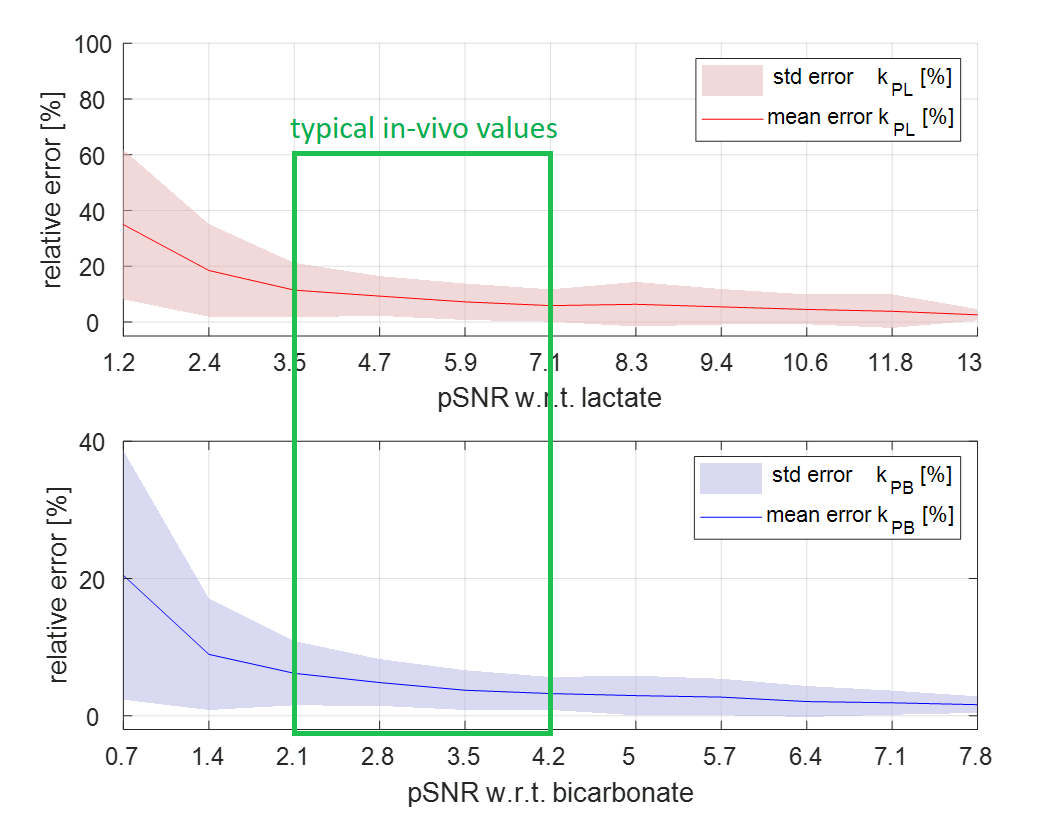
Fig-2 Mean error and standard deviation of the estimated rate constants kPL and kPB. In-vivo experiments on pigs using a spatial resolution of 5mm yielded peak-SNR (pSNR) values w.r.t. lactate/bicarbonate in the range of 3.5-7.1/2.1-4.2. For the simulated spatial resolutions of 10mm, 7mm and 3mm, these values were scaled accordingly.
For typical in-vivo SNR, the mean fitting error attributed to noise is smaller than 20% for both kPL and kPB.