4275
Distinguishing Closely Related Pancreatic Cancer Subtypes by Glucose Metabolic Imaging Using 13C-MRS without Hyperpolarization1National Cancer Institute, Bethesda, MD, United States, 2Hokkaido University, Sapporo, Japan, 3Laboratory of Functional and Molecular Imaging, National Institute of Neurological Disorders and Stroke, Bethesda, MD, United States, 4GE Healthcare, Dallas, TX, United States, 5GE Healthcare, Toronto, ON, Canada, 6Technical University of Denmark, Lyngby, Denmark
Synopsis
Metabolic differences both between patients and within the tumor itself can be an important determinant in cancer treatment outcome; however, methods for determining these differences non-invasively in vivo have been lacking. Using pancreatic ductal adenocarcinoma as a model, we demonstrate that xenografts with a similar genetic background can be distinguished by differing rates of glucose metabolism, which can be imaged by 13C glucose without hyperpolarization using a newly developed technique for noise suppression. Using this method, cancer subtypes that appear similar in mass spectrometry tissue biopsies and hyperpolarized MRI pyruvate metabolism measurements can be easily distinguished.
Purpose
The lifetime of a hyperpolarized signal in MRI is governed by the T1 relaxation of the probe. Many potential probes, including glucose, 1, 2 have T1s which makes measuring metabolic turnover by hyperpolarized MRI difficult. We have previously shown that while hyperpolarization allows accurate mapping of enzymatic conversion in vivo, it is not strictly necessary for 13C imaging of metabolic tracers.3 If enough spectra can be obtained, it is possible to use the spatial and temporal correlations within the signal to construct 13C images using global low rank reconstruction of the signal by tensor decomposition to increase the SNR by a factor of 30.3Methods
To see how a targeted approach using hyperpolarized 13C pyruvate compares to the more comprehensive approach offered by non-hyperpolarized 13C glucose, we analyzed xenografts of two closely related cell lines, Hs766t and MIA PaCa-2, which have a similar genetic background in their metabolic pathways but marked differences in tumor anatomy and clinical prognosis,4-6 by hyperpolarized pyruvate MRI, CE/MS metabolomics, and non-hyperpolarized 13C glucose imaging.Results
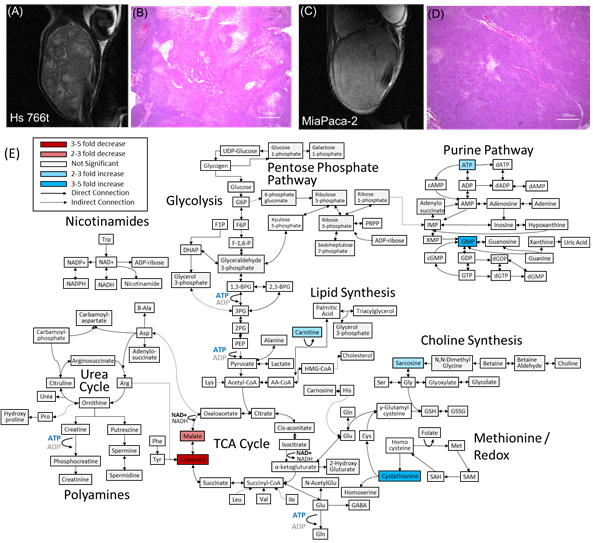
Both the MRI and histology results show substantial differences in the tumor microenviroment between the two tumor types that may influence metabolism (Figure 1A-D). While the MiaPaCa2 tumors appear entirely homogenous and undifferentiated, the Hs766t tumors is broken by hypointense spots, a feature characteristic of focal necrosis, a common symptom of low oxygen availability (Fig 1D).
We expected these large differences in the tumor microenvironment to be evident in the steady state metabolome measured by CE/MS. Surprisingly, while differences exist between tumor subtypes in the CE/MS profile, they are relatively subtle in comparison to the differences between normal tissue and tumors and orthoptopic and subcutaneous xenografts. Although it is possible to distinguish between the two types of PDAC tumors using the entirety of the metabolic profile (p=0.00015 for N=4, two-way ANOVA with Sidak’s correction for multiple comparisons), no single pathway stood out as being distinct nor is any single biomarker distinct at the 5% confidence level (Fig. 1E).
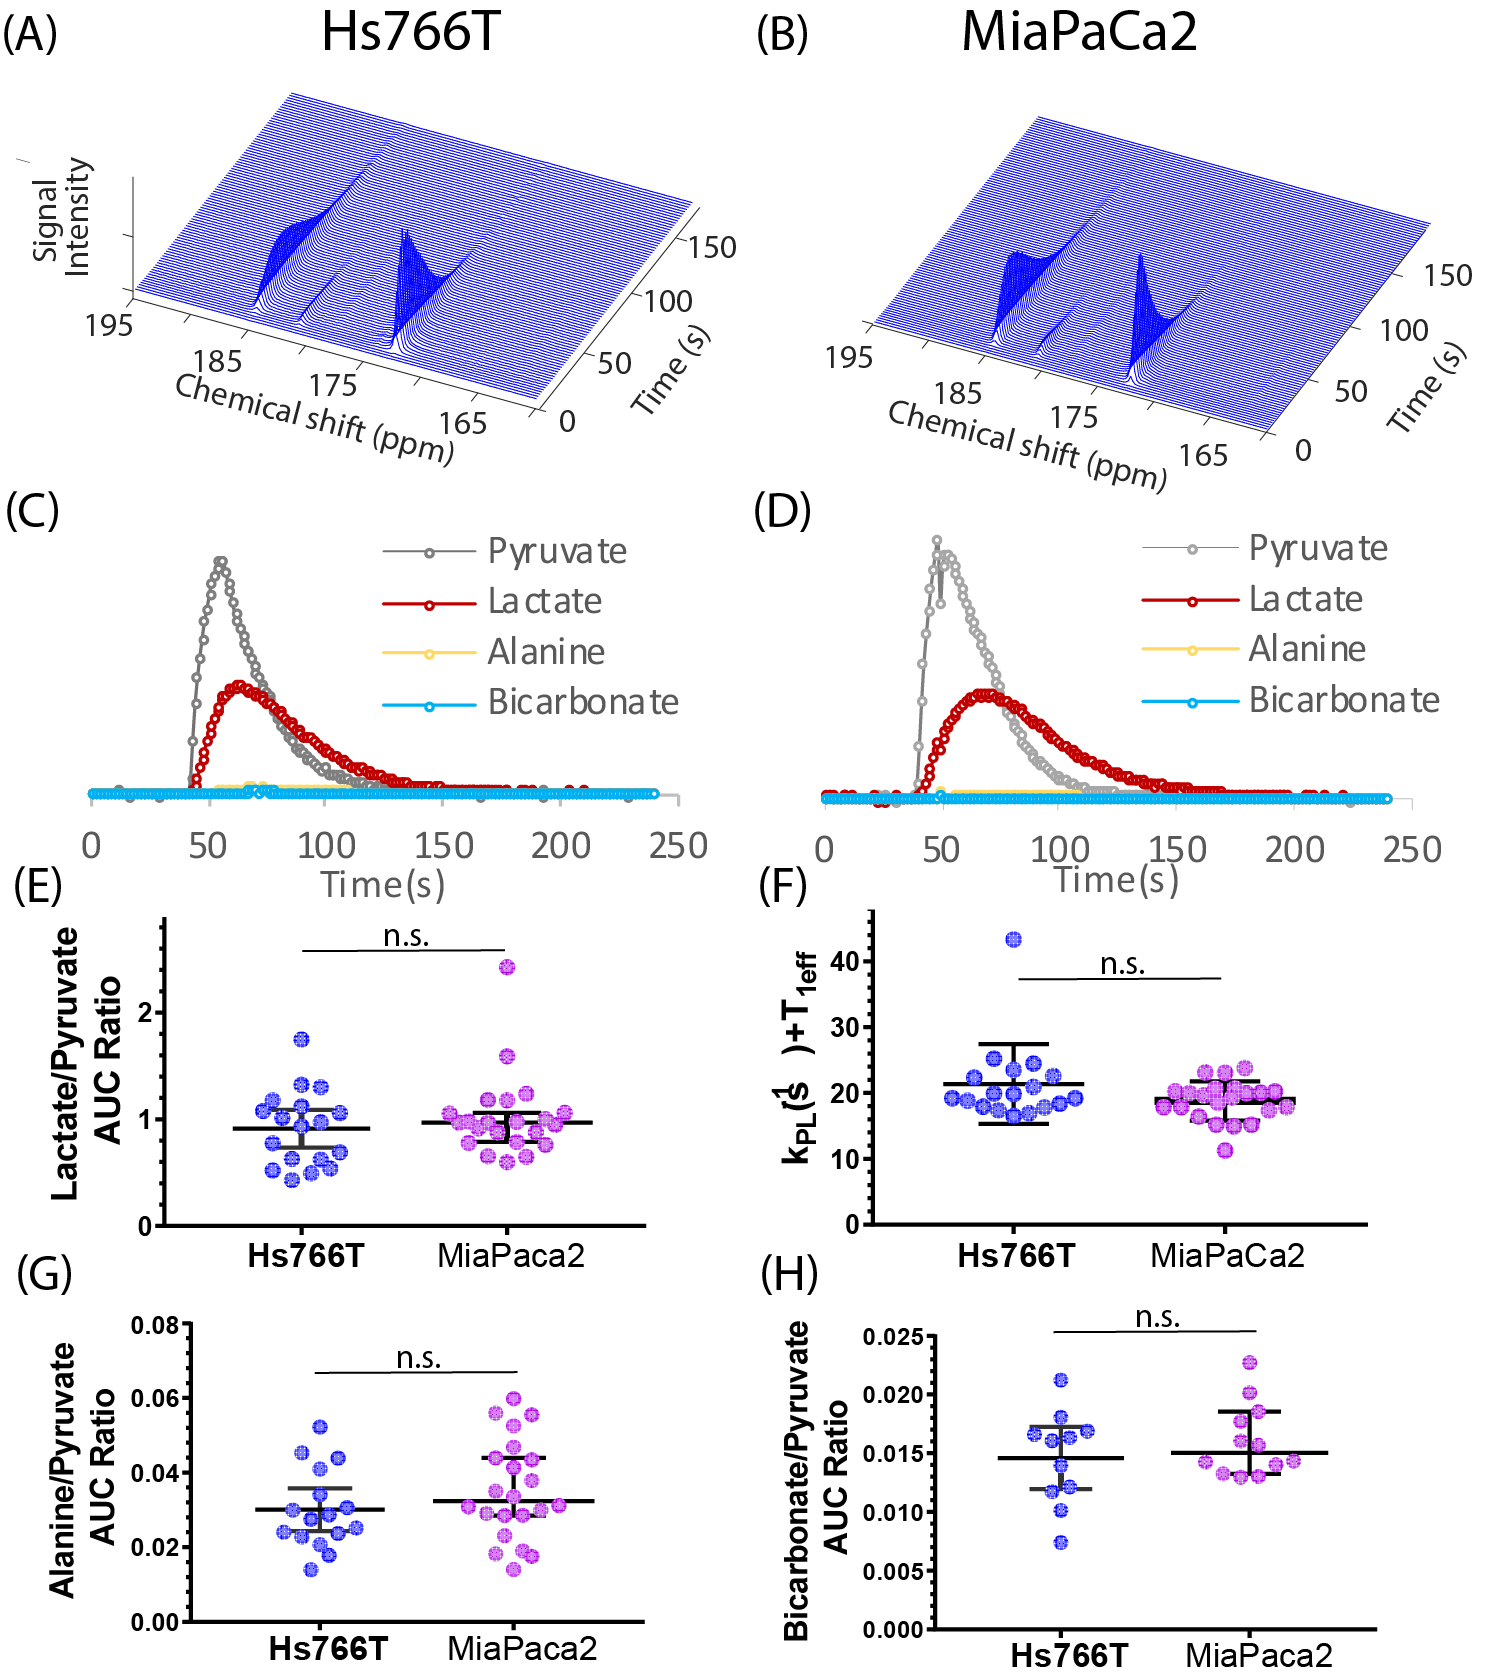
The CE/MS experiment measures the static distribution of metabolites within the tumor, which is the sum of multiple biochemical pathways. To more directly probe specific enzyme activities within the glycolytic and TCA cycles, we first tracked the in vivo utilization of 13C labelled pyruvate tracers using 13C magnetic resonance spectroscopy to detect the de novo generation of new metabolites from pyruvate. Figs. 2A and B shows typical spectra after the injection of 98 mM solution of hyperpolarized [1-13C] pyruvate into the tail vein of nude mice bearing MiaPaca or Hs766t xenografts in the left leg. Few differences could be seen when using 1-13C-pyruvate as a metabolic tracer; pyruvate metabolism in the MiaPaca and Hs766t cell lines appear to be statistically indistinguishable. Pyruvate metabolism is not a sensitive biomarker for distinguishing among hypoxic pancreatic adenocarcinoma subtypes. The lack of success of 1-13C-pyruvate encouraged us to look elsewhere for possible metabolic biomarkers.
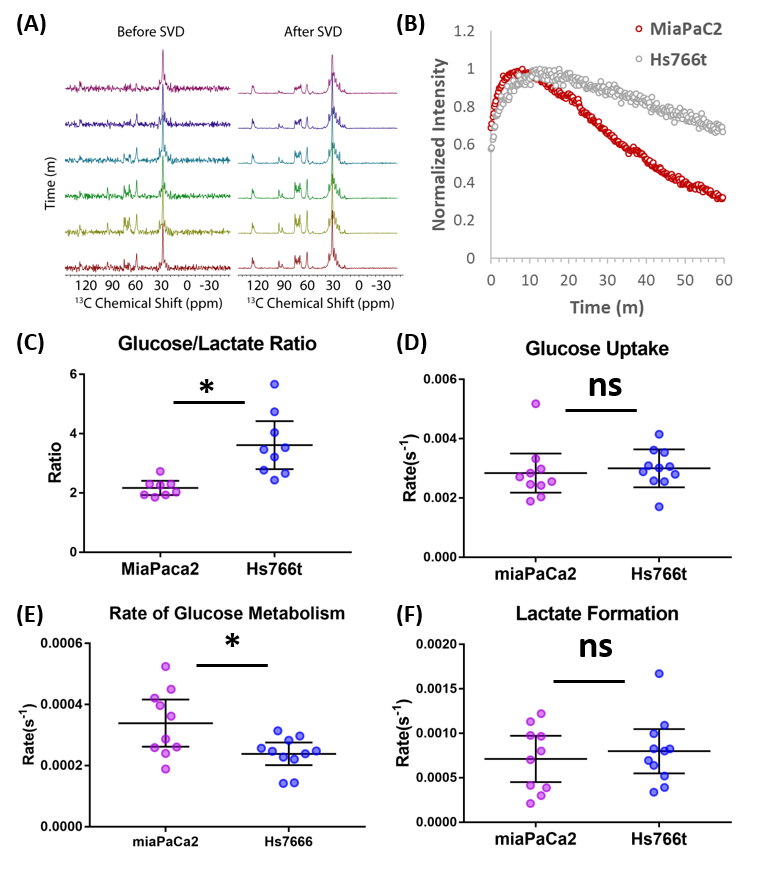
The CE/MS data is suggestive of an upregulation in MiaPaca of the later stages of glycolysis relative to Hs766t 7 but the sample-sample variability inherent to MS techniques obscures the magnitude of any difference. Using rank reduction by SVD to diminish the noise to a detectable level,3 we checked the bulk glucose metabolism of each tumor type following an injection of 50 mg bolus of uniformly labelled, non-hyperpolarized U-13C-glucose using non-localized spectroscopy. While no difference between cell lines could be detected in either the rate of glucose uptake (Fig.3D) or in the rate of lactate formation (Fig. 3F), the rate of glucose metabolism after import efficiently distinguished MiaPaCa and Hs766t xenografts. Hs766t xenografts have a statistically significant slower glucose metabolism than MiaPaCa xenografts (Fig. 3E, Mann-Whitney rank test, p=0.02)
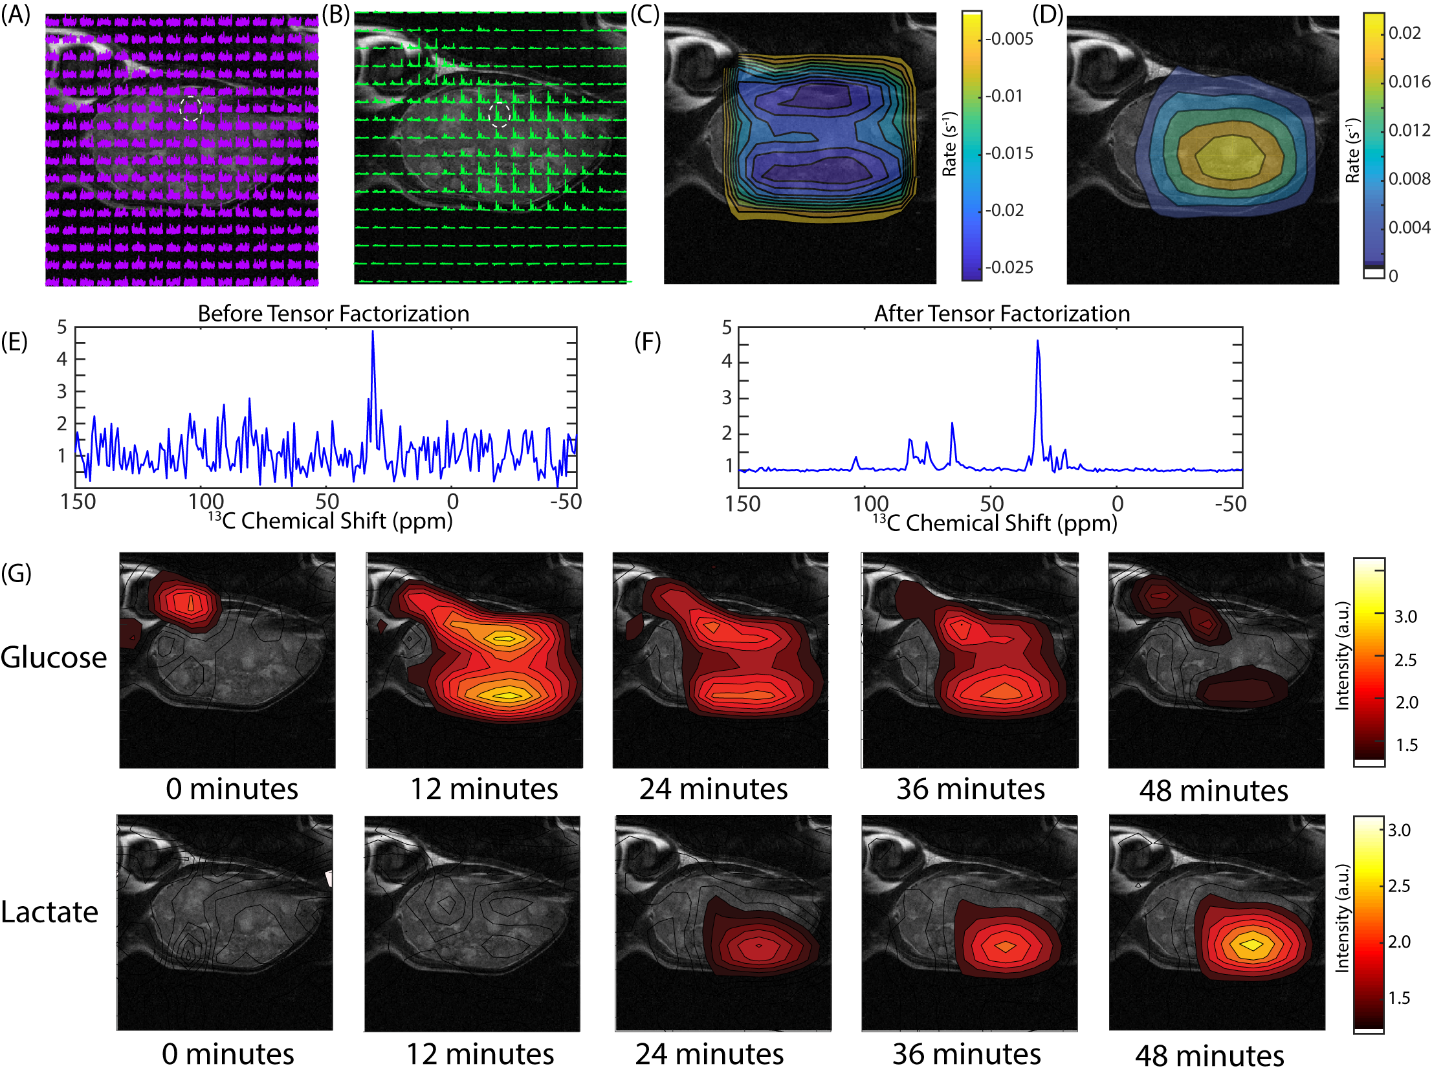
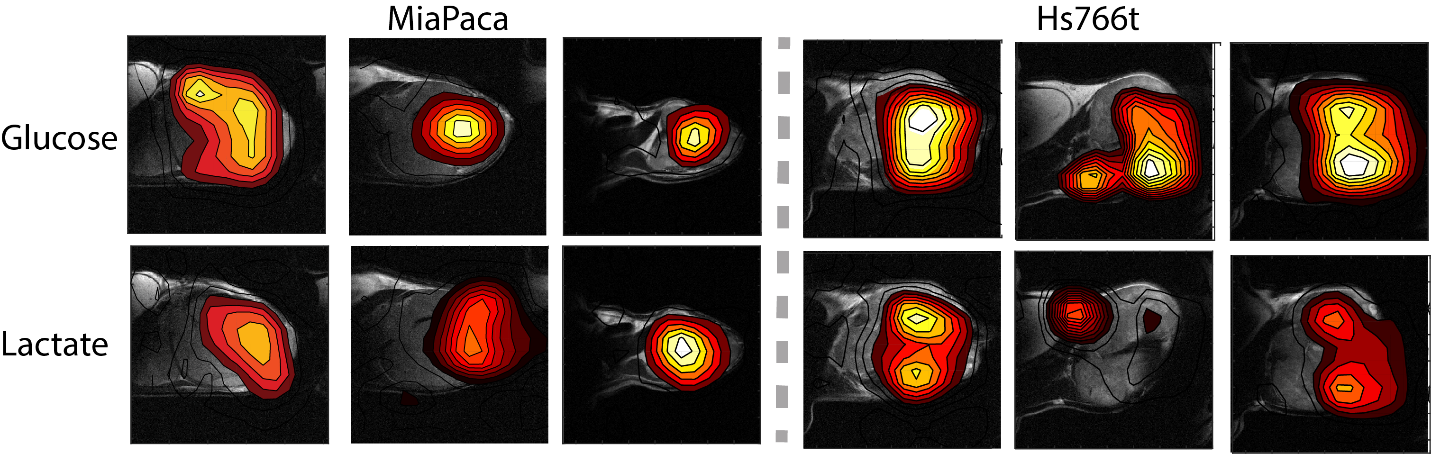
Figure 4 shows representative results from chemical shift imaging of the metabolism of a 50 mg 13C glucose tracer in MiaPaCa2 and Hs766t xenografts before and after noise suppression. While the raw images were mainly noise, (Fig.4 E) the processed images by tensor decomposition clearly showed localized uptake of glucose within the tumor. Local differences in metabolism can be detected in many tumors. For example, in one Hs766t xenograft (Figure 4G) glucose metabolism is distributed relatively uniformly. Lactate production, on the other hand, is localized in this tumor to one side where focal necrosis is more evident. In comparable MiaPaca2 tumors (Fig. 5), glucose and lactate production appears to be more tightly correlated, congruent with the greater homogeneity apparent in the anatomical MRIs. While these results are currently qualitative and await further confirmation, metabolic heterogeneity may prove a useful marker for distinguishing cancer subtypes.
Acknowledgements
No acknowledgement found.References
[1] Rodrigues, T. B., Serrao, E. M., Kennedy, B. W. C., Hu, D. E., Kettunen, M. I., and Brindle, K. M. (2014) Magnetic resonance imaging of tumor glycolysis using hyperpolarized C-13-labeled glucose, Nature Medicine 20, 93-97.
[2] De Feyter, H. M., Behar, K. L., Corbin, Z. A., Fulbright, R. K., Brown, P. B., McIntyre, S., Nixon, T. W., Rothman, D. L., and de Graaf, R. A. (2018) Deuterium metabolic imaging (DMI) for MRI-based 3D mapping of metabolism in vivo, Sci Adv 4, eaat7314.
[3] Brender, J. R., Kishimoto, S., Merkle, H., Reed, G., Hurd, R. E., Chen, A. P., Ardenkjaer-Larsen, J. H., Munasinghe, J., Saito, K., Seki, T., Oshima, N., Yamamoto, K., Choyke, P. L., Mitchell, J., and Krishna, M. C. (2018) PET by MRI: Glucose Imaging by 13C-MRS without Dynamic Nuclear Polarization by Noise Suppression through Tensor Decomposition Rank Reduction, bioRxiv 265793.
[4] Deer, E. L., Gonzalez-Hernandez, J., Coursen, J. D., Shea, J. E., Ngatia, J., Scaife, C. L., Firpo, M. A., and Mulvihill, S. J. (2010) Phenotype and genotype of pancreatic cancer cell lines, Pancreas 39, 425-435.
[5] Zhang, X., Wojtkowiak, J. W., Martinez, G. V., Cornnell, H. H., Hart, C. P., Baker, A. F., and Gillies, R. (2016) MR Imaging Biomarkers to Monitor Early Response to Hypoxia-Activated Prodrug TH-302 in Pancreatic Cancer Xenografts, PLoS One 11, e0155289.
[6] Daemen, A., Peterson, D., Sahu, N., McCord, R., Du, X., Liu, B., Kowanetz, K., Hong, R., Moffat, J., Gao, M., Boudreau, A., Mroue, R., Corson, L., O'Brien, T., Qing, J., Sampath, D., Merchant, M., Yauch, R., Manning, G., Settleman, J., Hatzivassiliou, G., and Evangelista, M. (2015) Metabolite profiling stratifies pancreatic ductal adenocarcinomas into subtypes with distinct sensitivities to metabolic inhibitors, Proc Natl Acad Sci U S A 112, E4410-4417.
[7] Matsumoto, S., Kishimoto, S., Saito, K., Takakusagi, Y., Munasinghe, J. P., Devasahayam, N., Hart, C. P., Gillies, R. J., Mitchell, J. B., and Krishna, M. C. (2018) Metabolic and Physiologic Imaging Biomarkers of the Tumor Microenvironment Predict Treatment Outcome with Radiation or a Hypoxia-Activated Prodrug in Mice, Cancer Research 78, 3783-3792.
Figures