4256
Toward in vivo quantification of microparticles of iron oxide targeting cerebrovascular inflammation1Sherbrooke Molecular Imaging Center (CIMS), Department of Nuclear Medicine and Radiobiology, Université de Sherbrooke, Sherbrooke, QC, Canada, 2Medical Physics Group, Institute of Diagnostic and Interventional Radiology, Jena University Hospital - Friedrich Schiller University Jena, Jena, Germany
Synopsis
Microparticles of iron oxide (MPIOs) can be detected by MRI with high sensitivity. This has recently led to their utilization as efficient contrast agents for molecular imaging or cell tracking. We present first steps toward in vivo quantification of a targeted MPIO that is widely used for inflammation imaging. These steps include 1) relaxivities and molar susceptibility measurements on a phantom, 2) in vivo estimation of the concentration of inflammation-specific MPIOs in a mouse model of cerebrovascular inflammation and 3) acquisition of ex vivo images that validate the results obtained in vivo.
Introduction
Microparticles of iron oxide (MPIOs) can be detected by MRI with high sensitivity. This has recently led to their utilization as efficient contrast agents for molecular imaging (e.g. to monitor inflammation1–4) or in vivo cell tracking5,6. In this abstract, we study the molar magnetic susceptibility ($$$\chi_M$$$) obtained from quantitative susceptibility mapping (QSM) and the relaxivities of an MPIO widely used for imaging of cerebrovascular inflammation4. The in vivo concentration of inflammation-specific MPIOs is determined in a mouse model of cerebrovascular inflammation. This work is a first step toward the quantitative evaluation and follow-up of cerebrovascular inflammation in brain pathologies.Methods
MPIO: Dynabeads® MyOne™ Tosylactivated (Invitrogen) MPIOs were used. The stock solution was diluted for phantom creation. The MPIOs were conjugated with vascular cell adhesion molecule-1 (VCAM-1) antibodies as first described by McAteer et al.1 for in vivo cerebrovascular inflammation imaging.
Phantom imaging: A cylindrical 1.5% agarose gel phantom of 30 mm diameter including 6 cylinders containing increasing MPIO concentrations was scanned on a 9.4T small animal MRI (Bruker, Ettlingen, Germany) with a 3D gradient-echo sequence and a 2D spin echo sequence (sequence details are listed in Table 1).
In vivo imaging: Cerebrovascular inflammation was induced in Balb/c mice with a stereotaxic injection of lipopolysaccharide into the right hemisphere. VCAM-1 specific MPIOs were injected intravenously 24 h afterward. Mice were imaged with a T2*-weighted 3D gradient‑echo sequence (Table 1) on a small animal 7T MRI (Varian, Palo Alto, USA) before and after MPIO injection.
Ex vivo imaging: Mice were sacrificed by dislocation. Brains were extracted, fixed and imaged with a 3D gradient-echo sequence (Table 1) in the 9.4T‑MRI system. Cross-sections of the brains (4µm thickness) were stained with haemotoxylin and eosin (H&E) and digitized.
Image analysis: Transverse (R2) and effective transverse relaxation rates (R2*) were fitted voxel-wise using the ARLO algorithm7. Susceptibility maps were generated from the gradient‑echo images using MCPC‑3D‑S8 for channel combination, weighted averaging9 for echo combination, path-based phase unwrapping10, V‑SHARP11 for background field removal, and HEIDI12 for field-to-susceptibility inversion. The relaxivities and the molar susceptibility $$$\chi_M$$$ were determined by fitting the mean values of regions of interest (ROI) including different MPIO concentrations. The in vivo difference in R2* ($$$\Delta R2*$$$) and magnetic susceptibility ($$$\Delta\chi$$$) due to MPIO injection was computed, then r2* and $$$\chi_M$$$ were applied to estimate the iron concentration.
Results and Discussion
Figure 1 shows a magnitude image and the parametric maps of the phantom. The MPIO distribution within each cylinder is not homogeneous, despite the great care that was taken to continuously stir the solutions and eliminate any visible aggregates before filling the cylinders. Figure 2 shows the calibration curves extracted from the phantom images along with the calculated relaxivities and molar susceptibility. The relaxivity r2* is around an order of magnitude larger than r2, which indicates that the water molecules are close to a static dephasing regime and that T2*-weighted sequences are much more sensitive to detect MPIOs. The large standard deviations relative to the means for R2* and $$$\chi$$$ are most likely due to the inhomogeneous sample solutions. The relaxivities and $$$\chi_M$$$ are expected to be valid despite the inhomogeneities if the local concentrations encountered within the ROIs are comprised within the linear concentration‑vs‑parameter regime.
Figure 3 shows images acquired in vivo in a mouse model of cerebrovascular inflammation before and after injection of MPIO. The local concentration of iron is estimated from $$$\Delta R2*$$$ and $$$\Delta \chi$$$. As expected, the concentration of MPIO is higher in the inflamed hemisphere. However, the concentration of iron estimated from susceptibility is up to five times higher than the concentration estimated from R2*. Several factors such as the effects of imaging parameters on the relaxivities and on $$$\chi_M$$$ remain to be studied and need to be controlled to understand and address this discrepancy.
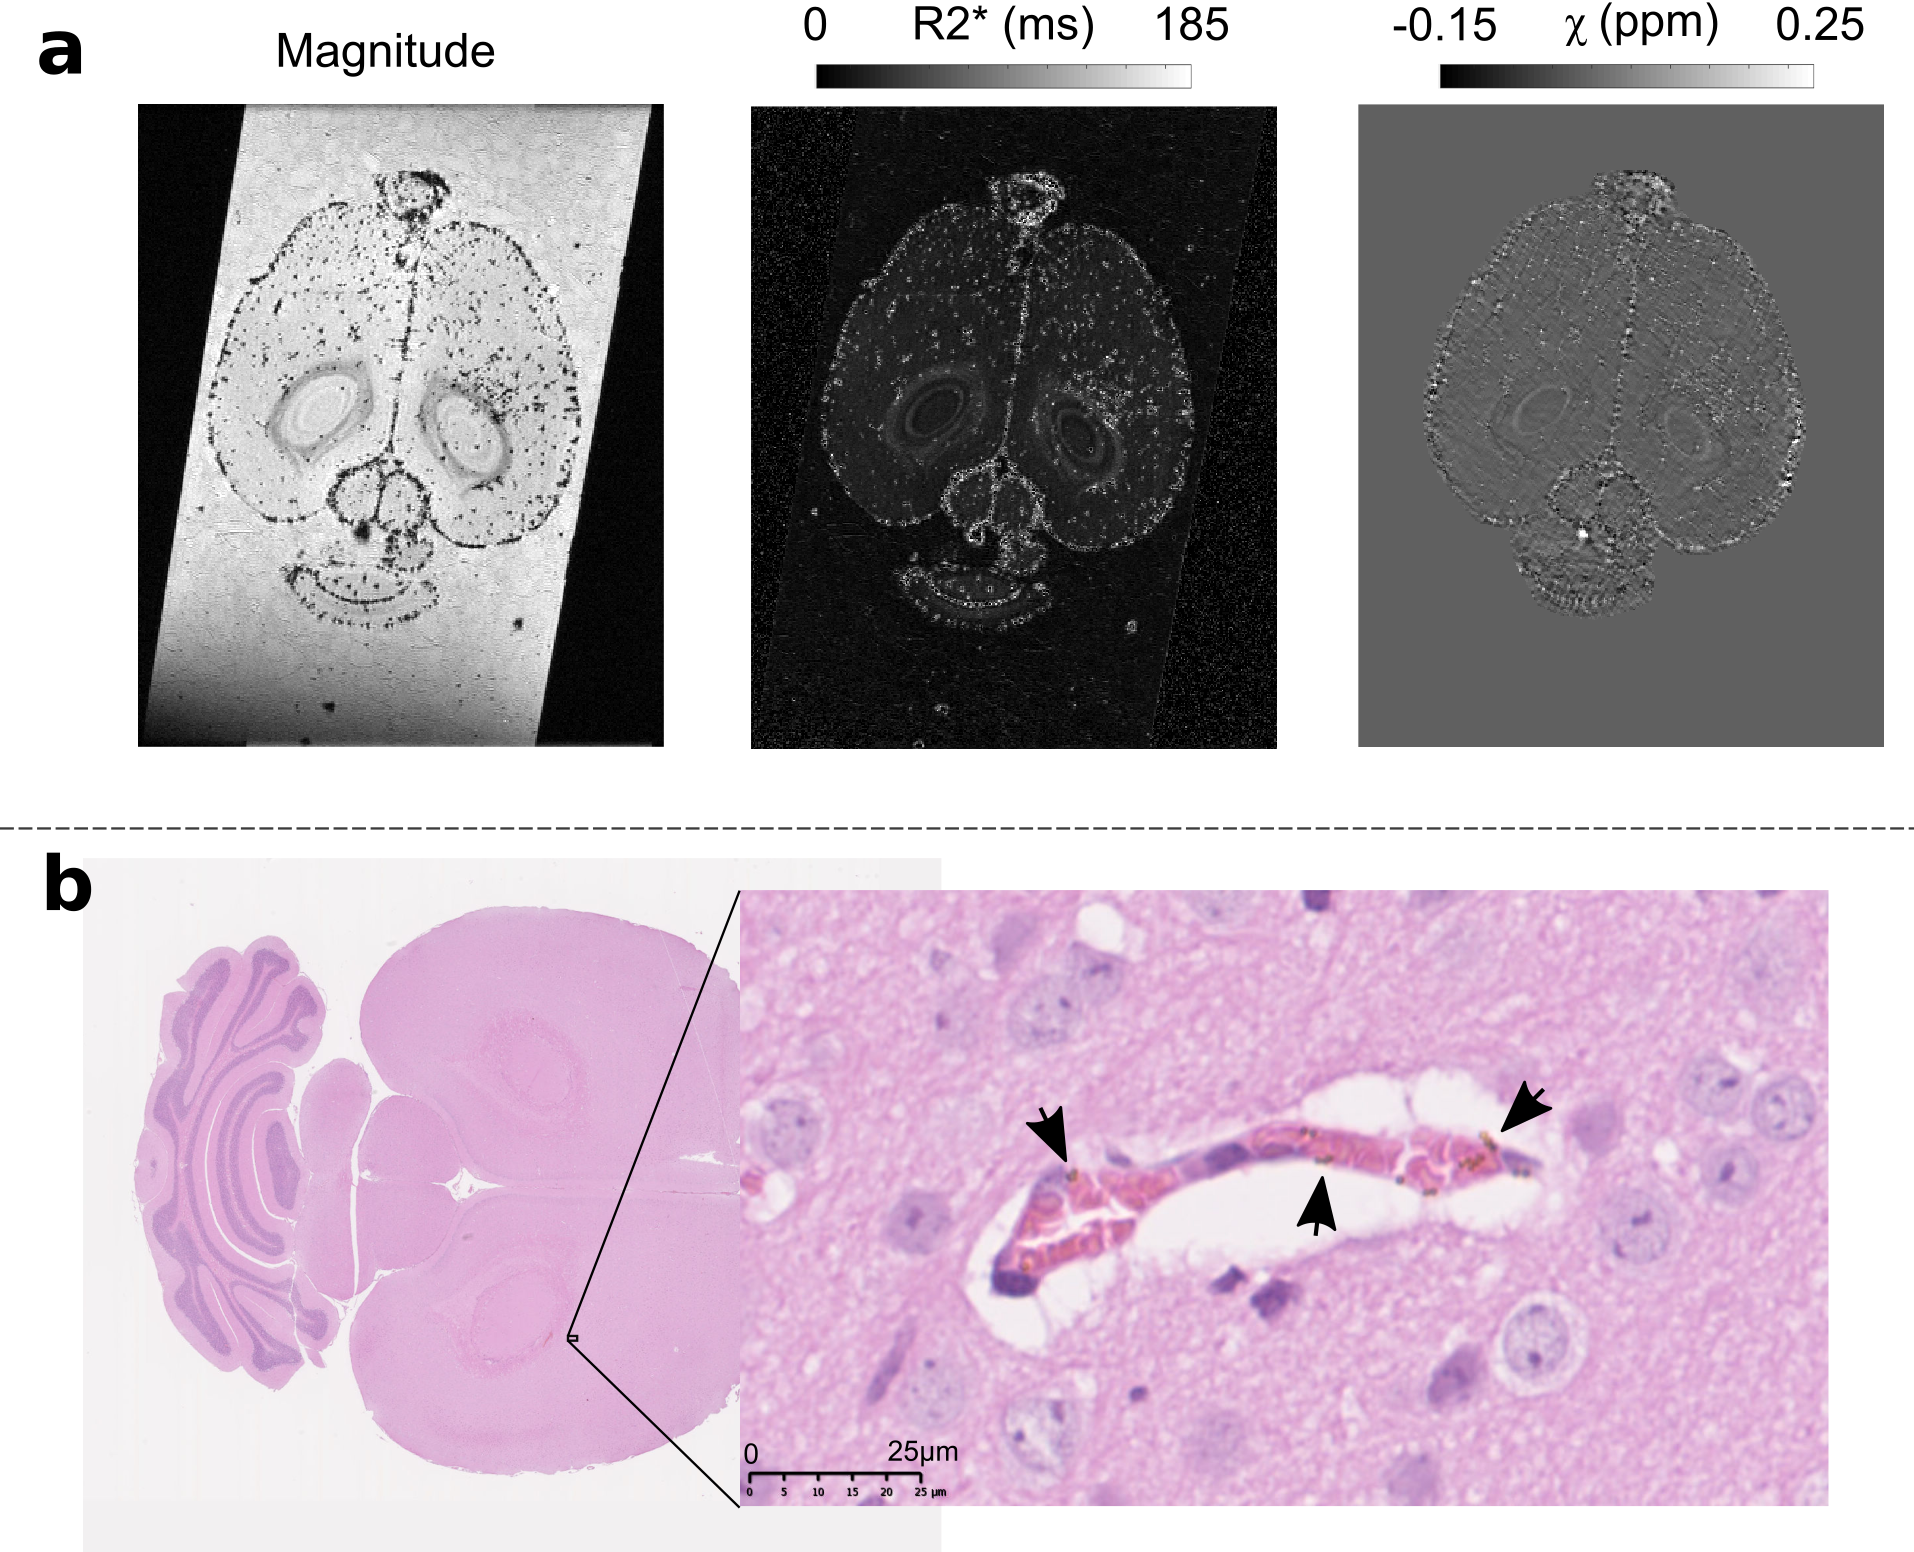
Figure 4 shows ex vivo images of the same mouse that is presented in Figure 3. The magnitude image, the R2* and the susceptibility maps depict the location of MPIOs. Panel b shows an H&E stained section that confirms the cerebrovascular localization of the inflammation-targeting MPIOs.
Conclusion
To the best of our knowledge, this abstract presents the first quantification of the MRI properties of the Dynabeads® MyOne™ Tosylactivated MPIOs, which are widely used for cerebrovascular inflammation imaging4. We have quantified in vivo inflammation-specific MPIOs in a mouse model of cerebrovascular inflammation in an attempt to transform qualitative T2*‑weighted imaging into quantitative molecular imaging. More controls and validations on phantoms and ex vivo samples are still needed to precisely validate the concentrations obtained in vivo.Acknowledgements
Jérémie P. Fouquet is supported by a NSERC scholarship and by a QBIN international training award. The authors thank Mélanie Archambault for animal manipulation. This work was funded by CIHR. Andreas Deistung was supported by the German Research Foundation (DFG, DE 2516/1-1).References
1. McAteer M a, Sibson NR, von Zur Muhlen C, et al. In vivo magnetic resonance imaging of acute brain inflammation using microparticles of iron oxide. Nat. Med. 2007;13(10):1253–8.
2. Montagne A, Gauberti M, Macrez R, et al. Ultra-sensitive molecular MRI of cerebrovascular cell activation enables early detection of chronic central nervous system disorders. Neuroimage. 2012;63(2):760–770.
3. Serres S, Soto MS, Hamilton A, et al. Molecular MRI enables early and sensitive detection of brain metastases. Proc. Natl. Acad. Sci. U. S. A. 2012;109(17):6674–9.
4. Gauberti M, Fournier AP, Docagne F, et al. Molecular magnetic resonance imaging of endothelial activation in the central nervous system. Theranostics. 2018;8(5):1195–1212.
5. Shapiro EM, Skrtic S, Koretsky AP. Sizing it up: Cellular MRI using micron-sized iron oxide particles. Magn. Reson. Med. 2005;53(2):329–338.
6. Rogers WJ, Meyer CH, Kramer CM. Technology insight: in vivo cell tracking by use of MRI. Nat. Clin. Pract. Cardiovasc. Med. 2006;3(10):554–562.
7. Pei M, Nguyen TD, Thimmappa ND, et al. Algorithm for fast monoexponential fitting based on Auto-Regression on Linear Operations (ARLO) of data. Magn. Reson. Med. 2015;73(2):843–850.
8. Eckstein K, Dymerska B, Bachrata B, et al. Computationally Efficient Combination of Multi-channel Phase Data From Multi-echo Acquisitions (ASPIRE). Magn. Reson. Med. 2018;79(6):2996–3006.
9. Wu B, Li W, Avram AV, et al. Fast and tissue-optimized mapping of magnetic susceptibility and T2* with multi-echo and multi-shot spirals. Neuroimage. 2012;59(1):297–305.
10. Abdul-Rahman HS, Gdeisat M a, Burton DR, et al. Fast and robust three-dimensional best path phase unwrapping algorithm. Appl. Opt. 2007;46(26):6623–6635.
11. Li W, Wu B, Liu C. Quantitative susceptibility mapping of human brain reflects spatial variation in tissue composition. Neuroimage. 2011;55(4):1645–1656.
12. Schweser F, Sommer K, Deistung A, et al. Quantitative susceptibility mapping for investigating subtle susceptibility variations in the human brain. Neuroimage. 2012;62(3):2083–2100.
Figures