4254
Distribution of Major Brain Metabolite Ratios in Adults: The Observations of Whole Brain Magnetic Resonance Spectroscopic Imaging StudyXinnan Li1, Khin Khin Tha2,3, Kagari Khin Abiko4, Sinyeob Ahn5, Yuta Urushibata6, Kohsuke Kudo2, and Hiroki Shirato1
1Department of Radiation Medicine, Hokkaido University Graduate School of Medicine, Sapporo, Japan, 2Department of Diagnostic and Interventional Radiology, Hokkaido University Hospital, Sapporo, Japan, 3Global Station for Quantum Medical Science and Engineering, Hokkaido University, Sapporo, Japan, 4Hokkaido University Hospital, Sapporo, Japan, 5Siemens Healthineers, San Francisco, CA, United States, 6Siemens Healthcare K.K., Tokyo, Japan
Synopsis
We evaluated the normative major metabolite ratios of adults by using whole-brain magnetic resonance spectroscopic imaging (MRSI). The major metabolite ratios of the brain vary with region, age
Background and Purpose
Recent advances in high-speed MRI technologies have allowed acquisition of whole brain magnetic resonance spectroscopic imaging (MRSI) in clinically acceptable scan time (i.e., less than 20 minutes)1. Regional variations in major metabolite concentrations have been documented in MRSI. However, comprehensive studies about these variations, the influence of age and gender and the relationship among the major metabolites are lacking. In this prospective study, we aimed to determine the normative values of regional major metabolite ratios and to evaluate their variation with region, age and gender and the relationship among these ratios.Methods
Thirty-nine normal volunteers (18 women and 21 men), aged 22 to 68 years (mean age =35.33 ± 11.90 years), were included in this prospective study. MR examinations were performed using a 3T scanner (MAGNETOM Prisma, Siemens Healthcare, Erlangen, Germany) and a standard 64-channel head/neck coil. Whole brain MRSI was performed using a volumetric spin-echo echo-planar sequence (prototype) and the following scan parameters: TR/TE/TI = 1710/17/198 ms, flip angle = 73°, sampling of 50 × 50 × 18 k-space points over 280 × 280 × 180 mm3. 3D-T1WI, axial T2-WI, axial FLAIR imaging and axial PD-WI were also acquired. The MRSI data were processed by using MIDAS software2 (University of Miami, USA). The mean major metabolite ratios – NAA/Cr, Cho/Cr, Glx/Cr and mI/Cr, were extracted for 28 anatomical regions-of-interests that almost covered the entire brain (PickAtlas, WFU School of Medicine, USA)3. Fig 1 illustrates the scheme of MRSI data processing. Variations in the ratios with anatomical region, age and gender and the relationship among the ratios were then evaluated.Results and Discussion
Fig 2 illustrates the representative maps of major metabolite ratios. The major metabolite ratios varied significantly among anatomical regions (one-way ANOVA with post hoc Dunnett’s tests; corrected-P<0.05). The cerebellar hemispheres had lower mean NAA/Cr (mean = 0.84 ± 0.05), Glx/Cr (0.70 ± 0.07) and mI/Cr (0.66 ± 0.05) than the other regions (Fig 3). The major metabolite ratios also exhibited laterality: the left cerebral hemisphere had significantly higher mean NAA/Cr, Glx/Cr, or mI/Cr values than the right, for certain anatomical regions such as frontal lobe, parietal lobe, temporal lobe, limbic lobe, sub-lobar area, claustrum, and thalamus. On contrary, some anatomical regions of the right cerebral hemisphere such as the right parietal lobe, temporal lobe, occipital lobe, sub-lobar area, and thalamus had higher Cho/Cr or mI/Cr values than the left (paired t-tests; P<0.05). Men had higher mean Cho/Cr values in all four cerebral lobes, insula, limbic lobe and thalamus, higher thalamic Glx/Cr, and higher mI/Cr in occipital lobe, limbic lobe, lentiform nucleus and cerebellum than women (two-sample t-tests; P<0.05). In addition, the mean NAA/Cr and Glx/Cr values decreased, and Cho/Cr and mI/Cr increased with age in several regions (Pearson’s product-moment correlation analysis; corrected-P<0.05). Gender variation in these age-related alterations was also observed: men tended to exhibit greater degree of age-related increase in Cho/Cr, Glx/Cr and mI/Cr (Fig 4). There was a trend toward negative correlation between the mean NAA/Cr and Cho/Cr in several anatomical regions, which reached statistical significance in occipital lobe (r=-0.45). Significant moderate positive correlation was observed between NAA/Cr and Glx/Cr in the frontal, parietal, temporal, limbic lobes and sub-lobar area (r=0.35~0.52). The mean Cho/Cr of parietal lobe showed moderate negative correlation with Glx/Cr (r=-0.34), and the mean mI/Cr of occipital lobe showed moderate positive correlation with Glx/Cr (r=0.42) (Pearson’s product-moment correlation analysis; corrected-P<0.05) (Fig 5). These observations are thought to reflect the geographical variation in neuronal/ axonal count and integrity4, gender variation in myelin composition that might be regulated by sex hormones5, and neuronal degeneration of myelinated nerve fibers with age6.Conclusions
The major metabolite ratios of the brain vary with region, age and gender. The respective reference values are necessary to interpret the alterations in metabolite ratios in disease states. The whole brain MRSI allows quantification of major metabolite ratios of the entire brain in a single acquisition, and can become a useful tool in clinical studies.Acknowledgements
The authors would like to thank Dr. Andrew Maudsley and Dr. Sulaiman Sheriff for provision of MIDAS software and technical support.
References
- Mulkern RV, Panych LP. Echo planar spectroscopic imaging. Concepts in Magnetic Resonance 2001; 13(4): 213-237.
- http://mrir.med.miami.edu:8000/midas
- http://fmri.wfubmc.edu/software/pickatlas
- von Bartheld CS, Bahney J, Herculano-Houzel S. The search for true numbers of neurons and glial cells in the human brain: A review of 150 years of cell counting. J Comp Neurol 2016; 54(18): 3865-3895.
- Marin-Husstege M, Muggironi M, Raban D, Skoff RP, Casaccia-Bonnefil P. Oligodendrocyte progenitor proliferation and maturation is differentially regulated by male and female sex steroid hormones. Dev Neurosci 2004; 26 (2-4): 245-254.
- Marner L, Nyengaard JR, Tang Y, Pakkenberg B. Marked loss of myelinated nerve fibers in the human brain with age. J Comp Neurol 2003; 462(2): 144-152.
Figures
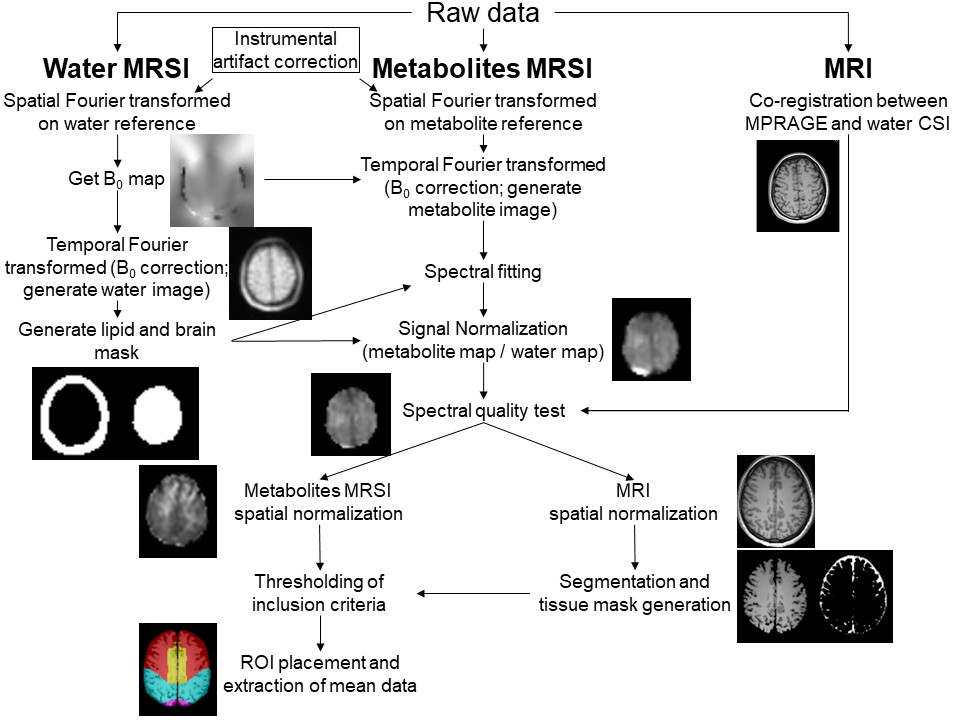
The scheme illustrating the processing of MRSI data.
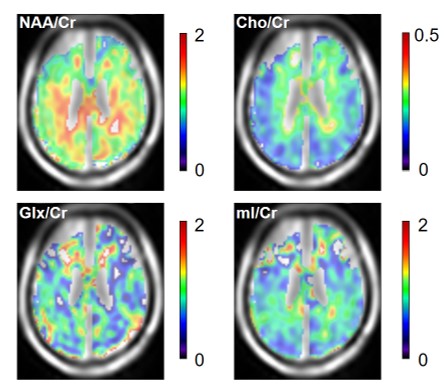
The representative maps of the major metabolite ratios ina 47-year-old woman.
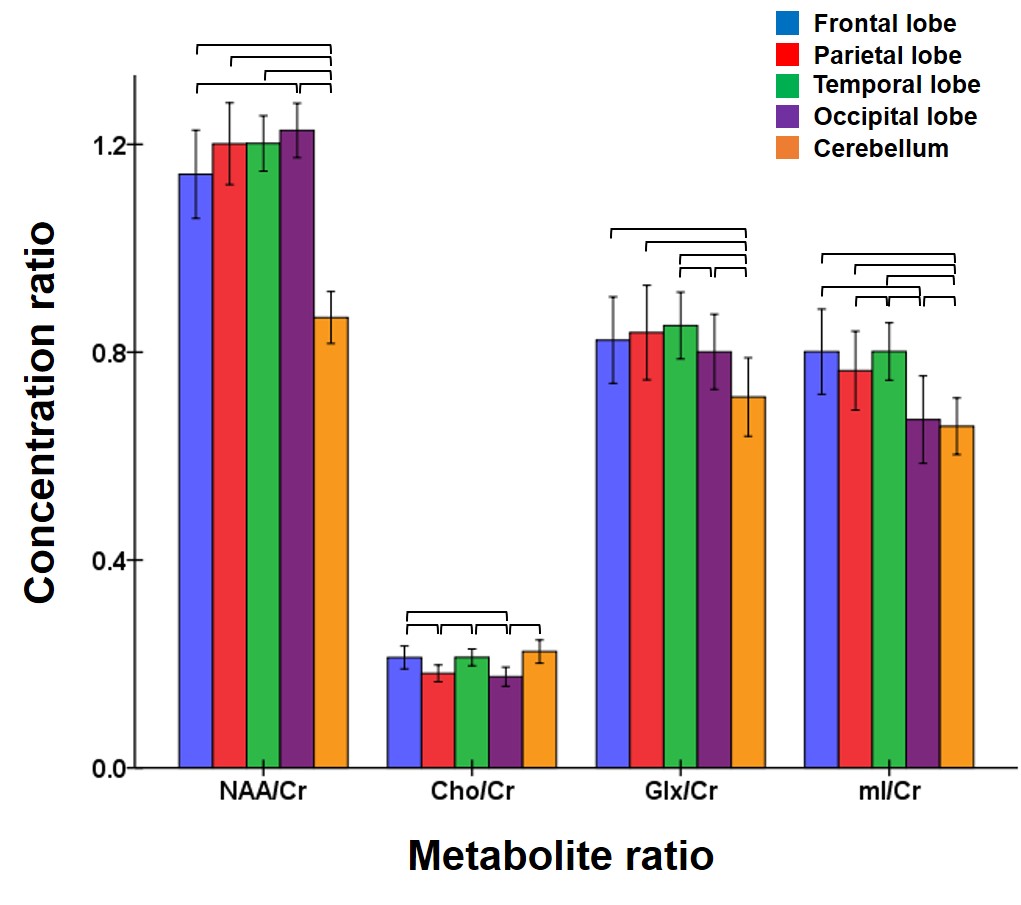
Bar diagrams showing the regional variation in major
metabolite ratios. Error bars indicate standard deviation and brackets denote statistical
significance (corrected-P<0.05).
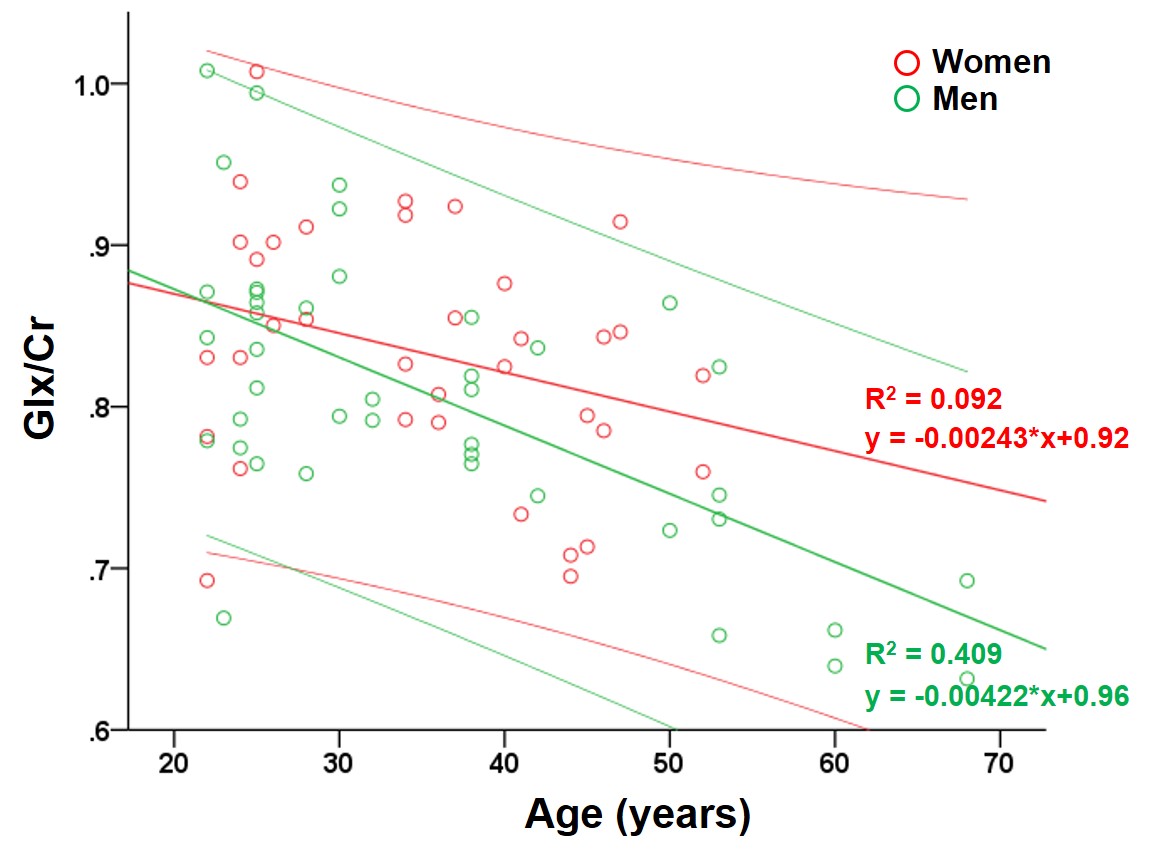
Scatterplots showing correlation between the mean Glx/Cr of the parietal lobe and age for each gender group. The lines indicate the mean and 95% confidence interval. Higher degree of correlation in men is noted.
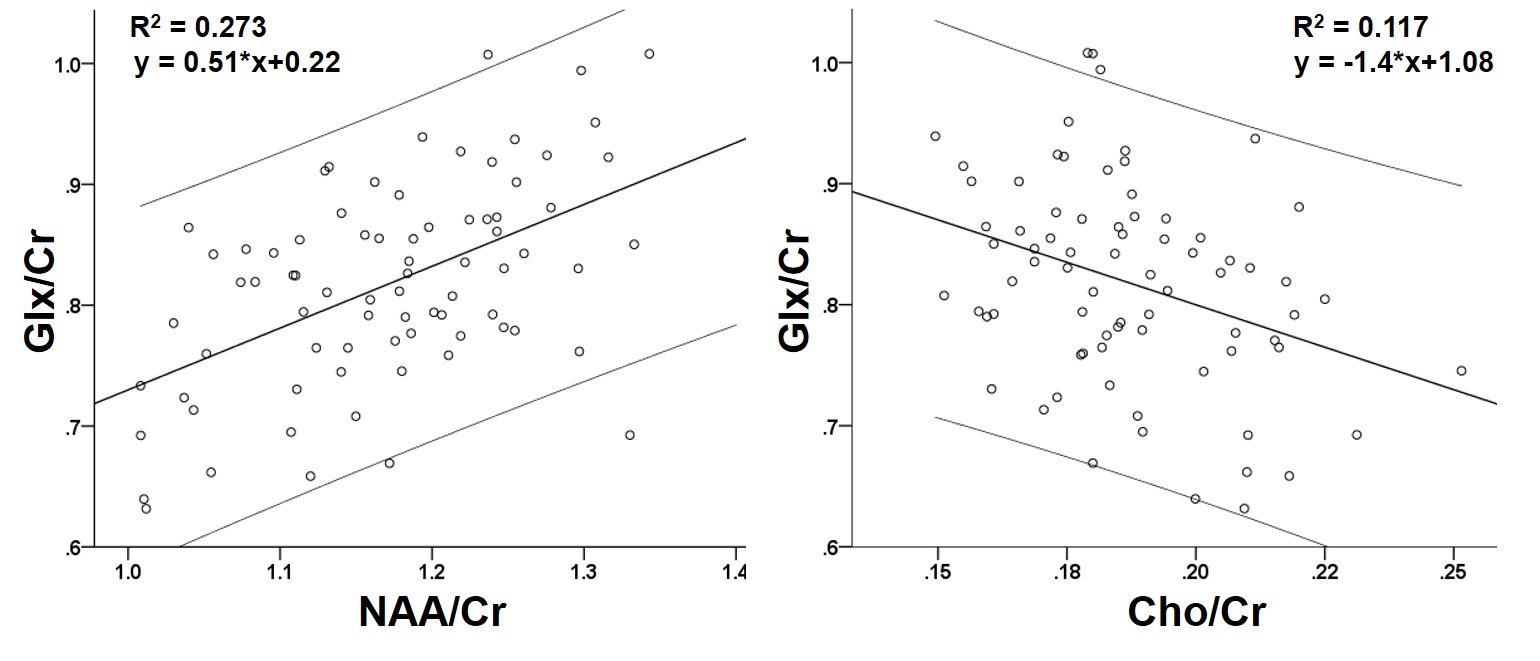
Scatterplots showing the relationship among major metabolite ratios of the parietal lobe. The lines indicate the mean and 95% confidence interval.