4252
Error estimate in temperature measurement using 1H MRS with water suppression1Department of Pshchiatry, Columbia University, New York, NY, United States, 2Division of Molecular Imaging, New York State Psychiatric Institute, New York, NY, United States
Synopsis
Proton MRS thermometry exploits the property of temperature dependence of water signal. Most of MRS thermometry utilizes partially suppressed water signal or separately measured water signal without water suppression, in addition to the water suppressed signal for metabolites. This work shows that these approaches are either inaccurate or imprecise. The resultant errors may undermine clinically significant temperature changes. Simultaneous or interleaved measurement of unsuppressed water signal and metabolite/lipid signal is desirable.
INTRODUCTION
Proton MRS-based thermometry exploits the chemical shift (CS) difference between water, whose CS is temperature-dependent, and a temperature-independent reference, such as NAA, to measure tissue temperature in absolute value [1-3]. The accuracy of MRS thermometry depends on accurate measurement of water resonance. In most cases, the water frequency is obtained from partially suppressed 1H MRS or from separately acquired non-water-suppressed 1H MRS, in addition to a water suppressed MRS for NAA measurement. Despite the general recognition that the frequency of suppressed water is altered by water suppression pulses [4], no quantitative studies assess the accuracy and precision of water suppressed 1H MRS thermometry. This issue is of importance because the temperature in human body part such as the brain may fluctuate 2-3 oC under different pathophysiological conditions and a temperature change of a fraction of a degree may be clinically relevant [5]. The purpose of the current study was to estimate the accuracy and precision of 1H MRS thermometry that uses partially suppressed water or separately measured unsuppressed water signals.METHODS
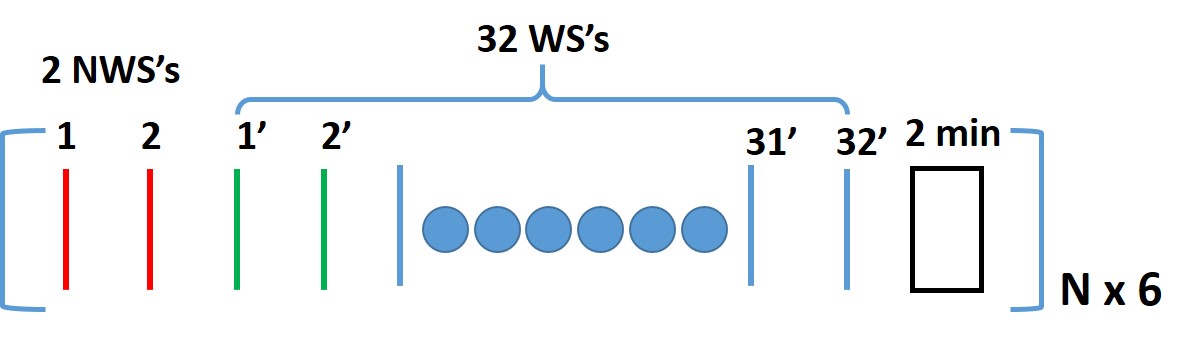
Data acquisition All data were acquired on a 3T scanner (GE Discovery 750W) with an 8-channel head coil from 10 human subjects after obtaining approval from IRB and informed consent from the participants. The schedule of 1H MRS scan is shown in Figure 1. Scans were performed with PRESS sequence with the following parameters: TR=3s, TE=68ms, spectral width=5000 Hz, FID data points=1024, voxel size=30x25x25 mm3. The voxel was placed in the medial prefrontal cortex. Total MRS scan time was about 90 min.
Data processing We first combined the signals from coil elements. We employed peak picking method for frequency measurement as we found it was more accurate than spectral fitting in our case. We calculated frequency differences between: (1) the two unsuppressed water signals fw1w2, (2) the first two partially suppressed water signals fw1’w2’, and (3) the second unsuppressed water and the first suppressed water fw2w1’. We converted frequency differences in Hz to the “equivalent” temperature differences in oC using the following equation:
ΔTab=97.134(fb - fa)/f0
where f0 is the system frequency in MHz and a/b represents w1,2 or w1’,2’. We calculated the means and standard deviations of {ΔTab}N (where N = 6) of the 6 pairs of the two unsuppressed water signals, the two suppressed water signals, and the 2nd unsuppressed water and the 1st partially suppressed water, respectively, for each of the 10 subjects (Figures 2,3). In ideal case, Δfab and ΔTab should be zero and we therefore termed non-zero values of Δfab and ΔTab as errors of the frequency and the temperature, respectively. We performed T-test and F-test to determine if there are significant differences in the means and the variations of the {ΔTab} among the subjects.
RESULTS
The rate of water suppression was about 90% to 95%, leaving partially suppressed water signal of about 5% to 10% of unsuppressed water. Visual inspection reveals frequency shifts and lineshape distortions of the partially suppressed water signal compared with the unsuppressed water signal (Fig. 2). The frequency differences may render a temperature error up to 1.6 oC. The variations of the temperature differences between unsuppressed and partially suppressed water signals ΔTw2w1’, converted from the frequency differences, are significantly larger than those of ΔTw1w2 or ΔTw1’w2’ (Fig. 3, Table 1), indicating poor precision. Numerical calculation shows that the errors in absolute temperature can be as large as 0.6 oC. The mean values of temperature differences between unsuppressed and suppressed water in individual subjects are far from the zero value, indicating low accuracy.DISCUSSION
Many factors, including B0 field shift, subject motion, and spectral artifacts, may cause frequency shifts of the water signals, thus introducing errors in temperature measurement. Because two contiguous FIDs in Fig. 1 are separated only by 12 seconds, the frequency shifts between the two unsuppressed water FIDs (w1 and w2) or between the two partially suppressed water FIDs (w1’, w2’) should be small, which is largely in agreement with the results (Fig. 3, Table 1). Therefore, the significantly large variations in frequencies of unsuppressed and partially suppressed water signals may be mainly attributed to the spectral artifacts caused by water suppression pulses.CONCLUSION
The relatively small variations between suppressed water signals or unsuppressed water signals but large variations between suppressed and unsuppressed water signals show that (1) using partially suppressed water signal in MRS-based thermometry may have systematic errors in absolute temperature values and (2) using separately measured unsuppressed water and NAA signals may have large variation in repeated temperature measurements. These errors may undermine clinically significant temperature changes. Simultaneous measurement of unsuppressed water and NAA is highly recommended [6, 7].Acknowledgements
References
1. Murakami, T., et al., Brain temperature measured by using proton MR spectroscopy predicts cerebral hyperperfusion after carotid endarterectomy. Radiology, 2010. 256(3): p. 924-31.
2. Babourina-Brooks, B., et al., MRS water resonance frequency in childhood brain tumours: a novel potential biomarker of temperature and tumour environment. NMR Biomed, 2014. 27(10): p. 1222-9.
3. Inoue, T., et al., Noninvasive measurement of human brain temperature adjacent to arteriovenous malformation using 3.0T magnetic resonance spectroscopy. Clin Neurol Neurosurg, 2013. 115(4): p. 445-9.
4. Dehkharghani, S., et al., Proton resonance frequency chemical shift thermometry: experimental design and validation toward high-resolution noninvasive temperature monitoring and in vivo experience in a nonhuman primate model of acute ischemic stroke. AJNR Am J Neuroradiol, 2015. 36(6): p. 1128-35.
5. Thrippleton, M.J., et al., Reliability of MRSI brain temperature mapping at 1.5 and 3 T. NMR Biomed, 2014. 27(2): p. 183-90.
6. Dong, Z., Proton MRS and MRSI of the brain without water suppression. Prog Nucl Magn Reson Spectrosc, 2015. 86-87: p. 65-79.
7. Maudsley, A.A., M.Z. Goryawala, and S. Sheriff, Effects of tissue susceptibility on brain temperature mapping. Neuroimage, 2017. 146: p. 1093-1101.
Figures