4250
Ultra-high field MRS and high spatiotemporal resting fMRI of the default mode network: A reproducibility study1Medicine and Radiology, University of Melbourne, Parkville, Australia, 2Monash University, Monash, Australia, 3Alfred Hospital, Richmond, Australia
Synopsis
This study investigated the reproducibility of measuring brain glutamatergic nuerotransmitters and glutathione using MRS, and their correlation with high spatiotemporal resolution resting state fMRI and subject age at 7T. Repeat MRS measurements across two time points showed excellent reproducibility (ICC > 0.75) for all metabolites. Both the ratio of Glutamate/Gaba and functional connectivity correlated independently with subject age. Ultra-high field MR is ideal for studying the association between brain biochemistry and function in neurological diseases.
Purpose and Background
The purpose of this study was to use improved MRS spectral and fMRI spatiotemporal resolution achievable at ultra-high field to:
- Investigate the quantification and reproducibility of glutametergic (GABA and GLU) neurotransmitters and glutathione (GSH) concentrations in a main node of the default mode brain network (DMN).
- Quantify the functional connectivity (FC) of the DMN at high spatiotemporal resolution
- Investigate the correlation of DMN-FC and glutamate/gaba ratio with subject age.
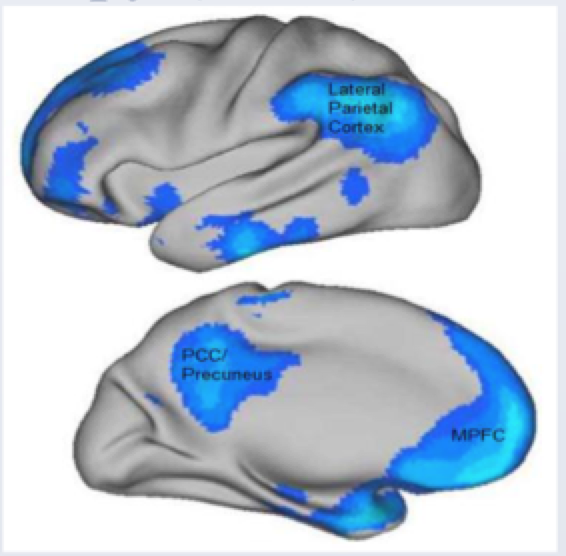
The DMN connectivity has been shown to be reduced in patients with various neurological pathologies including epilepsy, dementia, and psychosis. Furthermore, evidence from several studies suggests that in certain types of epilepsy the FC differences correlate with duration of epilepsy, response to treatment, and seizure focus laterality. The posterior cingulate cortex (PCC)/precuneus is a main node of the DMN. In addition, GSH is a vital brain anti-oxidant important for protecting cells against oxidative stress. Previous studies investigating the relationship between the concentrations of the main excitatory and inhibitory cortical neurotransmitters, Glu and GABA, and FC of the PCC/precuneus, have shown conflicting results at 3T. This may be due to the overlap between GABA, GLU, glutamine (Gln) and GSH resonances in magnetic resonance spectroscopy (MRS) obtained in field strengths up to 3 Tesla, making it difficult to measure their precise concentrations. MRS at 7T enables better separation of the resonances and has been found to reproducibly quantify GLU and GABA in other brain regions [1,2], which can be correlated with FC measures.
Methods
Ten healthy right-handed volunteers ranging in age from 23-68 underwent 7-Tesla MRI scans on two different days that included 3D anatomical MP2RAGE imaging . Resting-state fMRI was acquired on the first day using a high temporal (TR=800ms) and a spatial (1.6 mm isotropic resolution) using a multi-band EPI sequence [4]. MRS of a single 8 mL voxel, located in the PCC/precuneus, was acquired via Stimulated Echo Acquisition Mode (STEAM, Tr>8s, TM=20ms and TE = 6ms, 32 averages) twice on the first day and twice on the second day, with a break for re-positioning in between each acquisition. All scans were preceded by high-resolution anatomical scans for localisation and co-registration purposes. LCModel was used to calculate glutamate and GABA concentrations in the chosen voxel, which were normalised according to grey matter percentage to correct for partial volume effects. FC was calculated between the PCC/Precuneus and the other main nodes of the DMN (medial prefrontal cortices and lateral parietal cortices) via the CONN toolbox. Correlation coefficients were converted to normally distributed scores using Fisher’s transformation. For correlation and regression analysis the MRS results immediately acquired after resting-state fMRI were chosen. To measure neurotransmitter reproducibility both intra and inter subject covariance was measured, in addition to an interclass cross correlation ratio (ICC) with a random effects model. All anatomical scans were co-registered so that the inter session MRS voxel overlap could be quantified using the Dice coefficient.Results
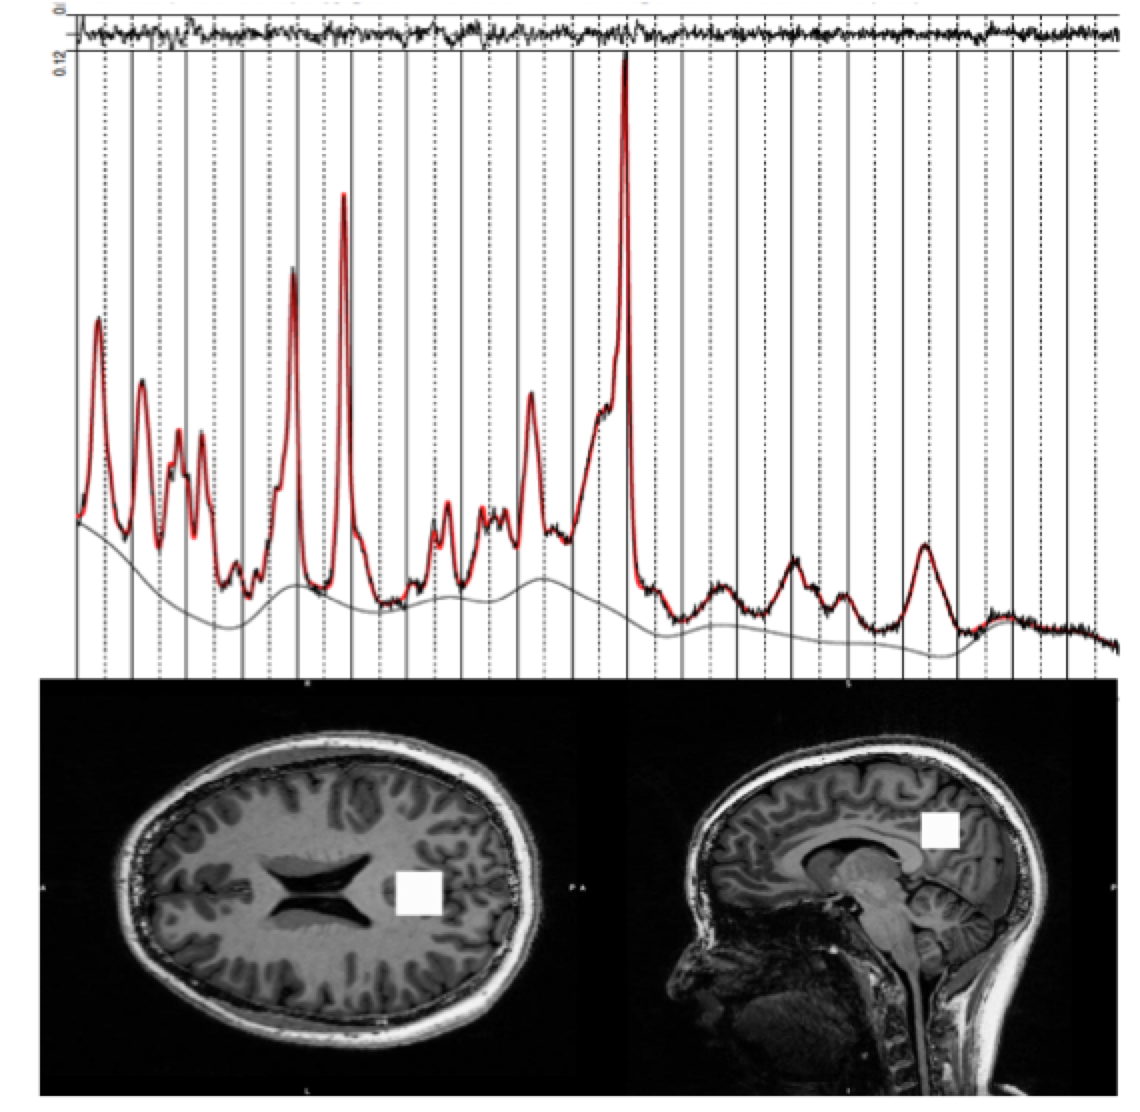
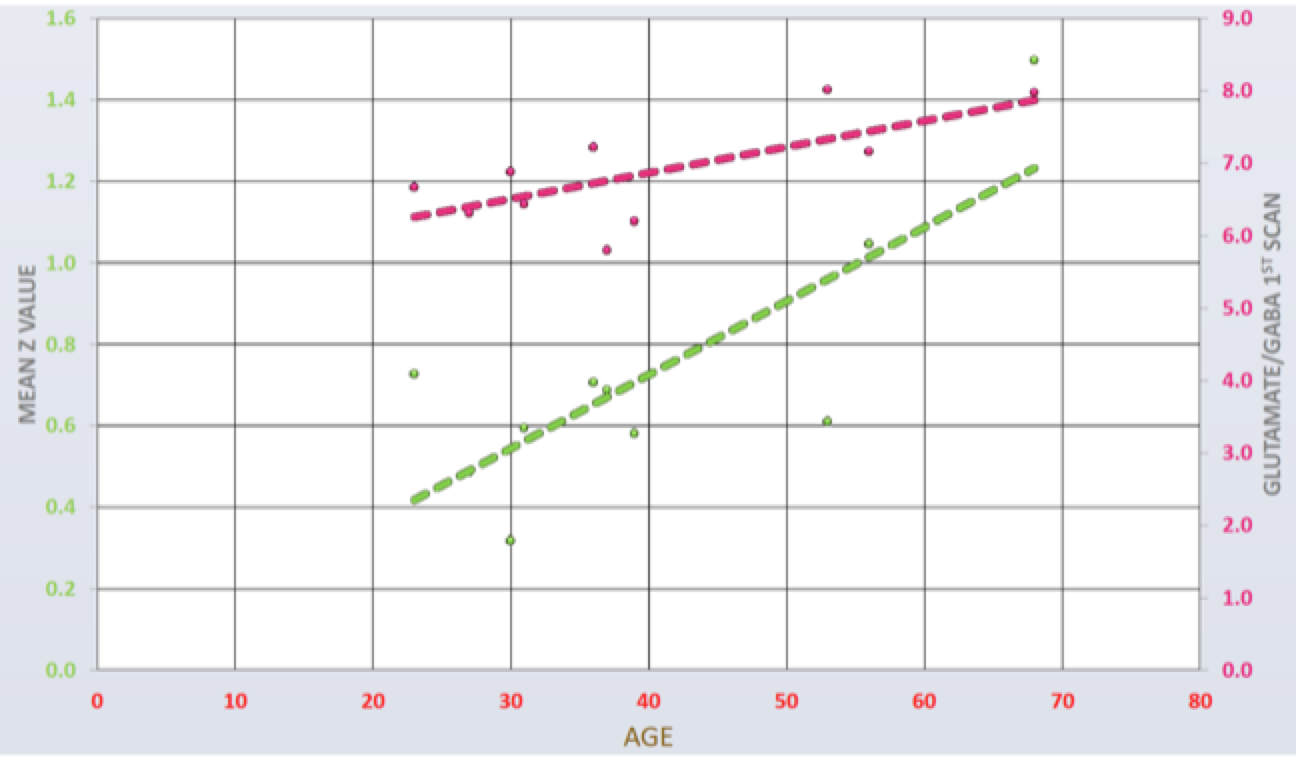
Figure 1 shows a very typical MRS data set. For all MRS studies the CLRB values for all of GLU, GABA and GSH were less than 20% indicating that the SNR and spectral line widths were of sufficient quality to separate these glutamatergic molecules. In addition, because the MRS voxel was placed (Fig. 1b) by the same qualified neurologist (OMG) the mean Dice coefficients within and between sessions were excellent at 0.9 and 0.86 respectively. The mean intra subject coefficients of GLU, GABA and GSH were 6.4%, 11.7 and 10.8%, respectively; and the inter subject variations were 9.5%, 17.5 and 14.9%, respectively. In addition, the ICCs across the two sessions were all very good (different word from very good) (0.78, 0.85 and 0.75). Both mean FC of the PCC/precuneus to the other DMN nodes (Fig. 2) and the glutamate/GABA ratio correlated (Fig. 3) with age (R=0.78, p=0.007; R=0.71, p=0.023, respectively). Multiple regression analysis demonstrated no correlation between the glutamate/GABA ratio and the FC of the PCC/precuneus after adjustment for age (adjusted R2=0.51, p=0.900).Conclusions
Ultra-high field MR is a reproducible technology to investigate the inter relationship between brain biochemistry and function in neuropathologies. The estimates of GABA, GLU and GSH in the PCC node of the DMN are highly reproducible when quantified using the STEAM sequence corrected for voxel partial volumes. The improved SNR available at 7T allowed excellent quality resting fMRI to be acquired at a temporal resolution of 800ms with whole brain coverage of 1.6 mm isotropic voxel resolution. The ratio of GABA/Glu and FC was found to be significantly age dependent and therefore this needs to be considered in any large study of neurochemistry and/or connectivity in neuropathologies.Acknowledgements
FUNDING: The Royal Melbourne Hospital Neuroscience Foundation. The 7T scanner and BAM are supported by the National Imaging Facility via the Australian Government NCRIS program.References
1. Wijtenburg et al., J Magn Reson Imaging. 2013; 38(2): 460–467. doi:10.1002/jmri.23997.
2. Lally et al., J. Magn. Reson. IMAGING 2016;43:88–98.
3. Marques, et al. Neuroimage. 2010 Jan 15;49(2):1271-81. doi: 10.1016/j.neuroimage.2009.10.002.
4. Moeller et al., MRM 2009, 63:1144–1153
Figures