4248
Characterization of Downfield Resonances and their T2 Relaxation times in Human Brain at 9.4 T1MRZ, Max Planck Institute for Biological Cybernetics, Tuebingen, Germany, 2IMPRS for Cognitive and Systems Neuroscience, Eberhard-Karls University of Tübingen, Tuebingen, Germany
Synopsis
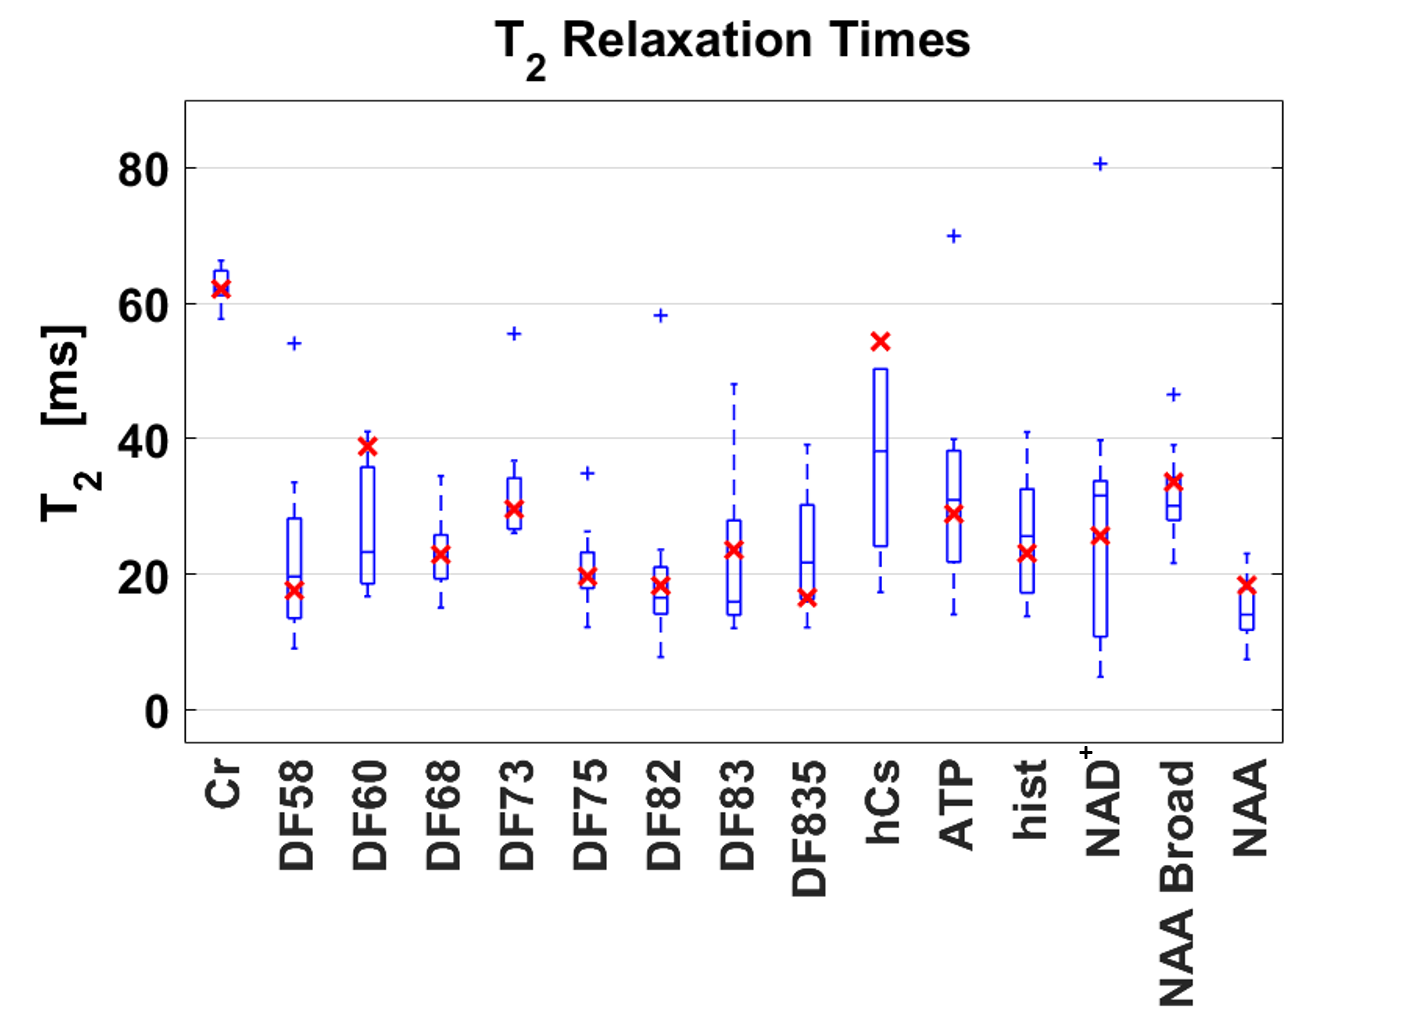
In this abstract, we report the apparent T2 relaxation times of the downfield peaks in the human brain at 9.4 T. In addition, we look for correlations between different downfield peaks and between downfield and upfield metabolites. Further, concentrations of all downfield resonances after correcting for both water and peak relaxation times are reported for the first time.
Introduction
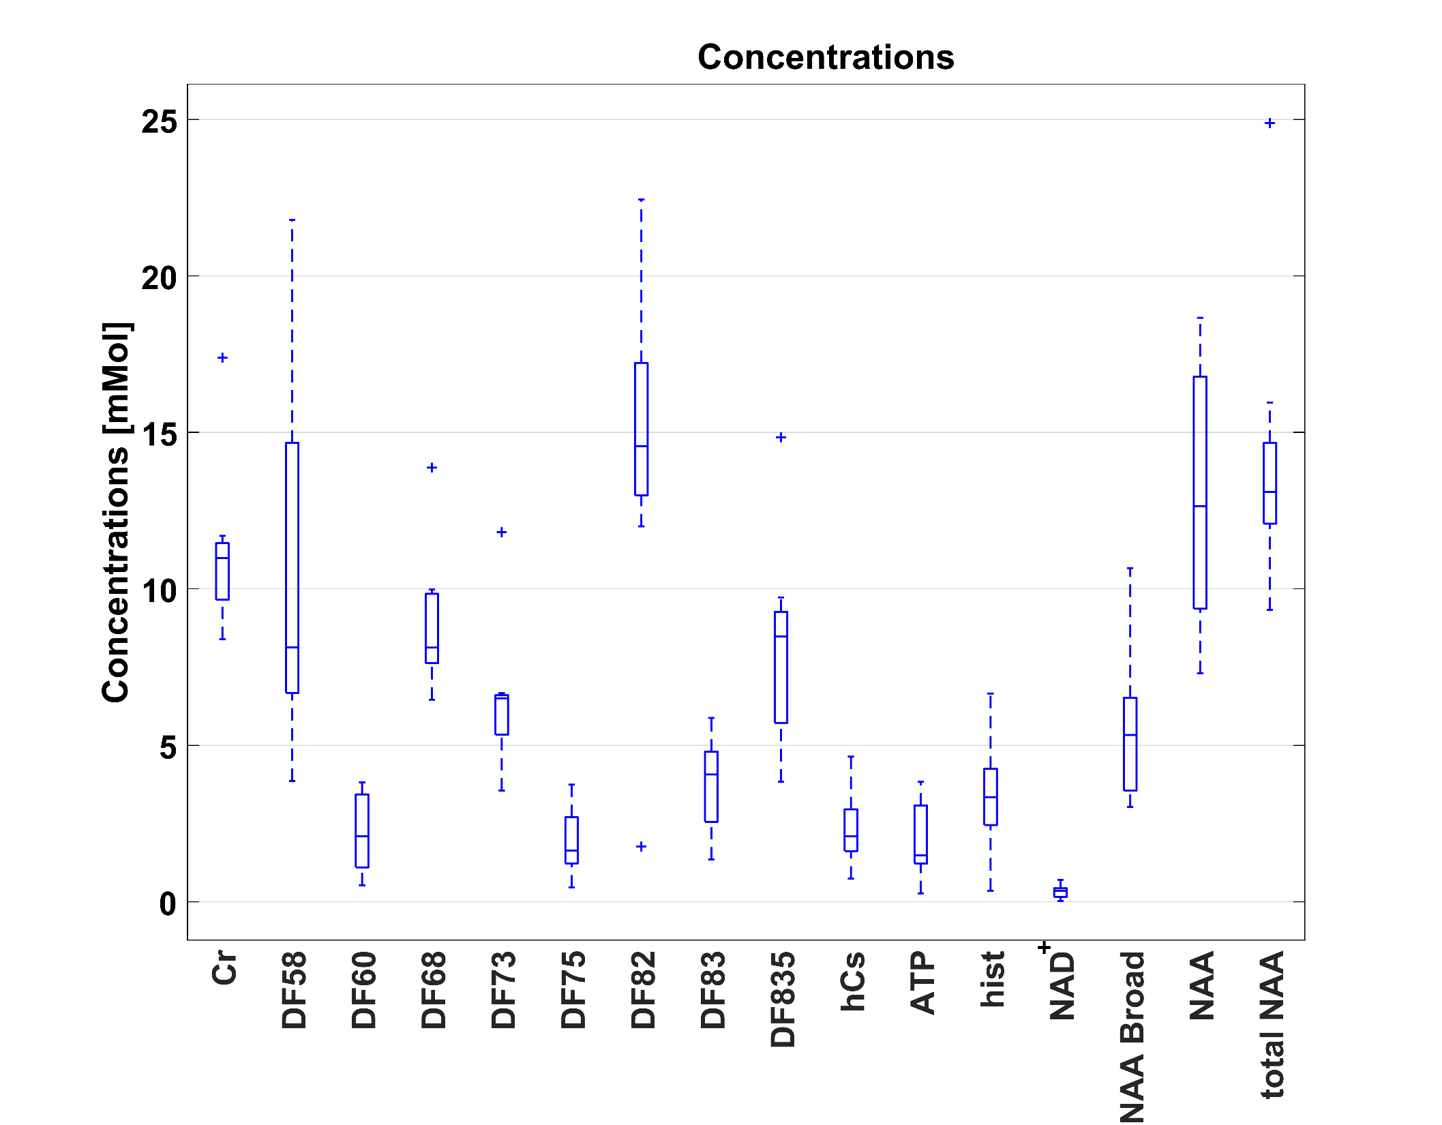
The downfield peaks in 1H spectra pose a challenge to the MRS community with low SNR, overlap of resonances and several exchangeable protons1-3. In previous work4, we reported the T2 relaxation times for the downfield peaks estimated from summed spectra of six data sets. Herein, we characterize the downfield resonances more comprehensively. We report their apparent T2 relaxation times calculated from both summed spectra and individual data sets of 11 healthy volunteers in the human brain at 9.4T. In addition, we correlate between concentrations of different downfield peaks and between downfield and upfield metabolite resonance lines. Concentrations of all downfield resonances after correcting for both water and peak relaxation times3,10,13,14 are reported for the first time as well. This has brought us a step closer in assigning the unknown downfield peaks.Methods
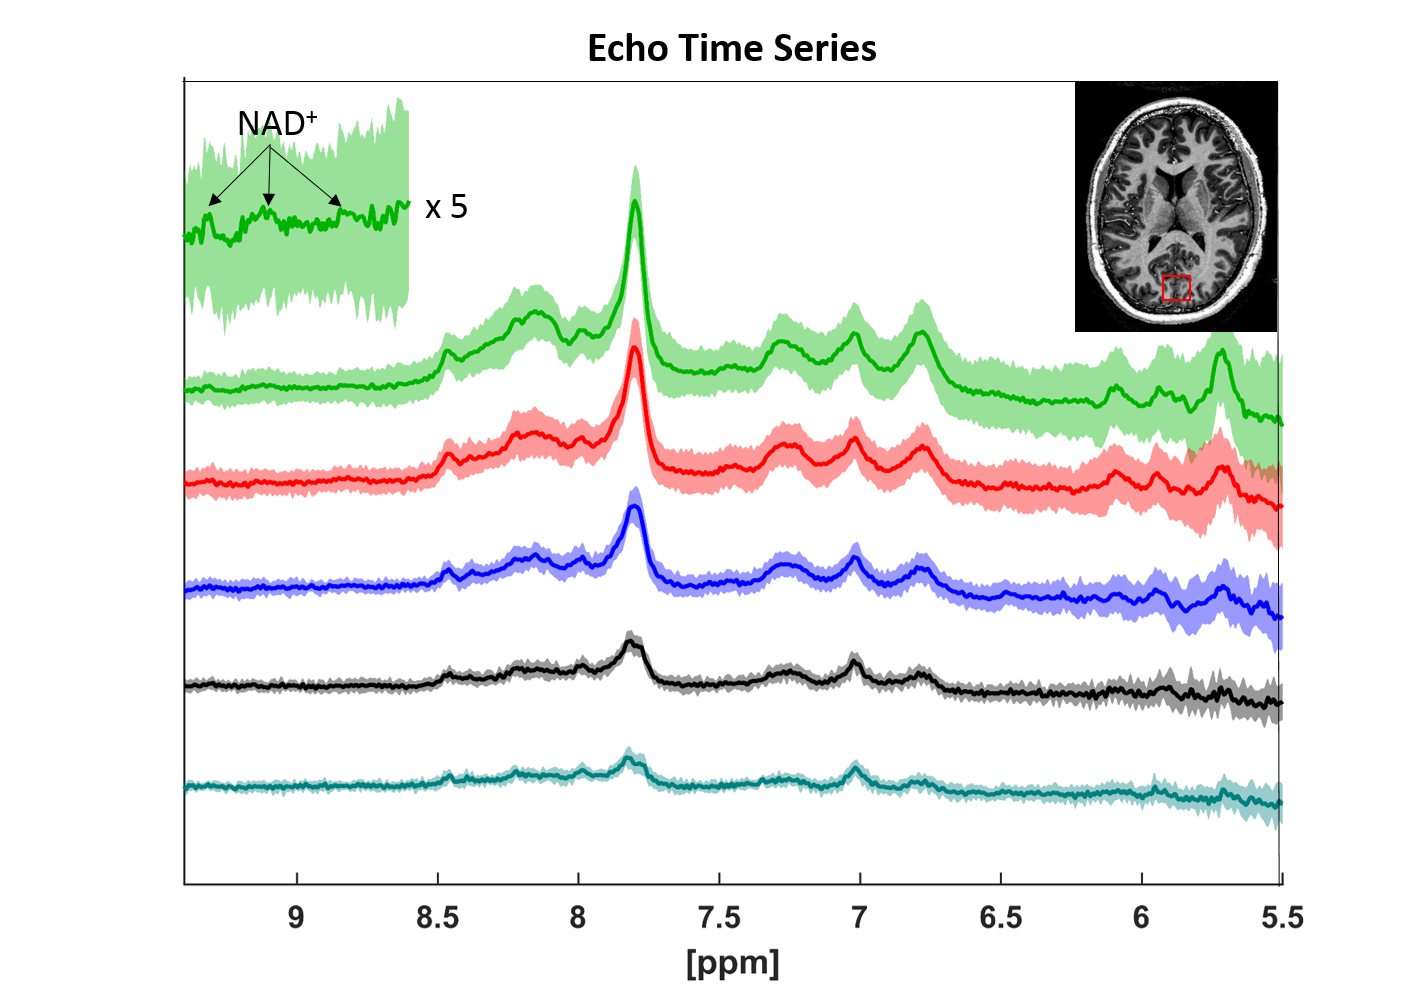
The measurements were performed on a Siemens 9.4T MRI scanner in 11 healthy volunteers. The coil5 was driven in the surface mode. A voxel (2x2x2 cm3) (average WM=28%, GM=64.5%, CSF=6.65%) was chosen in the occipital lobe. The spectra were acquired using a metabolite-cycled semi-LASER sequence6 with RF frequency centered at 7.0ppm (TR 6000ms). An echo-time series was acquired with TE = 24, 32, 40, 52, 60 ms (NEX=96).
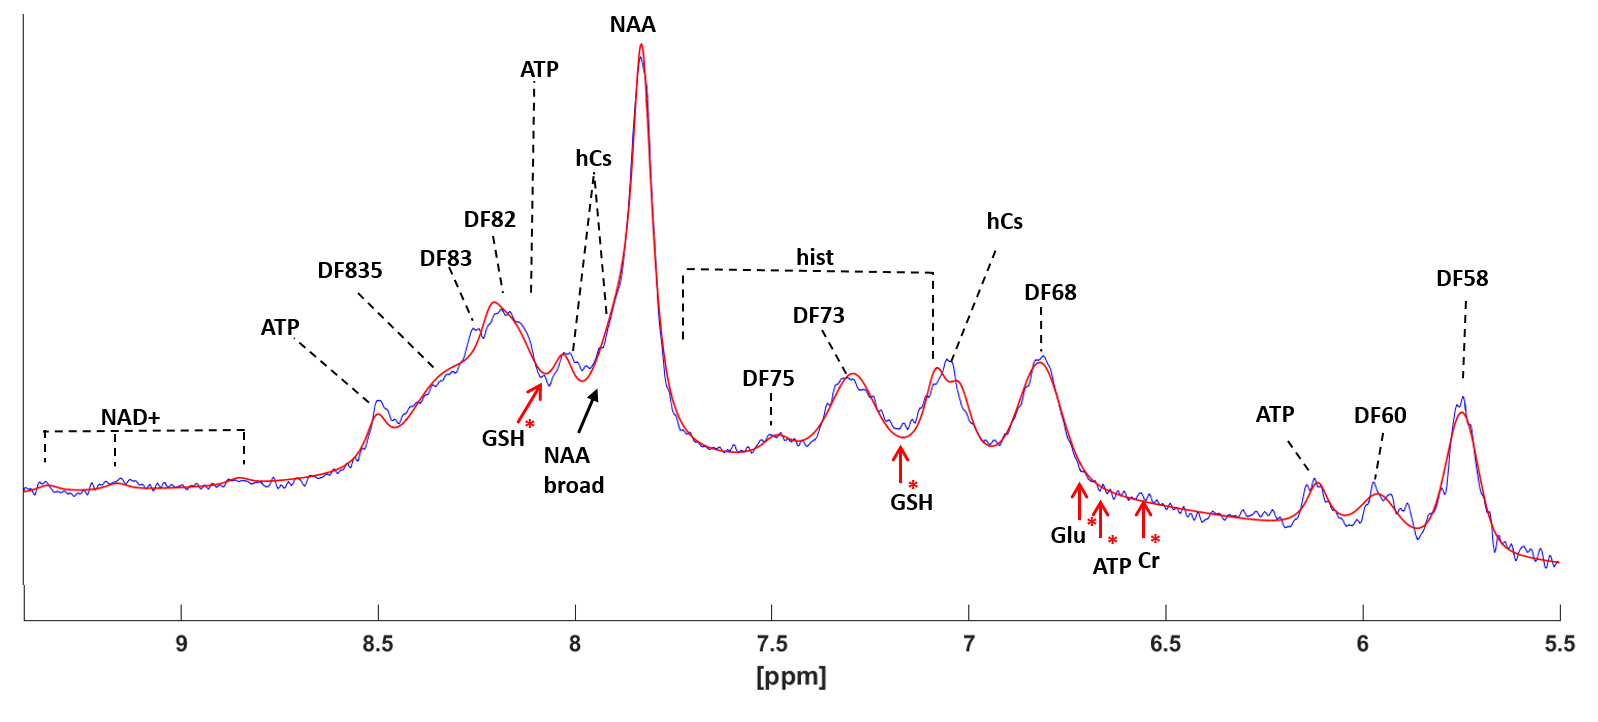
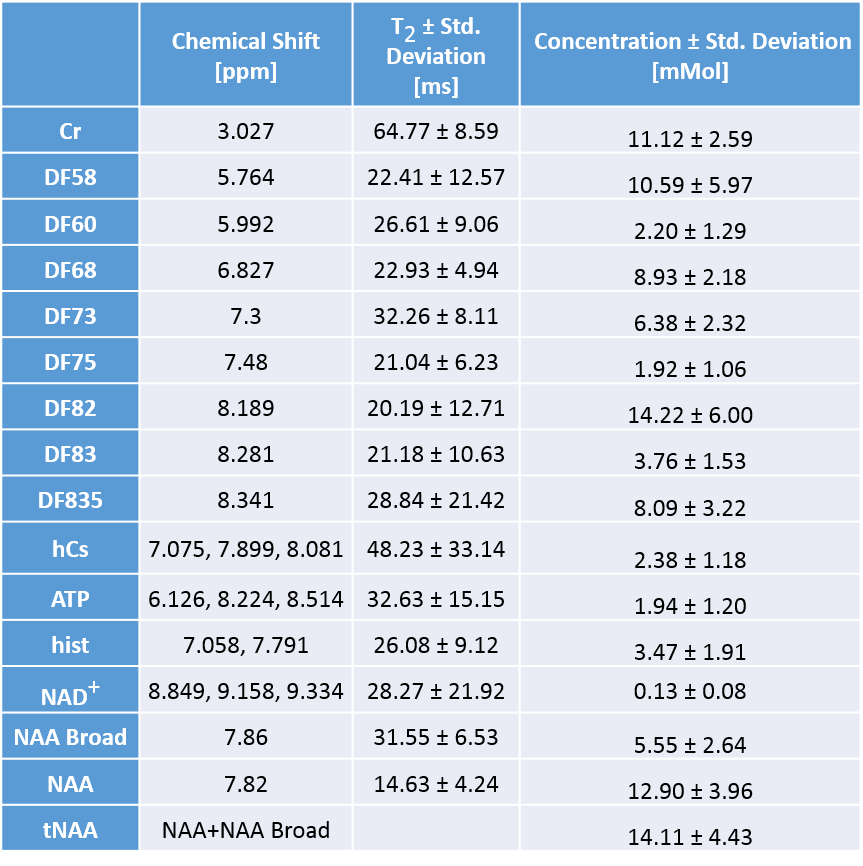
Voigt lines were simulated in LCModel-v6.37 to create a basis set based on literature chemical shifts8. Summed and individual spectra were fit for all TEs. Peak pairs were introduced for homocarnosine (hCs), NAD+ based on previous knowledge3,9,10, , and adenosine triphosphate (ATP) and histidine (hist) after pairwise Spearman correlation(see Results). The T2 relaxation times were calculated by fitting exponential functions to the TE dependent signal intensity decay data. Normalized concentrations of downfield resonances were found using internal water reference11 after corrections for tissue compartments12, water relaxation13,14, T13,10 and T2 relaxation times for the peaks. However, proton densities were not included in these correction calculations.
Results
A pairwise Spearman Correlation test was performed on the concentrations of the peaks at 6.127 and 8.514ppm, finding a positive correlation (p< 0.05, R >0.80 and 0.70 respectively).
Adding paired histidine peaks (7.06, 7.79ppm) and a hCs peak at 7.79ppm improved the correlation between upfield NAA and downfield resonances of tNAA to R=0.79, p< 0.03. Further, strong correlation was observed between the downfield hCs peak and GABA in the upfield spectra(R=0.85, p< 0.05). The Nicotinamide moiety of NAD+ (9.334, 8.849, 9.158ppm) was visually observable. Hence, these non-overlapping peaks were added to the model. T2 relaxation times and concentrations are reported in Table 1.
Discussion
The 6.127 and 8.514ppm ATP peaks were added to the basis set since a strong correlation between the peaks was observed and 8.224 ppm based on literature8. They were given as a combined basis vector; in future, these lines will be modelled in order to avoid the error in the T2 values. Since LCModel could not account for other overlapped components the entire peak at 6.127 ppm was assigned as ATP, this could have led to error in concentrations. However, future tasks would include to fit on other fitting tools where the overlapped components can be accounted for.
According to Petroff et al.16, hCs is present in higher amounts in GM in the human brain. ATP, GABA and histidine are involved in the synthesis of hCs; while GABA and histidine are degradation products of hCs16. In addition, the strong correlation between the downfield hCs peak and GABA in the upfield spectra may be due to a direct contribution of hCs to the upfield GABA resonance or a physiological correlation due to the processes mentioned above.
Histidine has a T2 relaxation time of 101±19ms at 1.5T17; hence, we expect it to be present in our spectra as well. Adding histidine peaks to the fitting model improved the correlation between upfield NAA and downfield tNAA, thus confirming the presence of histidine. The concentration of histidine is higher than previously reported17; this potentially comes from over estimating histidine due to other underlying components.
Since our spectra are non-water suppressed, we visually observe the non-overlapping, fast-exchanging Nicotinamide moiety peaks of NAD+.
Conclusion
Modelling a basis set for the downfield with Voigt lines for peaks like ATP, histidine, hCs, NAD+, and other observable resonances resulted in a good fit and minimal residue. Further, the correlations between peak intensities aid peak assignment to metabolites and justify the detectability of the peaks that were added to the fit model. The T2 relaxation times were calculated from the TE series spectra for all the downfield resonances. Also, the concentrations are reported which are in agreement with the literature3,10.Acknowledgements
For the funding by the Horizon 2020/ CDS-QUAMRI and SYNAPLAST grants. Special thanks to Roland Kreis for his contributions and discussions to this work.References
1. MacMillan EL, Chong DG, Dreher W, Henning A, Boesch C, Kreis R. Magnetization exchange with water and T1 relaxation of the downfield resonances in human brain spectra at 3.0 T. Magnetic resonance in medicine. 2011 May 1;65(5):1239-46.
2. Fichtner, N.D., et al., Elucidation of the downfield spectrum of human brain at 7 T using multiple inversion recovery delays and echo times. Magnetic resonance in medicine, 2017. 78(1): p. 11-19.
3. Fichtner, N.D., et al., In vivo characterization of the downfield part of 1H MR spectra of human brain at 9.4 T: Magnetization exchange with water and relation to conventionally determined metabolite content. Magnetic Resonance in Medicine, 2017.
4. Murali-Manohar S, Borbath T, Fichtner N, Giapitzakis IA, Zaldivar D, Kreis R and Henning A (June-18-2018): Estimation of T2 Relaxation Times of Downfield Peaks in Human Brain at 9.4 T, Joint Annual Meeting ISMRM-ESMRMB 2018, Paris, France.
5. Avdievich N, Giapitzakis I, Pfrommer A, Borbath T, Henning A. Combination of surface and ‘vertical’loop elements improves receive performance of a human head transceiver array at 9.4 T. NMR in Biomedicine 2018;31:e3878.
6. Giapitzakis IA, Shao T, Avdievich N, Mekle R, Kreis R, Henning A. Metabolite‐cycled STEAM and semi‐LASER localization for MR spectroscopy of the human brain at 9.4 T. Magnetic Resonance in Medicine 2017.
7. Provencher SW. LCModel & LCMgui user’s manual. LCModel Version. 2014 Jun 15:6-2.
8. de Graaf RA. In Vivo NMR Spectroscopy – Static Aspects. In Vivo NMR Spectroscopy. doi: 10.1002/9780470512968.ch2: John Wiley & Sons, Ltd; 2007. p 43-110.
9. de Graaf RA, Behar KL. Detection of cerebral NAD+ by in vivo 1H NMR spectroscopy. NMR in biomedicine 2014;27:802-809.
10. de Graaf RA, De Feyter HM, Brown PB, Nixon TW, Rothman DL, Behar KL. Detection of cerebral NAD+ in humans at 7T. Magnetic resonance in medicine 2017;78:828-835.
11. Gasparovic C, Song T, Devier D, et al. Use of tissue water as a concentration reference for proton spectroscopic imaging. Magn Reson Med. 2006;55:1219‐1226.
12. Ashburner J, Barnes G, Chen C, Daunizeau J, Flandin G, Friston K, Kiebel S, Kilner J, Litvak V, Moran R, Penny W. SPM12 manual. Wellcome Trust Centre for Neuroimaging, London, UK. 2014 Jun 26. 13. Wyss M, Kirchner T, Ringenbach A, Prüssmann KH, Henning A. Relaxation Parameter Mapping Adapted for 7T and Validation against Optimized Single Voxel MRS. In Proceedings of the 21st Annual Meeting of ISMRM, Salt Lake City, UT, 2013. p. 2464.
14. Hagberg GE, Bause J, Ethofer T, et al. Whole brain MP2RAGE‐based mapping of the longitudinal relaxation time at 9.4T. Neuroimage. 2017;144:203‐216.
15. Deelchand DK, Van de Moortele PF, Adriany G, Iltis I, Andersen P, Strupp JP, Vaughan JT, Uğurbil K, Henry PG. In vivo 1 H NMR spectroscopy of the human brain at 9.4 T: initial results. J Magn Reson. 2010; 206(1):74-80.
16. Petroff OA. Book review: GABA and glutamate in the human brain. The Neuroscientist 2002;8:562-573.
17. Vermathen P, Capizzano AA, Maudsley AA. Administration and 1H MRS detection of histidine in human brain: application to in vivo pH measurement. Magnetic Resonance in Medicine: An Official Journal of the International Society for Magnetic Resonance in Medicine 2000;43:665-675.
18. Giapitzakis IA, Avdievich N, Henning A.
Characterization of macromolecular baseline of human brain using metabolite
cycled semi‐LASER at 9.4 T. Magnetic resonance in medicine. 2018
Aug;80(2):462-73.
19. Marques JP, Kober T, Krueger G, van der Zwaag W, Van de Moortele PF, Gruetter R. MP2RAGE, a self bias-field corrected sequence for improved segmentation and T1-mapping at high field. Neuroimage. 2010 Jan 15;49(2):1271-81.
Figures