4247
Pointwise T2 fitting for spectral relaxography: examples in dystrophic and healthy muscle1Advanced Imaging Research Center, Oregon Health and Science University, Portland, OR, United States, 2University of Florida, Gainesville, FL, United States
Synopsis
We present a model-free approach for frequency domain transverse relaxation time (T2) analysis and post-processing. Multiple echo-time (TE) magnetic resonance spectroscopy (MRS) data is fit for M0 and T2 at each point in the frequency spectrum to produce derived plots of T2 as a function of chemical shift. T2 values of certain in-vivo resonances are in good agreement with prior literature. The spectral T2 (sT2) obtained by pointwise fitting and plotting shows remarkably defined features. Results are shown for spectra obtained from normal leg muscle and muscle in subjects with Duchenne Muscular Dystrophy (DMD).
Introduction
Efforts to characterize the relaxation properties of
magnetic resonance (MR) signals have traditionally used either of two general
approaches: i) a parametric line-shape model, or ii) a spectral integration over the range of a peak of interest.1,2,3 In the lower limit of the integration method, one considers T2
decay as a function of echo-time (TE) at a single point in the frequency
spectrum. Here, we present results of T2 fitting at each point in
the 1H spectrum using multi-TE MR spectra of muscle tissue, in vivo.
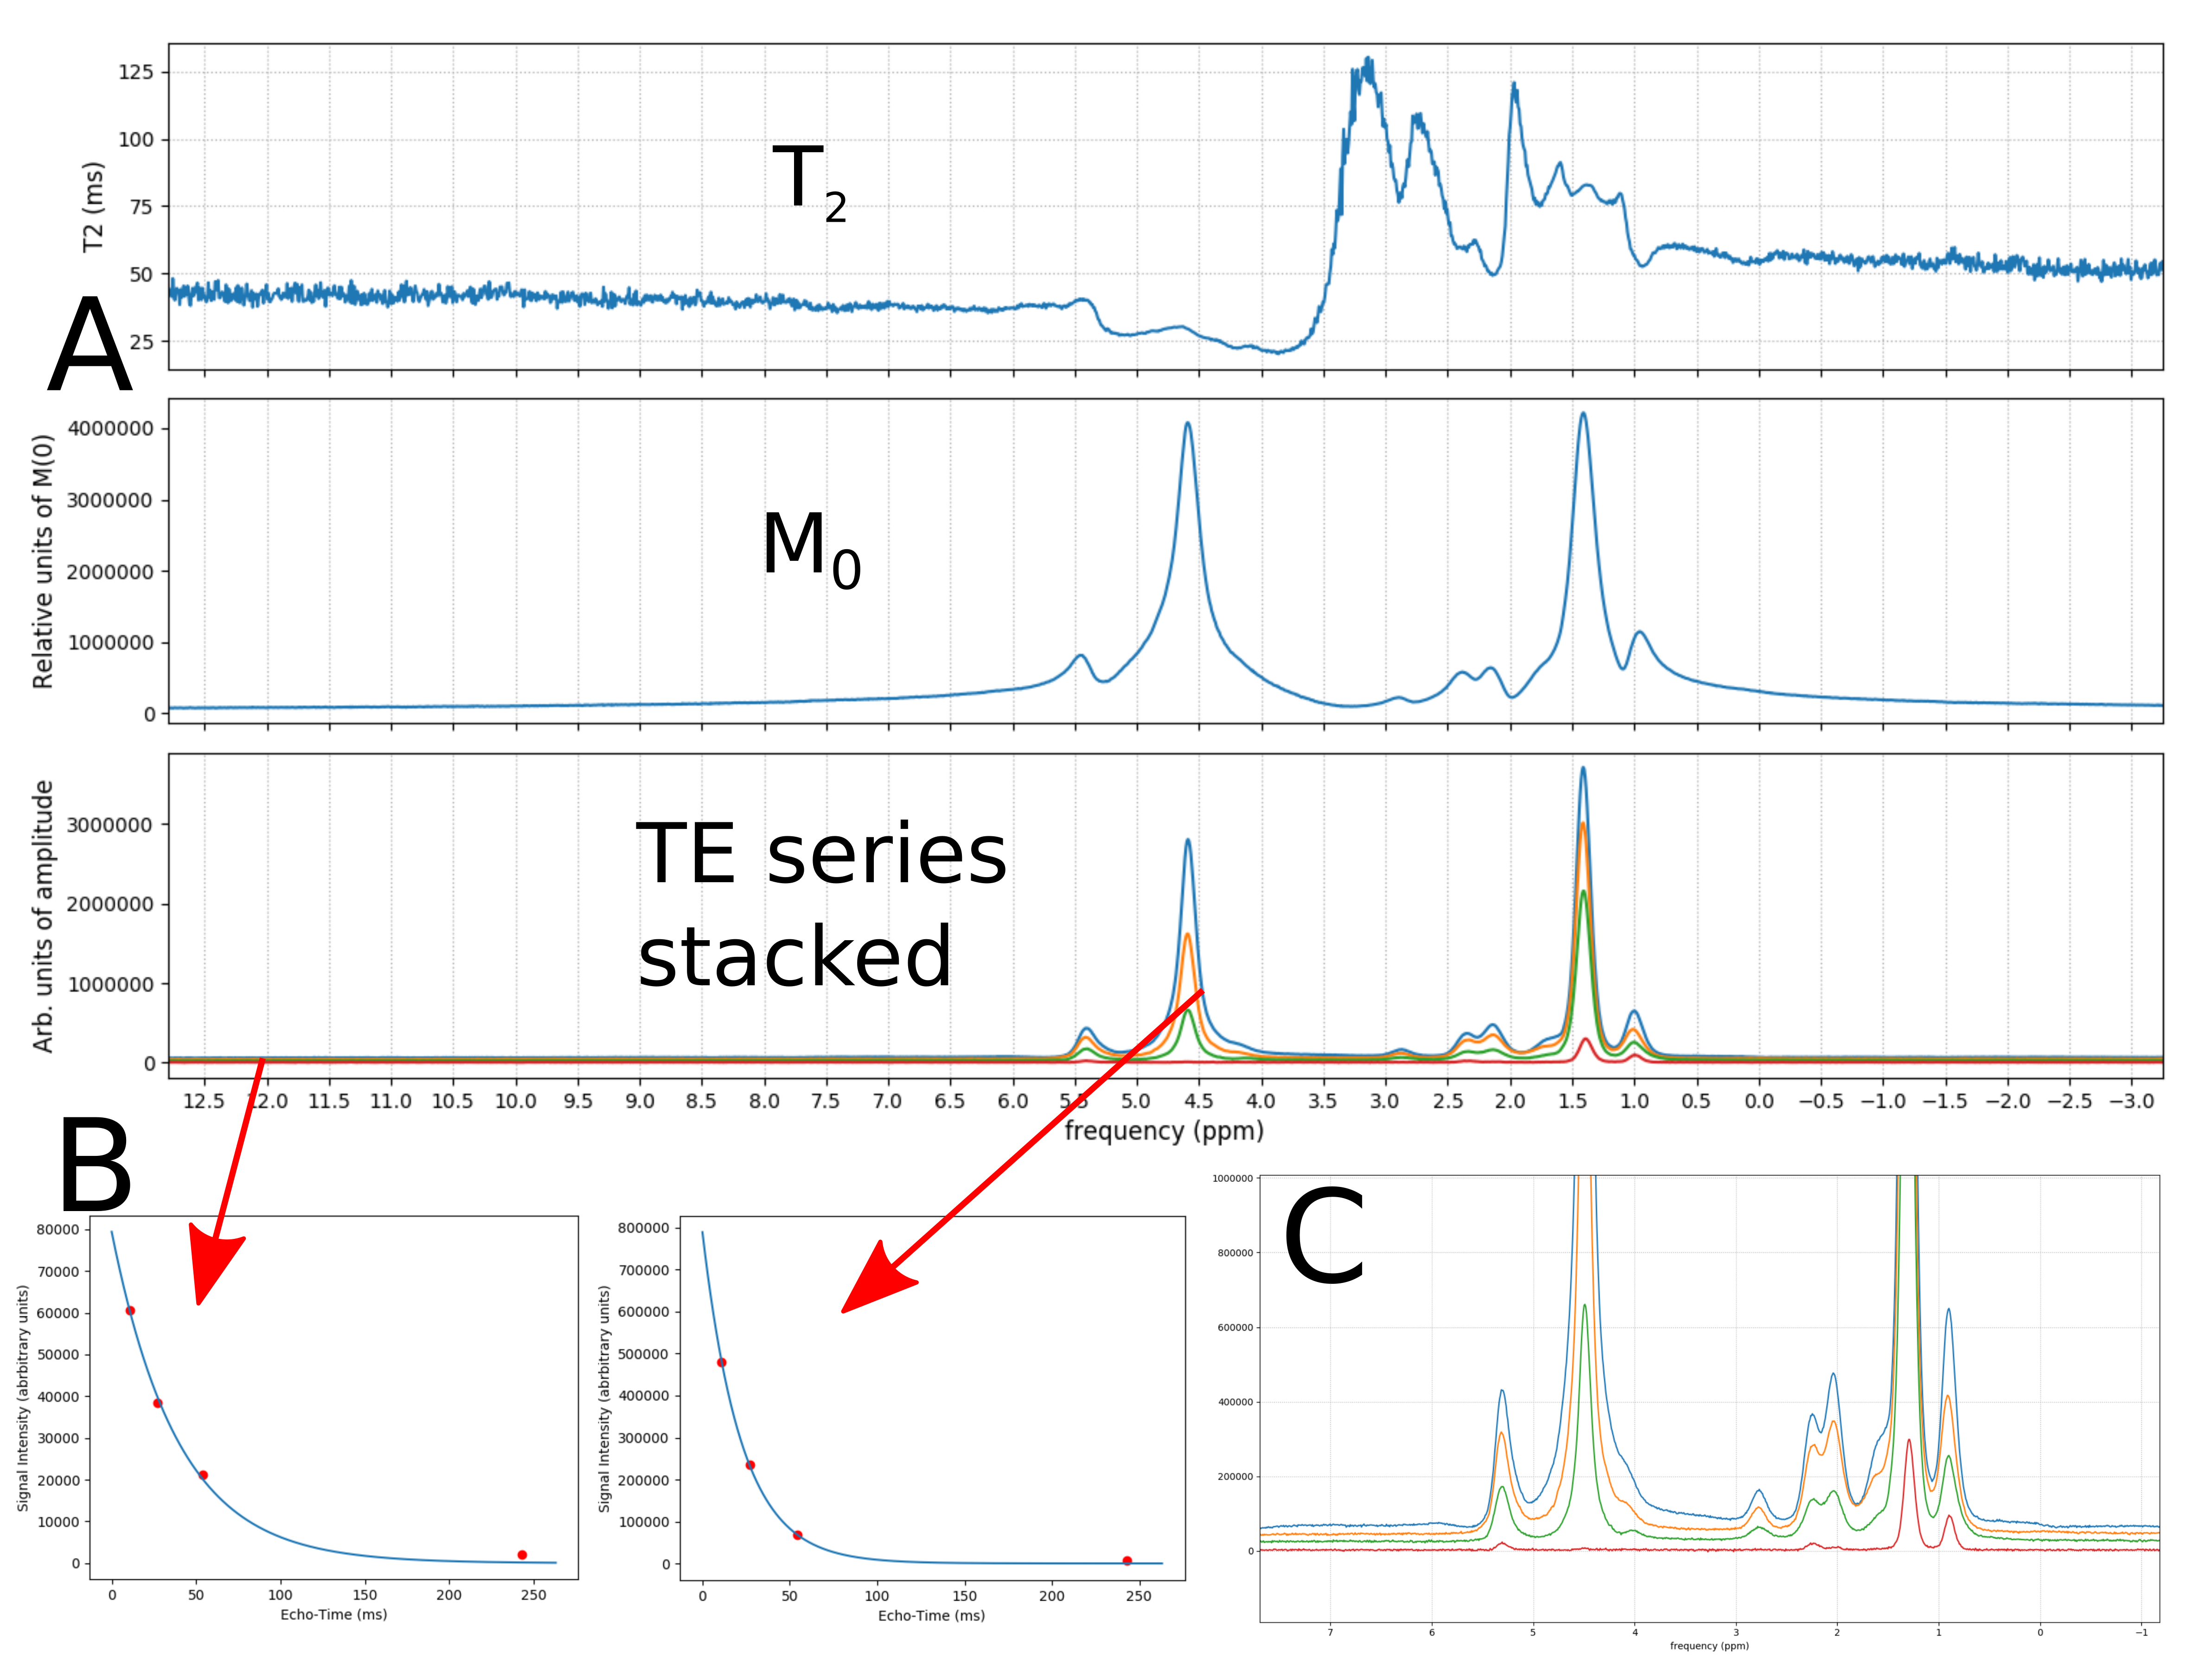
Measurement of T2 values for individual spectral peaks has been shown to depend heavily on the post-processing methods used in the analysis.1 Parametric line-shape models involve multiple assumptions including spectral fidelity, line-width, peak center-frequency, and potential baseline effects. Assumptions inherent to peak-fitting models can obscure useful information that a model-free pointwise fitting of the spectrum preserves. We employ the familiar single exponential T2 relaxation equation:
S(TE) = M0 * exp(- TE / T2)
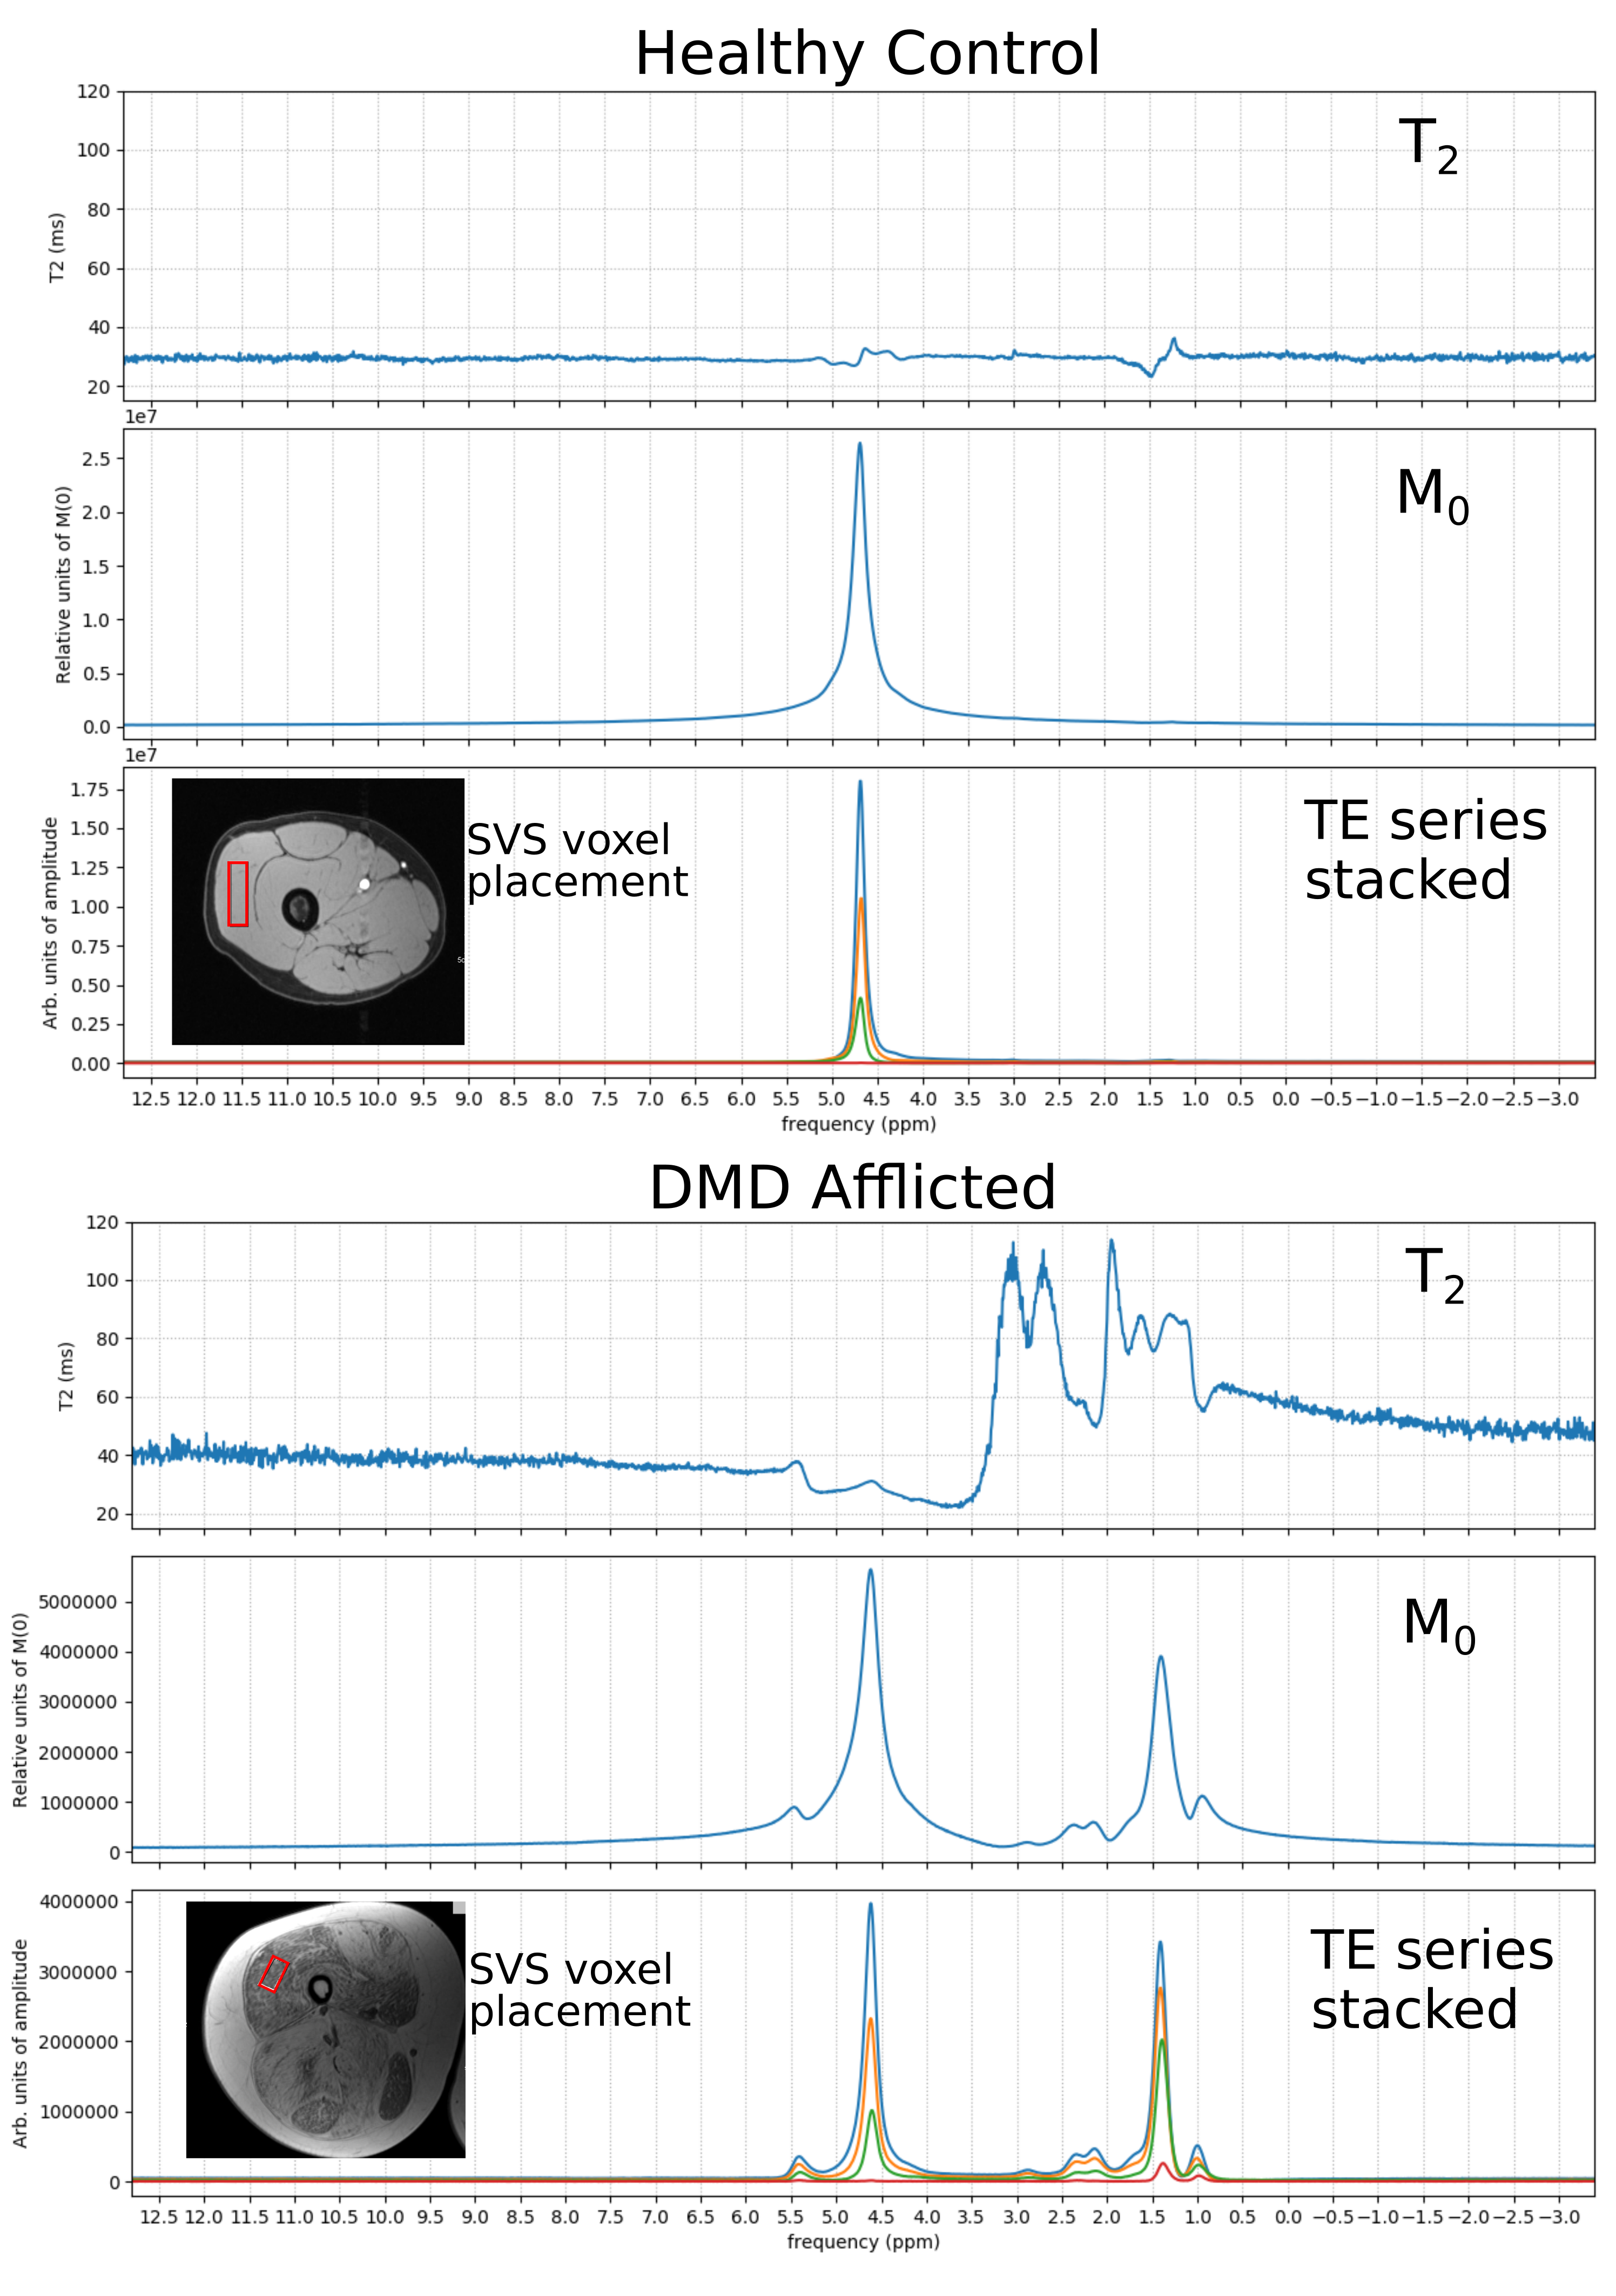
A multi-TE measurement is fit for T2, the transverse relaxation time constant and M0, the equilibrium magnetization at each point in the frequency domain of the TE-modulated spectra. Here we focus on single-voxel-spectroscopy (SVS) of the vastus lateralis (VL) muscle in both healthy individuals and boys with Duchenne Muscular Dystrophy (DMD). MRS of muscle tissue in DMD measures progressive lipid accumulation and 1H2O T2 changes.4Methods
VL MR spectra were acquired using a Siemens 3T
MRI instrument from healthy controls and DMD subjects.3 A STEAM
sequence was used to localize a volume in the VL muscle and
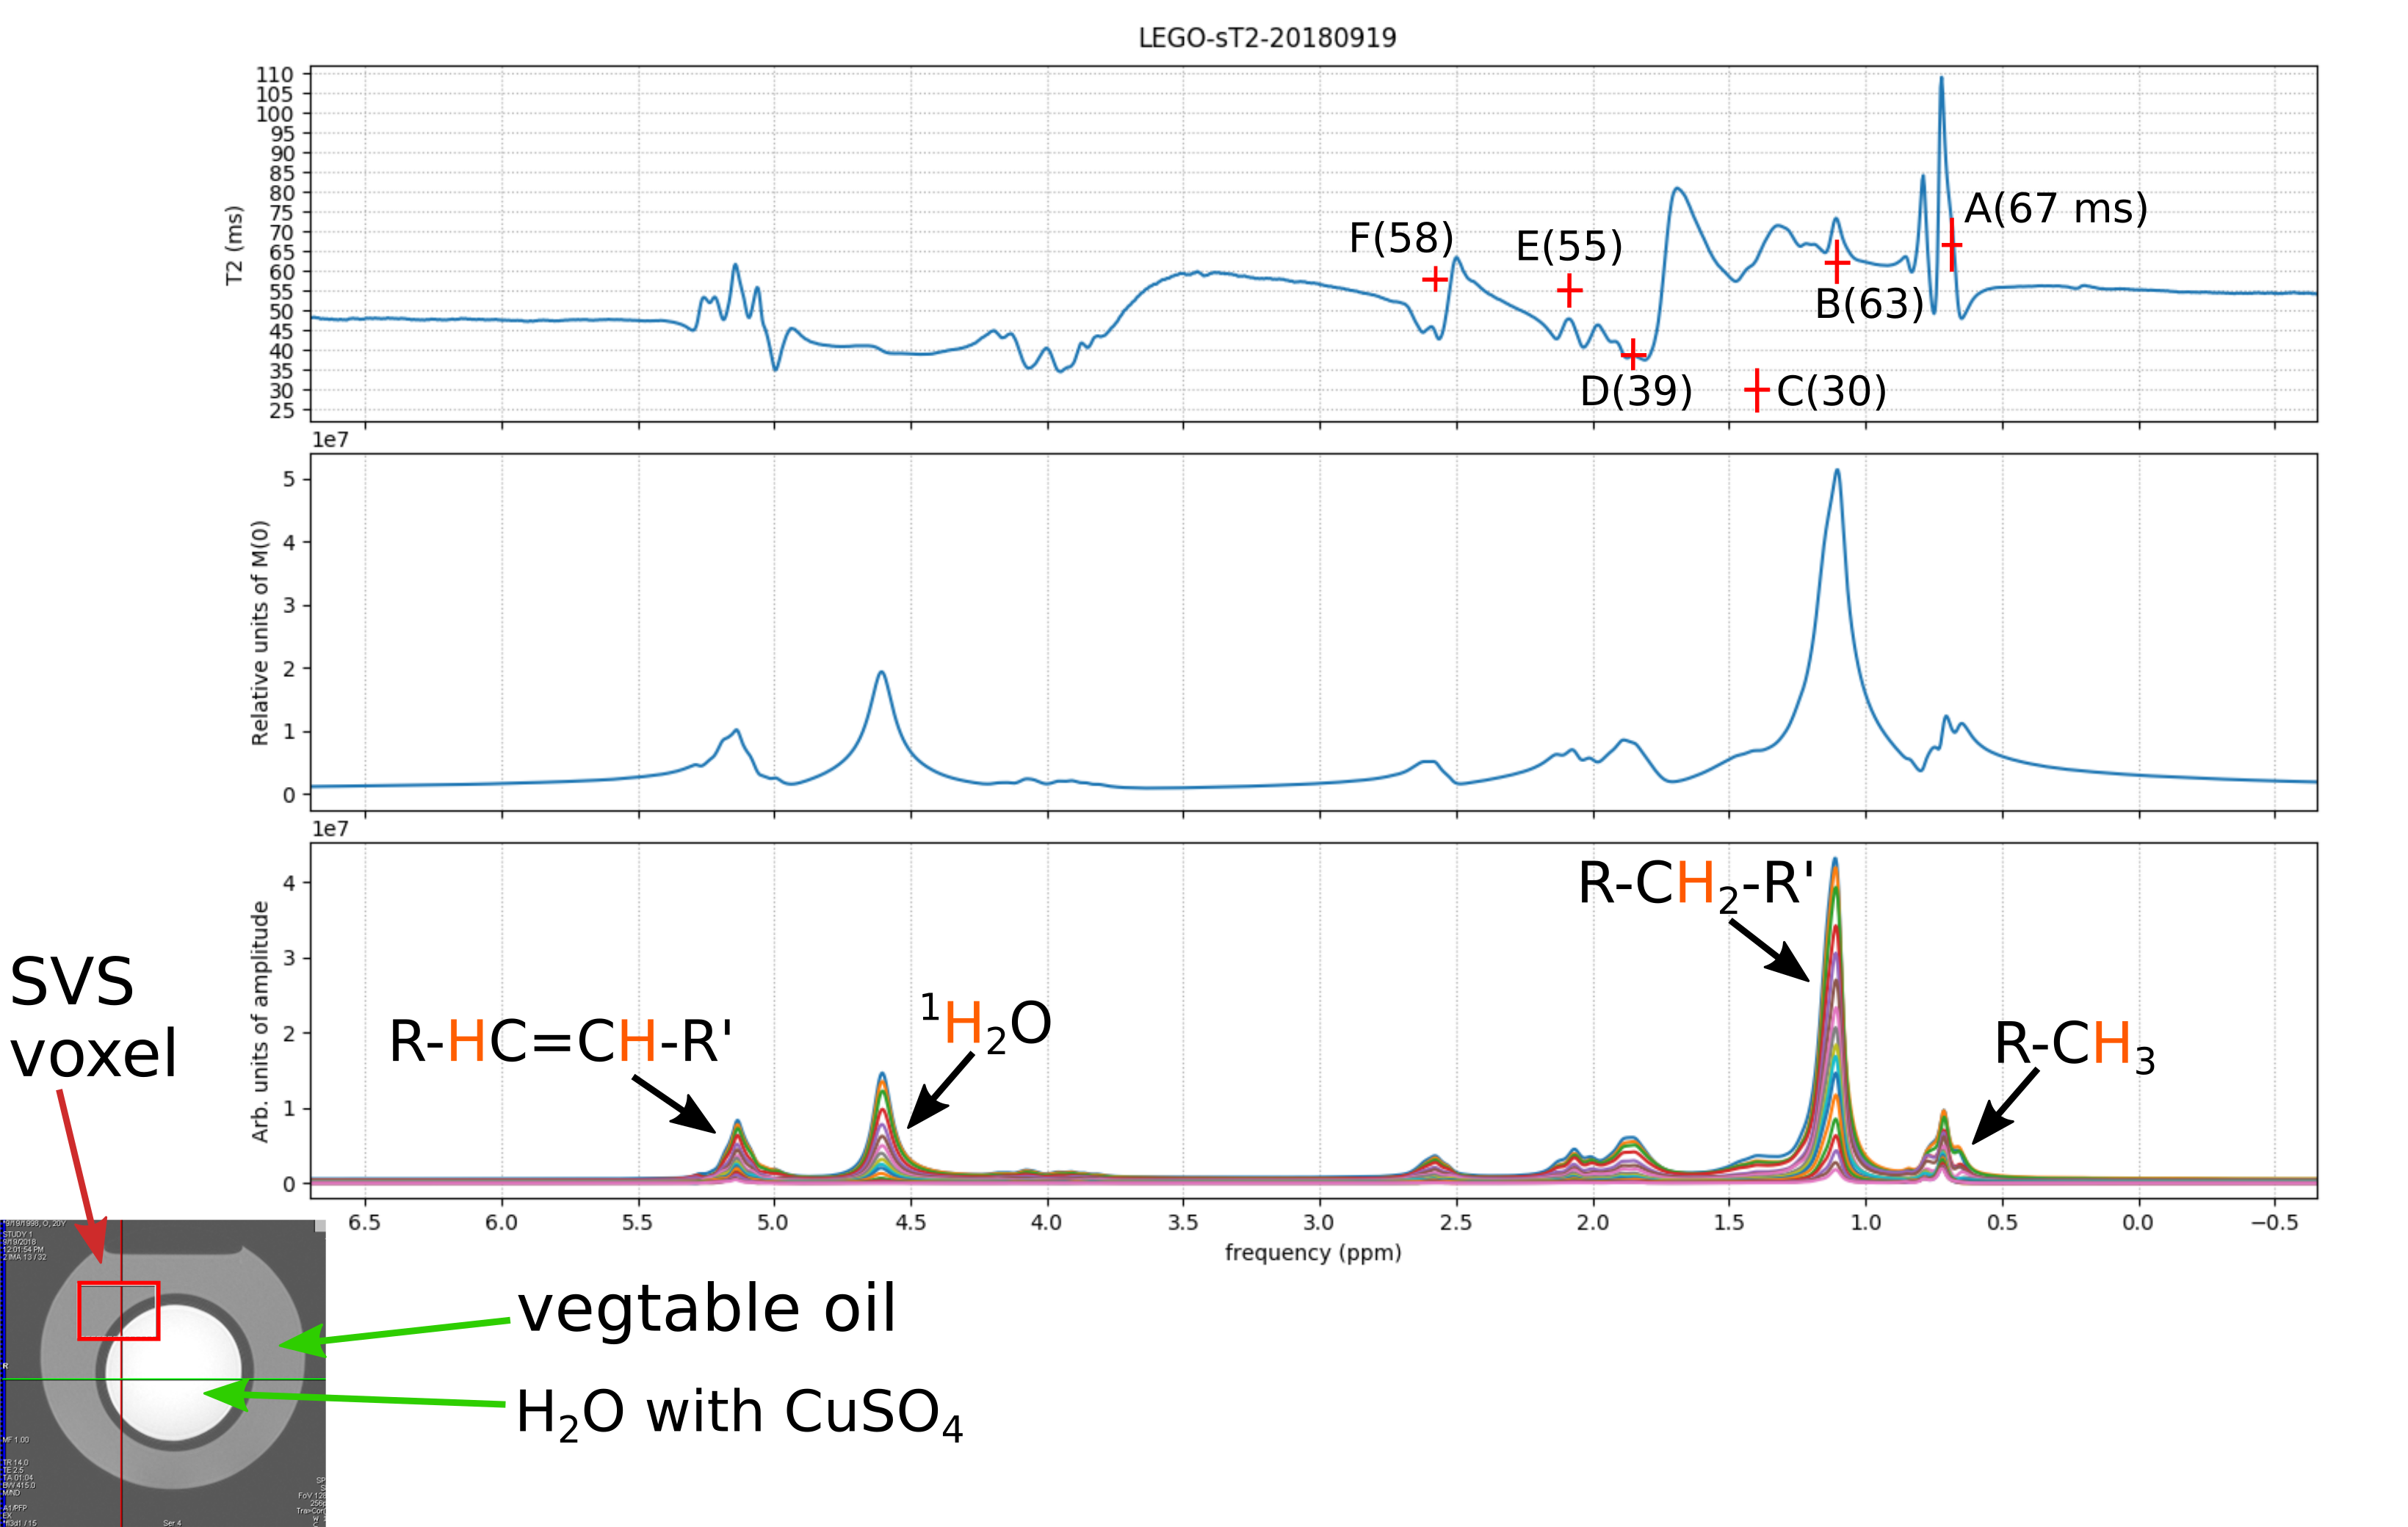
obtain half-echo FIDs at multiple TEs (11, 27, 54 and 243 ms) with a TR of 9000ms. TE-modulated spectra from an oil and water coaxial cylindrical phantom were also acquired with 16 TEs (11 - 288 ms).
Post-processing of MRS DICOM files was conducted
with Python code. Functions employed include those in Numpy, Scipy, Matplotlib, pydicom, and NMR Glue.
Automated peak-alignment was implemented. Spectral post-processing methods
tested include apodization, manual and automated phasing, baseline correction,
and zero-filling.
Results
Spectral pointwise T2 fitting was robust and
reproducible, including at the tails of the spectral window where there is
little obvious signal. The T2 of the dominant spectral component,
often 1H2O, determined the mean T2 values at the edges of the spectrum and indicate the broad extent of signal contribution.
Variance of the T2 fit increases with spectral offset from the signal maximas.
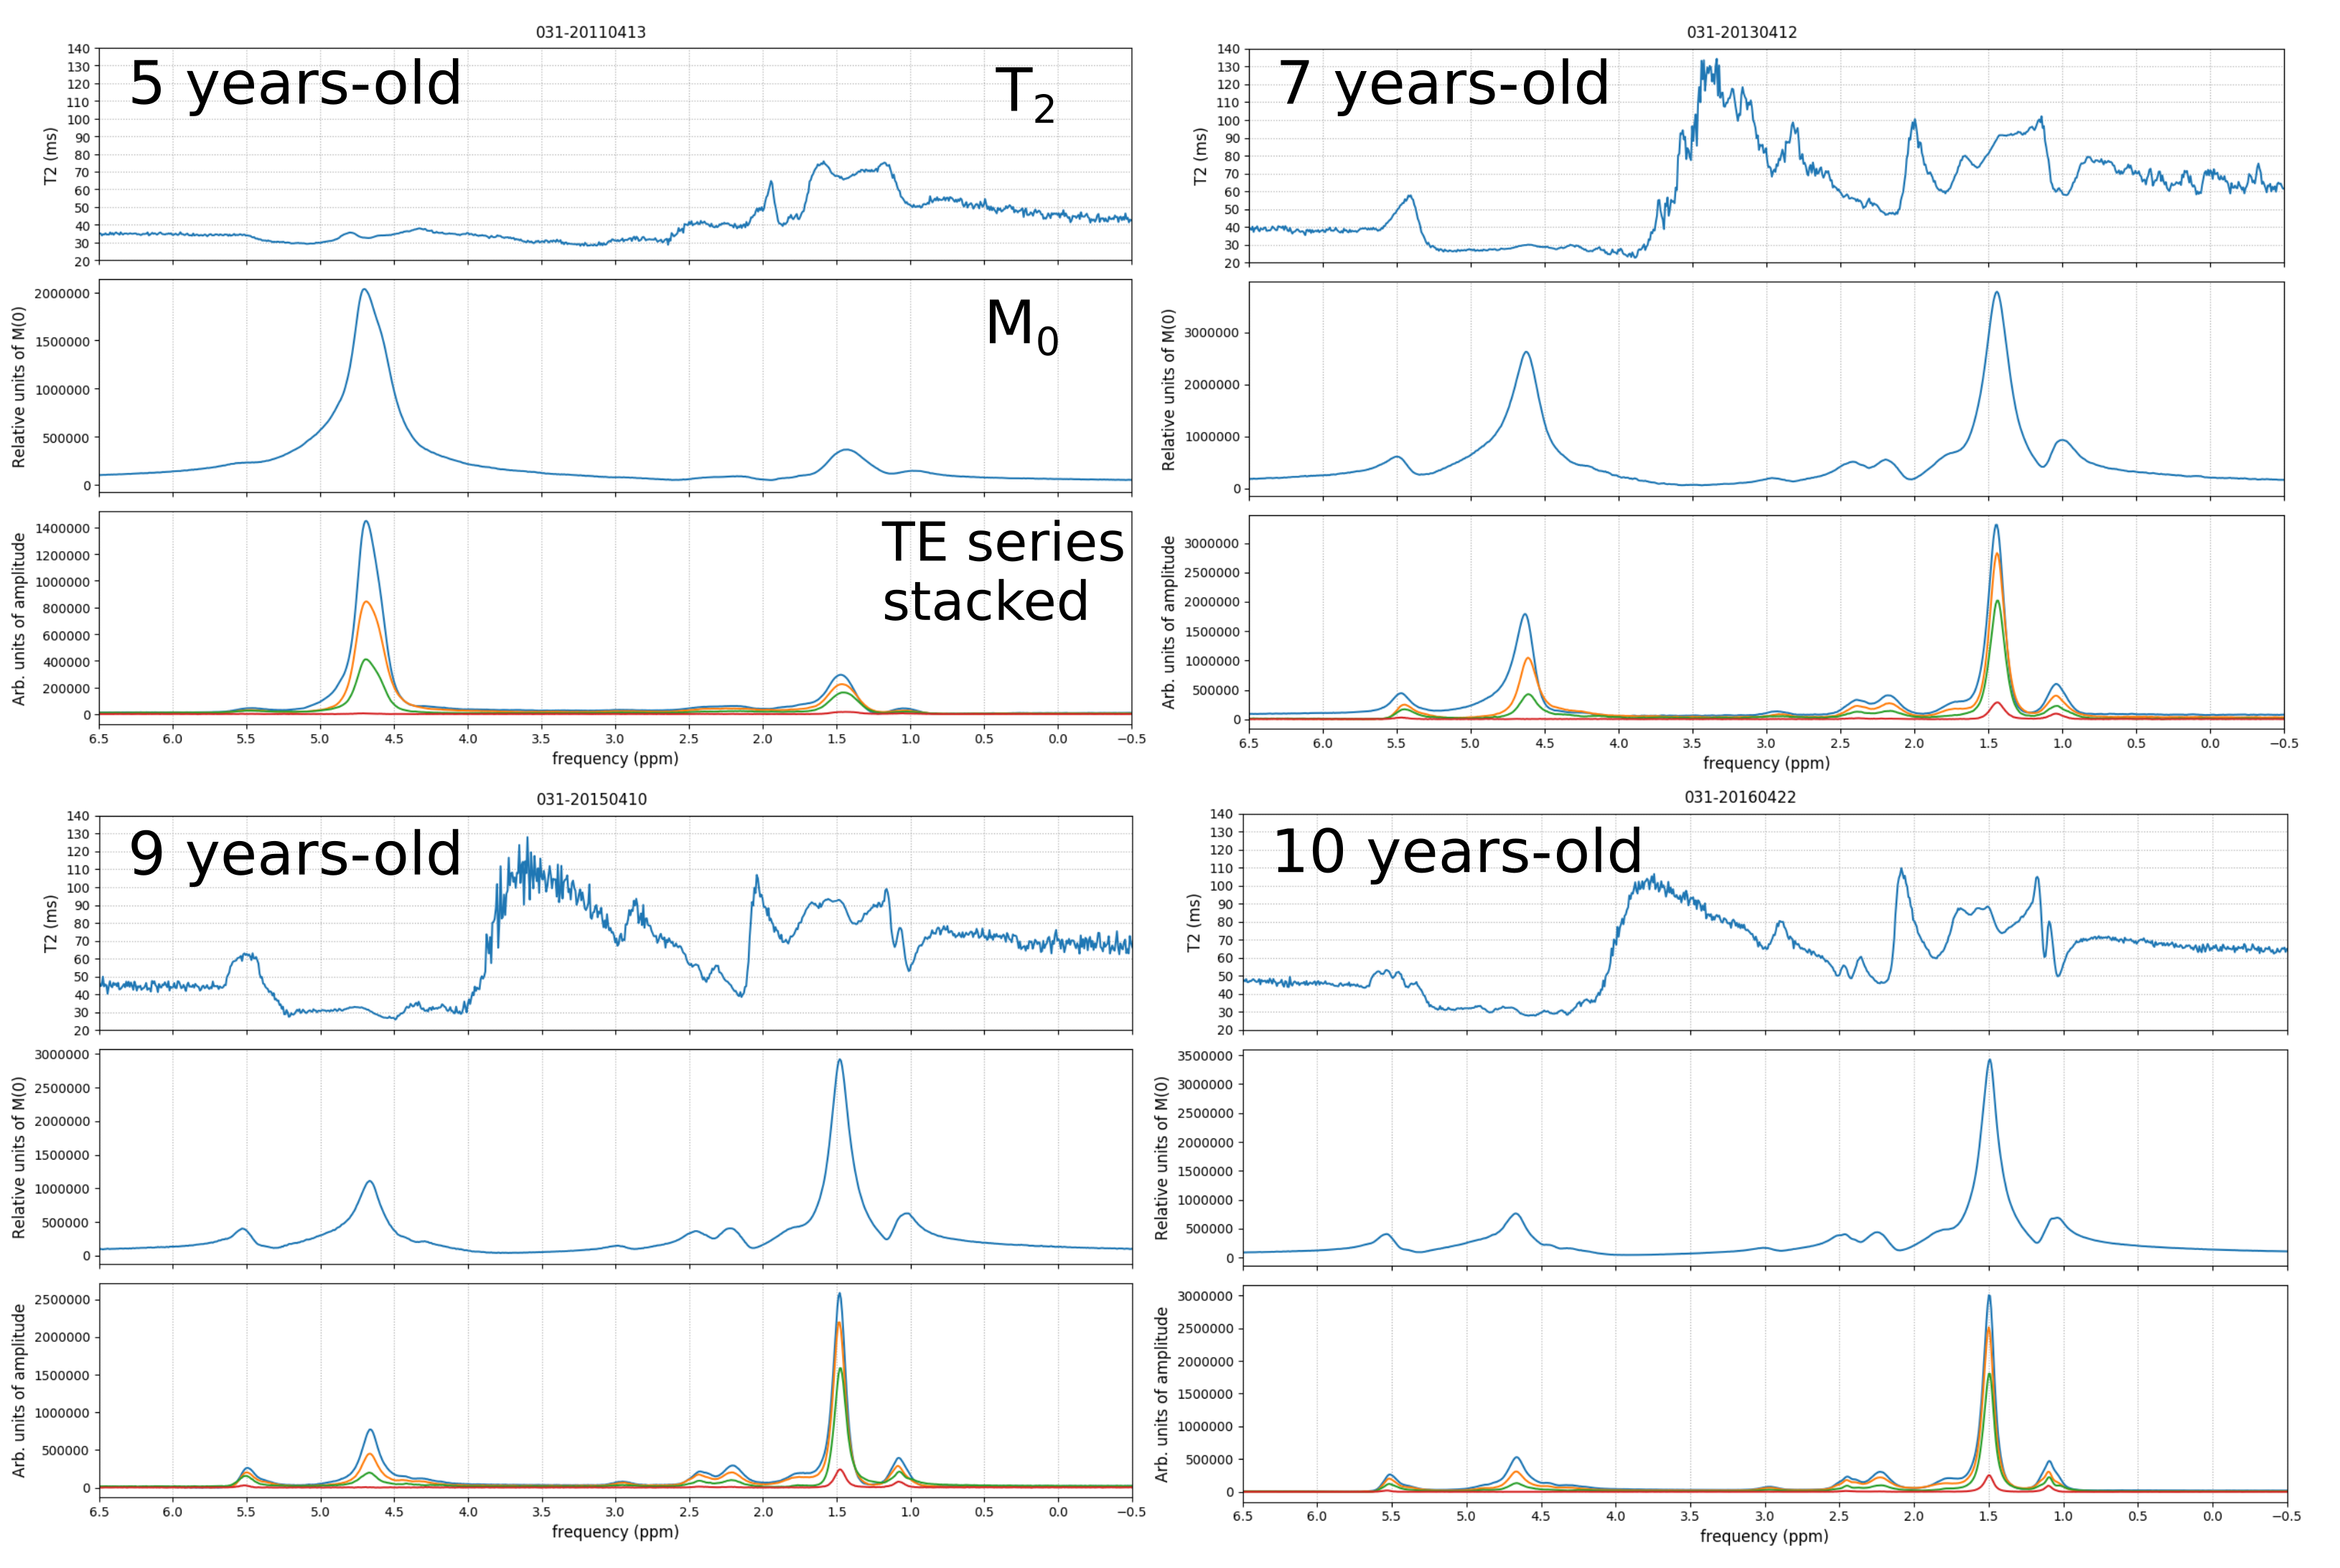
VL 1H2O (4.7ppm) T2 values were found to occur in the narrow range of 26 - 39ms, with DMD afflicted muscle showing a greater range that tended to decrease with disease progression (Figure 3). The lipid methyl resonance at 0.9 ppm had a T2 range of 55 - 90ms, and generally lower T2 than the methylene signals at 1.4 and 1.7 ppm. Creatine and trimethylamines are not well resolved but may contribute to the spectral T2 peaks at 3.0ppm and 3.2ppm. In the higher fat-fraction VL spectra, a large and broad T2 feature appears at 3.5ppm to 4.0ppm and warrants future investigation.
Analysis of the oil and water phantom spectra shows highly similar T2 values for 6 lipid resonances previously studied (Figure 4).2
Discussion
The ability to visualize a T2 spectrum aids in interpretation of complex signal behavior, and identification of overlapping signals. One motivation for pointwise T2
fitting was to better understand the spectral heterogeneity of 1H2O
T2 in DMD, especially later in the disease when lipid is the
dominant signal. At high lipid fractions, the apparent water T2
in muscle often decreases, and the contribution from the proximal lipid resonances does not appear to be the cause. The spectral T2 provides a unique fingerprint that conveys additional information on muscle pathology.
Future directions include a rigorous assessment
of the relative benefits of fitting on real or magnitude spectra. The TE sampling scheme will be investigated as it may play a role in some of the spectral T2 features. Additionally,
inversion recovery SVS acquisition can be used to generate a spectral T1. A bi-exponential decay model may yield additional information and help to distinguish otherwise hidden spin populations. More work is required to link specific T2 features to normal and pathological biology.
These derived spectral relaxation plots may lead to unprecedented richness in relaxation analysis. This approach can readily be applied to other tissues in vivo, NMR spectroscopy in vitro, and coherent spectroscopy in general.
Acknowledgements
This work was funded in part by:
NIH NIAMS/NINDS R01AR056973
NIH OD S10OD018224-01
NIH OD S10OD021701
We would like to thank Manoj Sammi, Rob Mueller, and Thomas Barbara for helpful discussions.
References
1. Mosconi E, Sima D M, Osorio Garcia M. I, Fontanella M, Fiorini S, Van Huffel S, and Marzola, P. Different quantification algorithms may lead to different results: a comparison using proton MRS lipid signals. NMR Biomed., 2014; 27: 431-443. doi:10.1002/nbm.3079
2. Ren J, Dimitrov I, Sherry D, and Mallow C. Composition of adipose tissue and marrow fat in humans by 1H NMR at 7 Tesla, 2008; Journal of Lipid Research, 49: 2055-262
3. Forbes S C, et al. Magnetic resonance imaging and spectroscopy assessment of lower extremity skeletal muscles in boys with Duchenne muscular dystrophy: a multicenter cross sectional study." PloS one 9.9, 2014; e106435.
4. Arpan, I., Willcocks, R. J., Forbes, S. C., Finkel, R. S., Lott, D. J., Rooney, W. D., ... & Finanger, E. L., Examination of effects of corticosteroids on skeletal muscles of boys with DMD using MRI and MRS. Neurology, 2014; 83(11), 974-980.
5. Rooney, William, et al. "Soleus muscle water T2 values in Duchenne
muscular dystrophy: associations with age and corticosteroid treatment."
Proceedings of the 21st ISMRM Scientific Meeting, Salt Lake City, UT, USA. Vol. 689. 2013.
Figures