4245
The use of multi-vendor, multi-site 1H-MRS data acquired at 26 sites as a benchmark for MRS standardization: Comparison of quantification software1Russell H. Morgan Department of Radiology and Radiological Science, The Johns Hopkins University, School of Medicine, Baltimore, MD, United States, 2F. M. Kirby Research Center for Functional Brain Imaging, Kennedy Krieger Institute, Baltimore, MD, United States, 3Imaging Institute, Cleveland Clinic Foundation, Cleveland, OH, United States, 4Radiology, Cleveland Clinic Lerner College of Medicine of Case Western Reserve University, Cleveland, OH, United States, 5Department of Radiology, Haukeland University Hospital, Bergen, Norway, 6Spinoza Centre for Neuroimaging, Amsterdam, Netherlands, 7Department of Radiology, Cincinnati Children’s Hospital Medical Center, University of Cincinnati College of Medicine, Cincinnati, OH, United States, 8Department of Radiology, Taipei Medical University Shuang Ho Hospital, New Taipei City, Taiwan, 9Department of Biological and Medical Psychology, University of Bergen, Bergen, Norway, 10NORMENT – Norwegian Center for Mental Disorders Research, University of Bergen, Bergen, Norway, 11Department of Kinesiology, KU Leuven, Leuven, Belgium, 12REVAL Rehabilitation Research Center, Hasselt University, Leuven, Belgium, 13Department of Radiology, Medical Physics, Medical Center - University of Freiburg, Faculty of Medicine, Freiburg, Germany, 14Brain and Consciousness Research Centre, Taipei Medical University, Taipei, Taiwan, 15School of Health Sciences, Purdue University, West Lafayette, IN, United States, 16Department of Radiology and Imaging Sciences, Indiana University School of Medicine, Indianapolis, IN, United States, 17Department of Neuroimaging, Central Institute of Mental Health, Mannheim, Germany, 18Shandong Medical Imaging Research Institute, Shandong University, Jinan, China, 19Helen Wills Neuroscience Institute, University of California, Berkeley, berkeley, CA, United States, 20Department of Radiology, University of Calgary, Calgary, AB, Canada, 21Department of Radiology, Ruijin Hospital, Shanghai Jiao Tong University, School of Medicine, Shanghai, China, 22Department of Neurology, BG University Hospital Bergmannsheil, Bochum, Germany, 23Academic Unit of Radiology, University of Sheffield, Sheffield, United Kingdom, 24Department of Radiology, Taipei Veterans General Hospital, National Yang-Ming University, School of Medicine, Taipei, Taiwan, 25Department of Radiology, Maastricht University Medical Center, Maastricht, Netherlands, 26Department of Psychiatry, Columbia University, New York, NY, United States, 27New York State Psychiatric Institute, New York, NY, United States, 28GE Healthcare, Calgary, AB, Canada, 29GE Healthcare, Taipei, Taiwan, 30Department of Biochemistry and Molecular Biology, University of Florida, Gainesville, FL, United States, 31National High Magnetic Field Laboratory, Gainesville, FL, United States, 32Center for Magnetic Resonance Research, Department of Radiology, University of Minnesota, Minneapolis, MN, United States, 33Department of Psychiatry, Columbia University, new york, NY, United States, 34Department of Psychology, University of Washington, Seattle, WA, United States, 35Helen Wills Neuroscience Institute, University of California, Berkeley, Berkeley, CA, United States, 36GE Healthcare, Berlin, Germany, 37Department of Electrical and Computer Engineering, McMaster University, Hamilton, ON, Canada, 38Department of Clinical and Health Psychology, University of Florida, Gainesville, FL, United States, 39Center For Cognitive Aging and Memory, McKnight Brain Institute, University of Florida, Gainesville, FL, United States, 40Department of Psychiatry and Behavioral Sciences, Medical University of South Carolina, Charleston, SC, United States, 41Department of Radiology, Children’s Hospital of Philadelphia, Philadelphia, PA, United States, 42Research Imaging Centre, Centre for Addiction and Mental Health, Toronto, ON, Canada, 43Department of Psychiatry, University of Toronto, Toronto, ON, Canada, 44Department of Psychiatry and Behavioral Sciences, University of Minnesota, Minneapolis, MN, United States, 45School of Biomedical Engineering, McMaster University, Hamilton, ON, Canada, 46Leuven Research Institute for Neuroscience & Disease (LIND), KU Leuven, Leuven, Belgium, 47Department of Diagnostic and Interventional Radiology, Medical Faculty, Heinrich-Heine-University, Duesseldorf, Germany, 48Department of Functional Neurosurgery, Ruijin Hospital, Shanghai Jiao Tong University School of Medicine, Shanghai, China, 49Department of Biostatistics, Johns Hopkins Bloomberg School of Public Health, Baltimore, MD, United States, 50Institute of Clinical Neuroscience and Medical Psychology, Medical Faculty, Heinrich-Heine-University, Duesseldorf, Germany
Synopsis
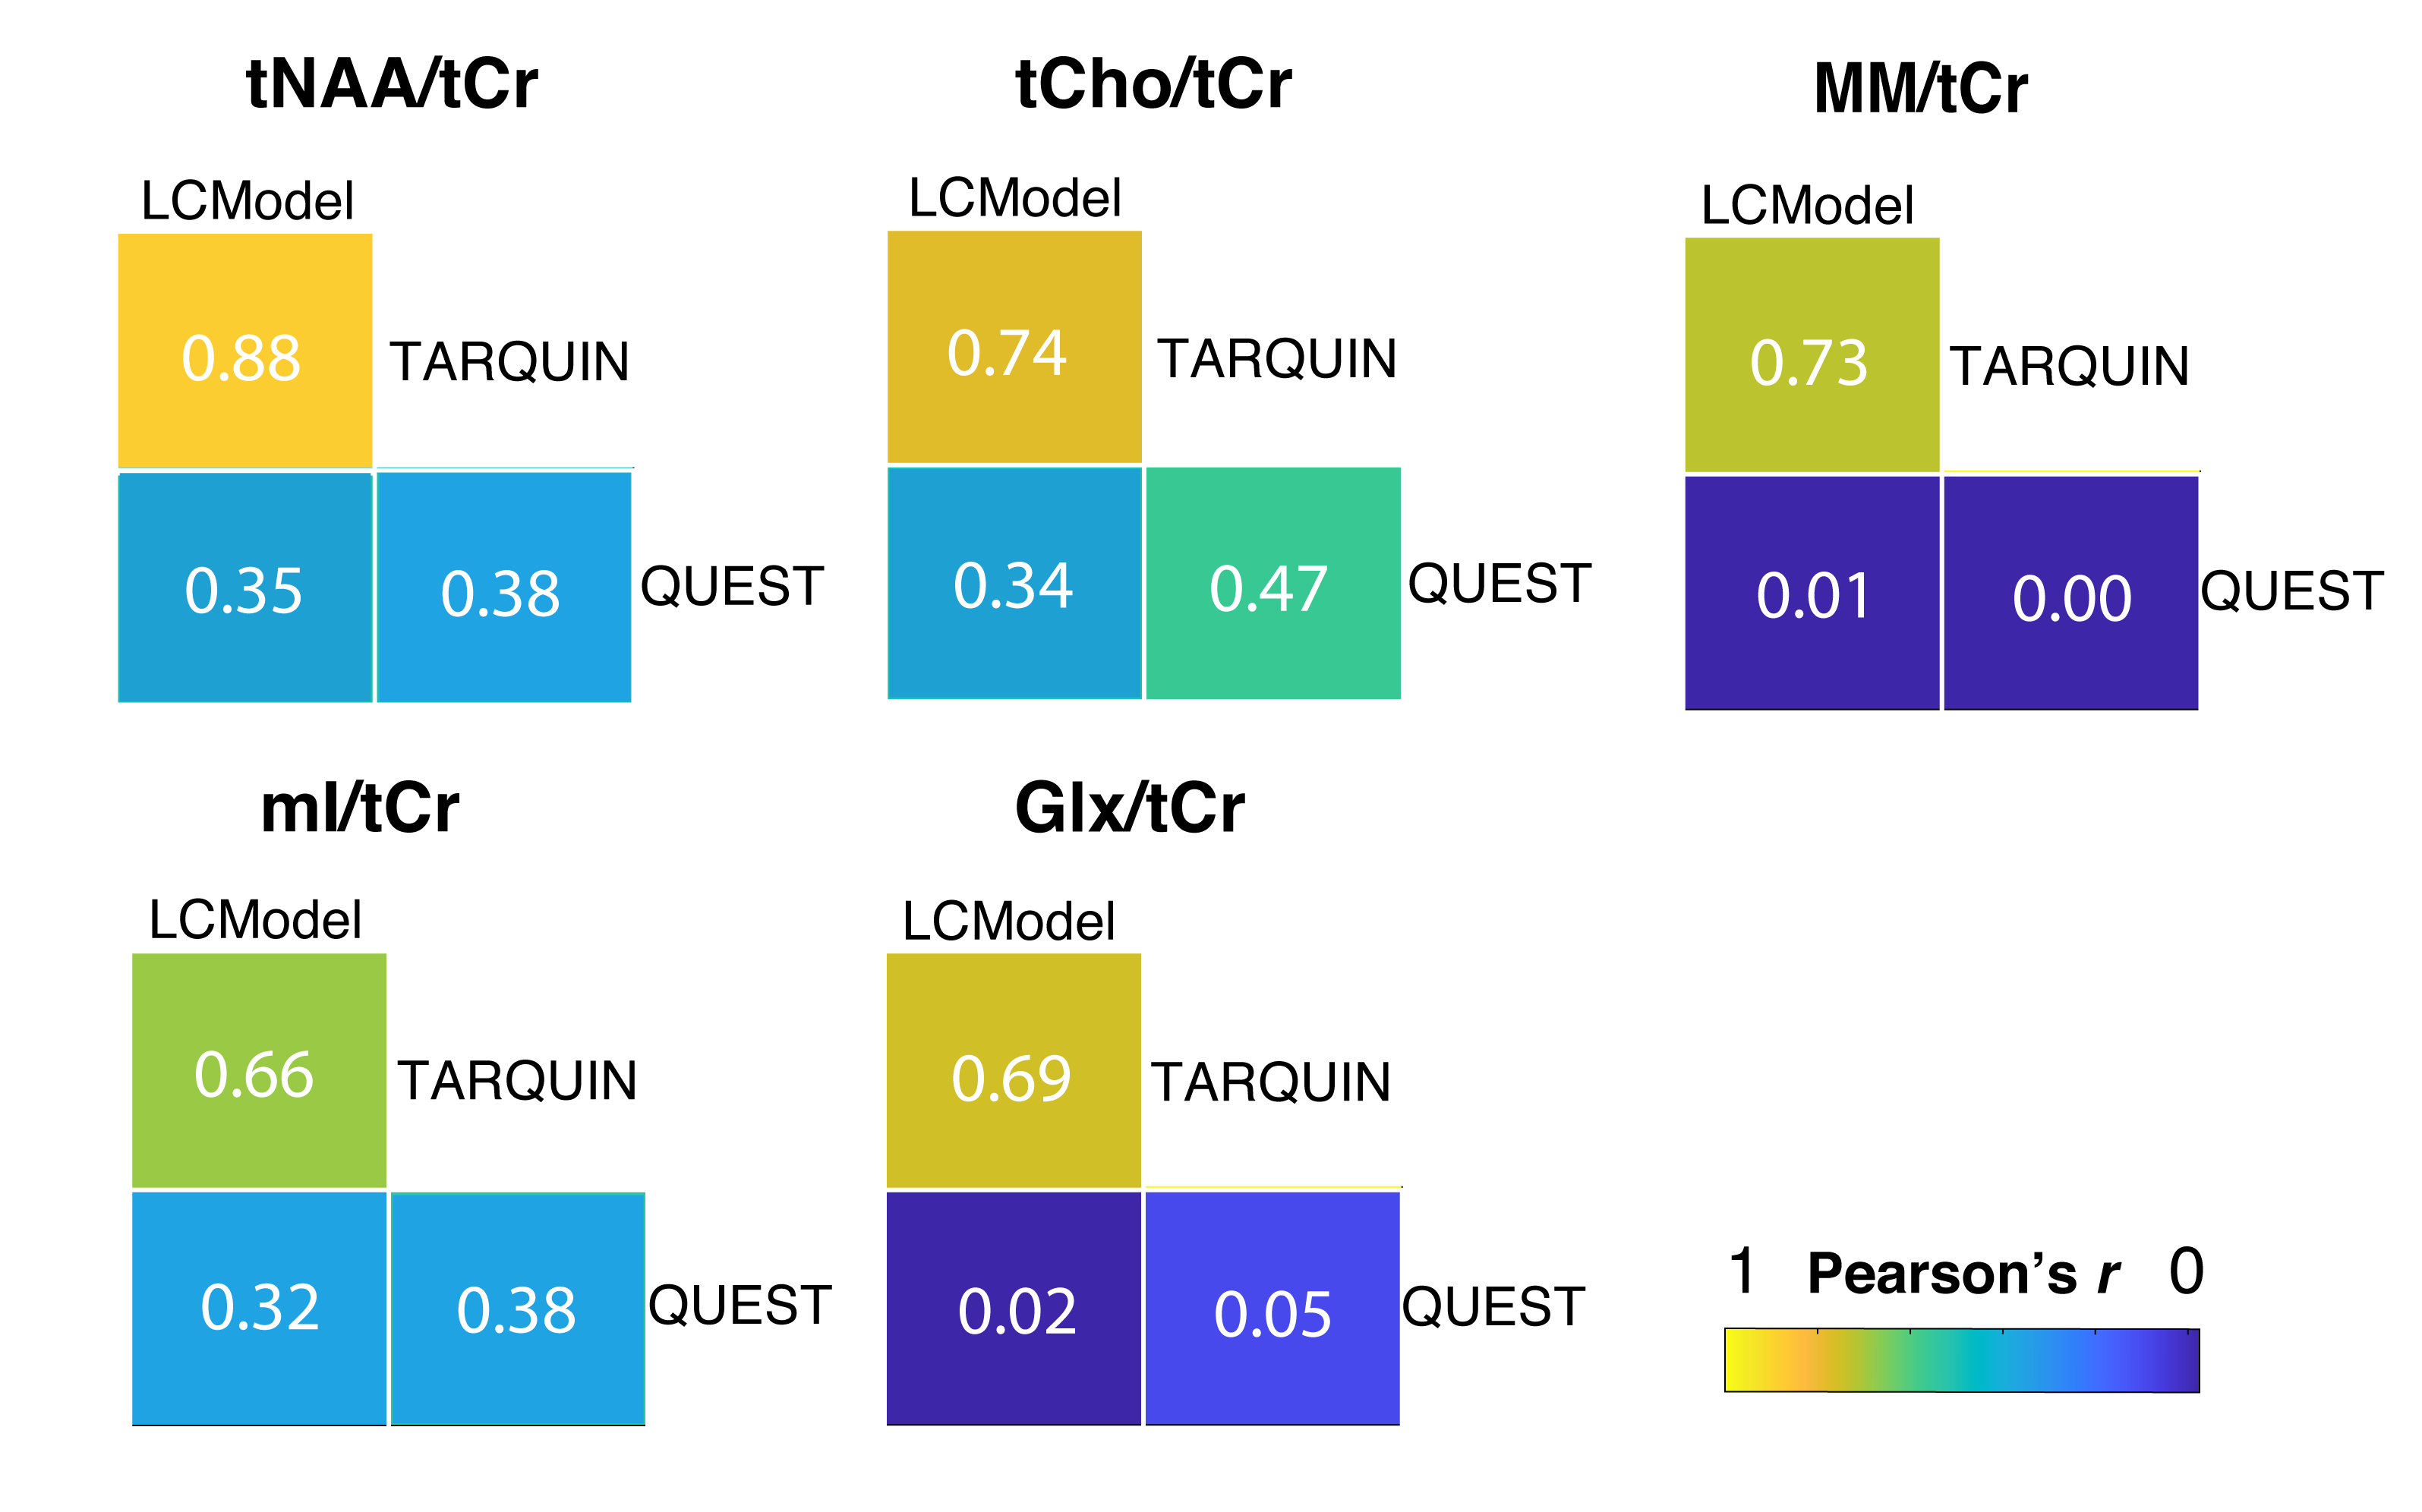
In vivo 1H-MRS is useful for studying neurological pathology, however its integration into clinical routine remains incomplete. Quantification of 1H-MRS data is affected by the analysis pipeline, but the source and extent of this bias is often unknown. Therefore, a large multi-vendor, multi-site dataset (n=296) was processed with an automated pipeline and three quantification software packages: LCModel, TARQUIN, and QUEST. Pearson’s correlation coefficient ranged from 0.66-0.88 for LCModel vs. TARQUIN and from 0.02-0.47 for QUEST vs. LCModel and QUEST vs. TARQUIN. A different baseline handling was the major potential source of variation between quantification software.
Introduction
In vivo 1H-MRS has proven to be beneficial in the study of many pathologies, however its integration into clinical routine is incomplete. A major drawback of 1H-MRS is the lack of standardization1. In addition, the agreement between quantitative results of different MRS quantification software packages is poor, even for the same dataset2,3. A big database of multi-vendor, multi-site spectra may, together with an automated processing pipeline, help to detect various sources of quantification bias. The purpose of this study was to compare the MRS quantification of multi-vendor, multi-site data acquired at 26 research sites using LCModel4, TARQUIN5 and QUEST6.Methods
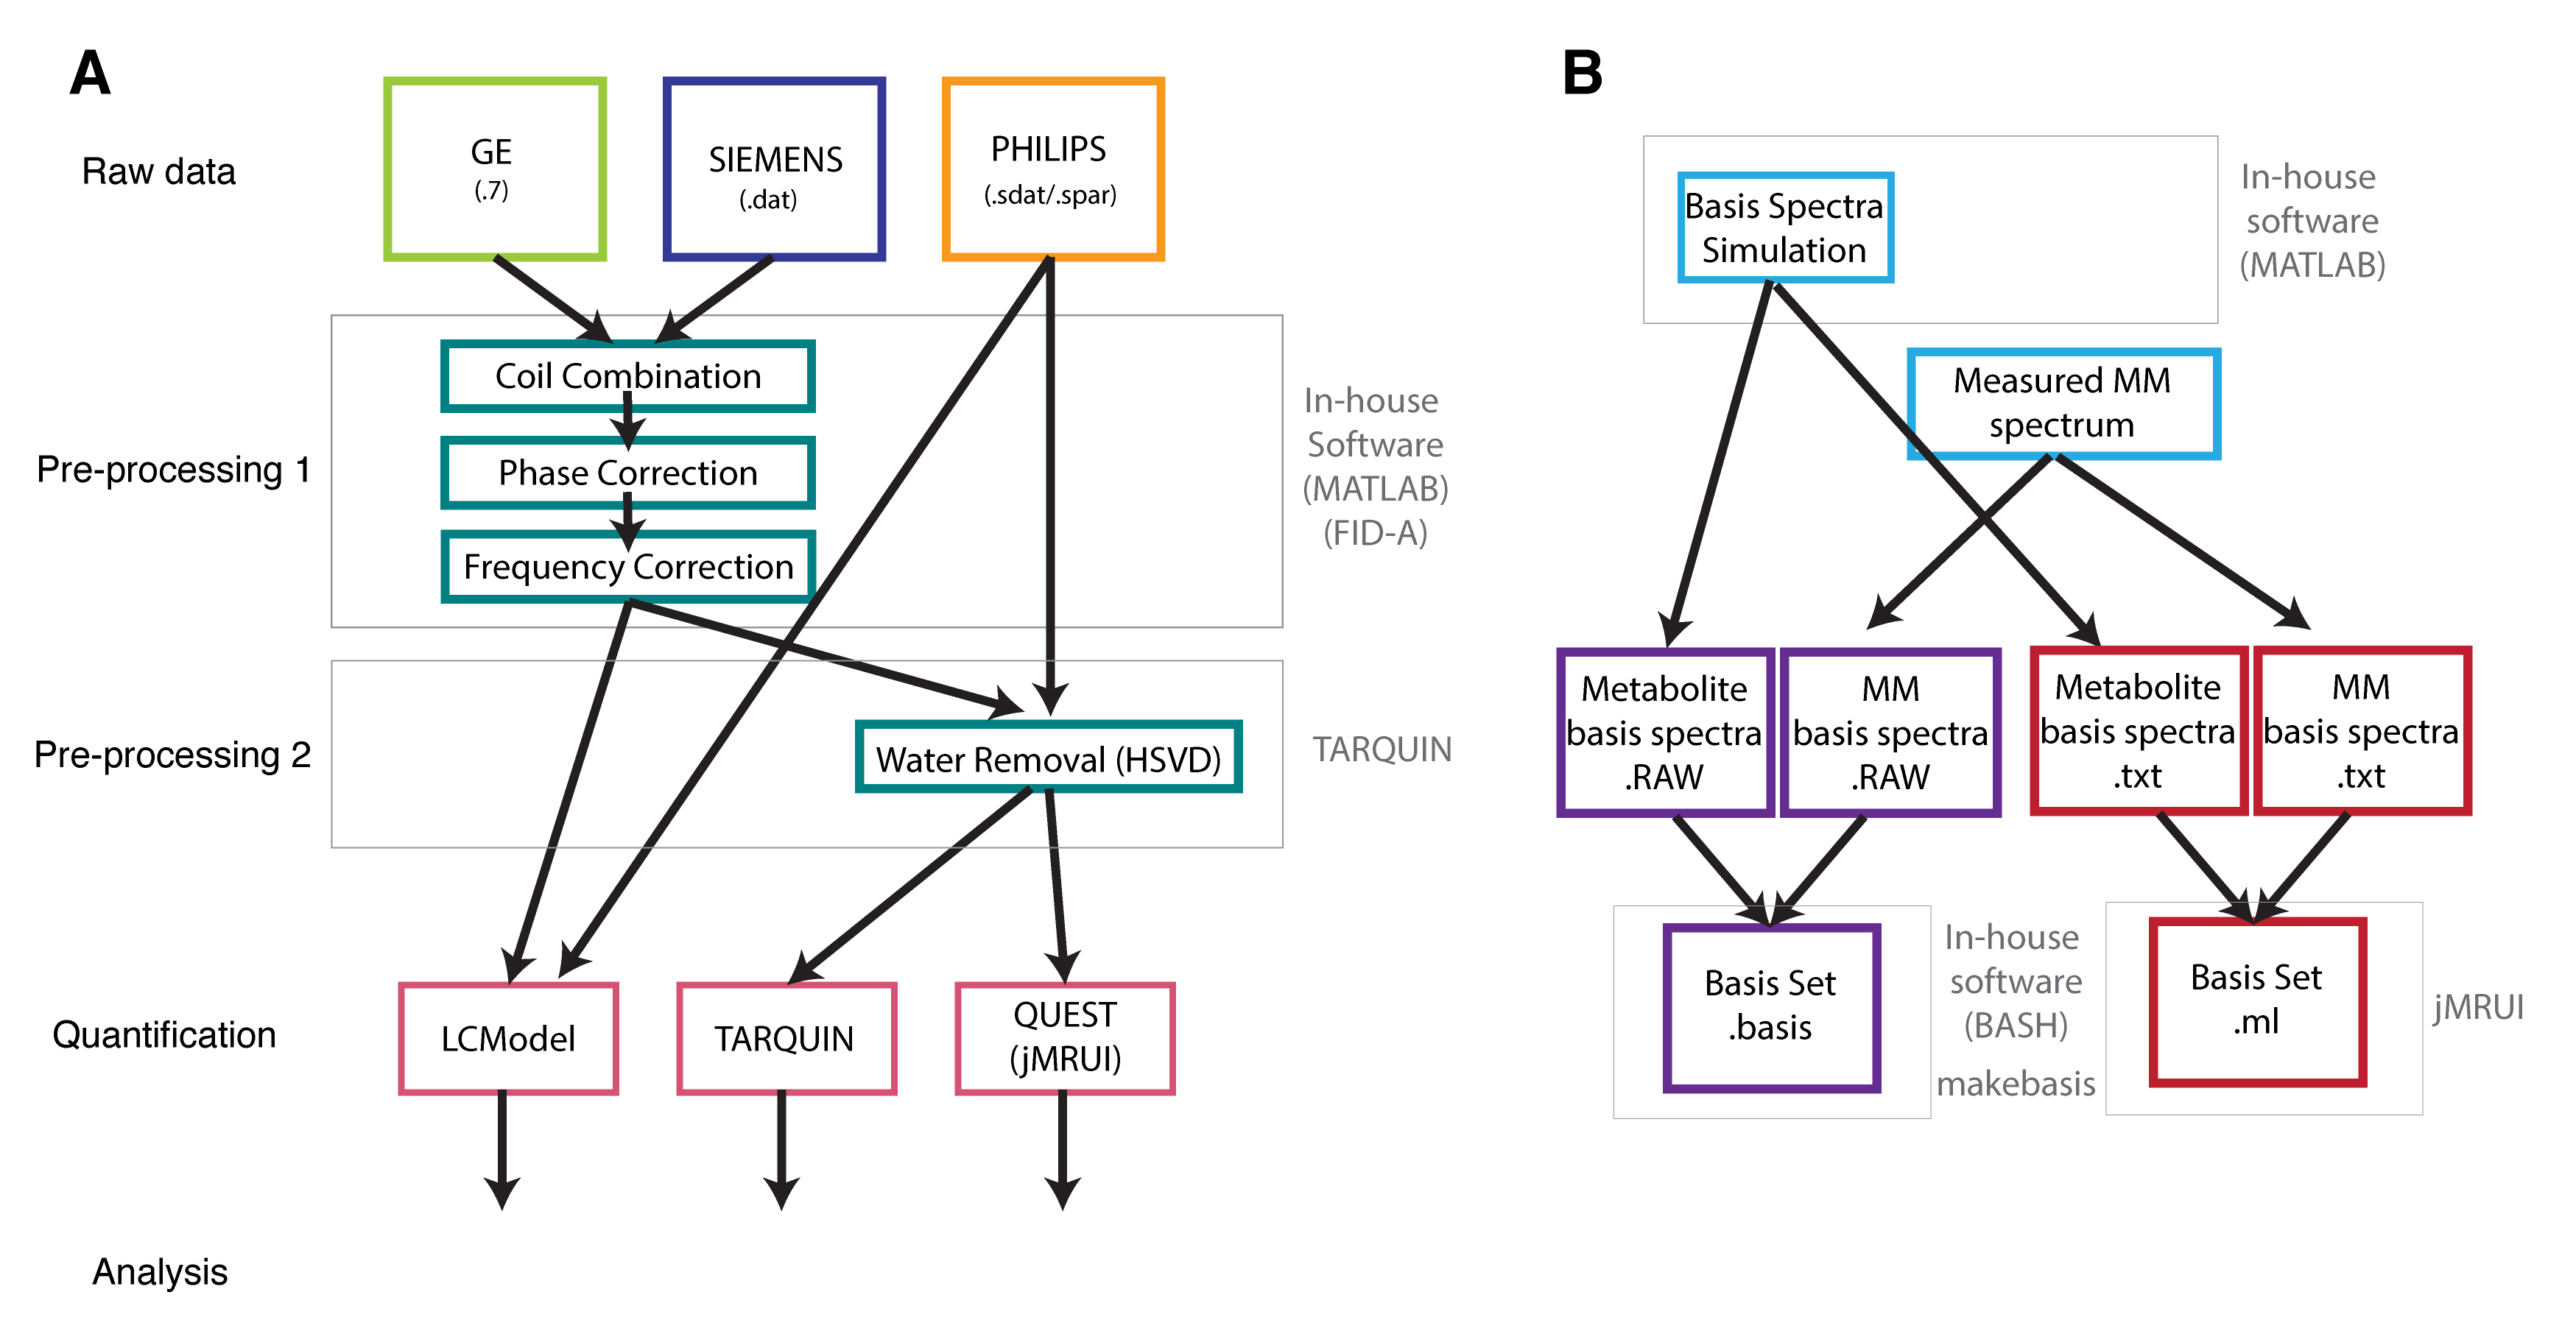
Data from 296 healthy subjects (155F/141M; mean age 26.43±4.58) were collected at 26 sites equipped with GE(8), Philips(10), and Siemens(8) 3T scanners7. Each site contributed 5-12 datasets. All datasets were measured using vendor-specific 1H-MRS PRESS8 sequence with: TE/TR = 35/2000 ms; 2048 or 4096 data points; 2,4 or 5 kHz spectral bandwidth; 64 total averages; 30x30x30 mm3 mid-parietal voxel. Water-unsuppressed spectra were acquired with the same parameters and 8 or 16 averages. Nine datasets were excluded due to lipid contamination. All datasets were pre-processed using an in-house developed automated software as described in Fig.1, and quantified from 0.5-4.0 ppm using LCModel 6.34, TARQUIN 4.3.115, and QUEST, as implemented in jMRUI 6.0-beta6. Basis sets consisted of 19 metabolites generated using fully localized 2D density matrix simulations with real refocusing pulse information9. A measured macromolecular spectrum was included in the basis sets. The number of points and bandwidth of basis spectra corresponded to the measured data; Five basis sets were used, two for GE, one for Philips and two for Siemens. Metabolite ratios of total NAA (tNAA), total choline (tCho), myo-inositol (mI) and glutamine+glutamate (Glx) relative to total creatine (tCr) were reported. Pearson’s correlation coefficients r and between-subject coefficients of variation (CV) were calculated in MATLAB. Vendor-, site-, and participant-related effects on the quantified metabolites were determined using a 3-level linear mixed-effects model10. The significance of these effects was determined using chi-square likelihood ratio tests.Results
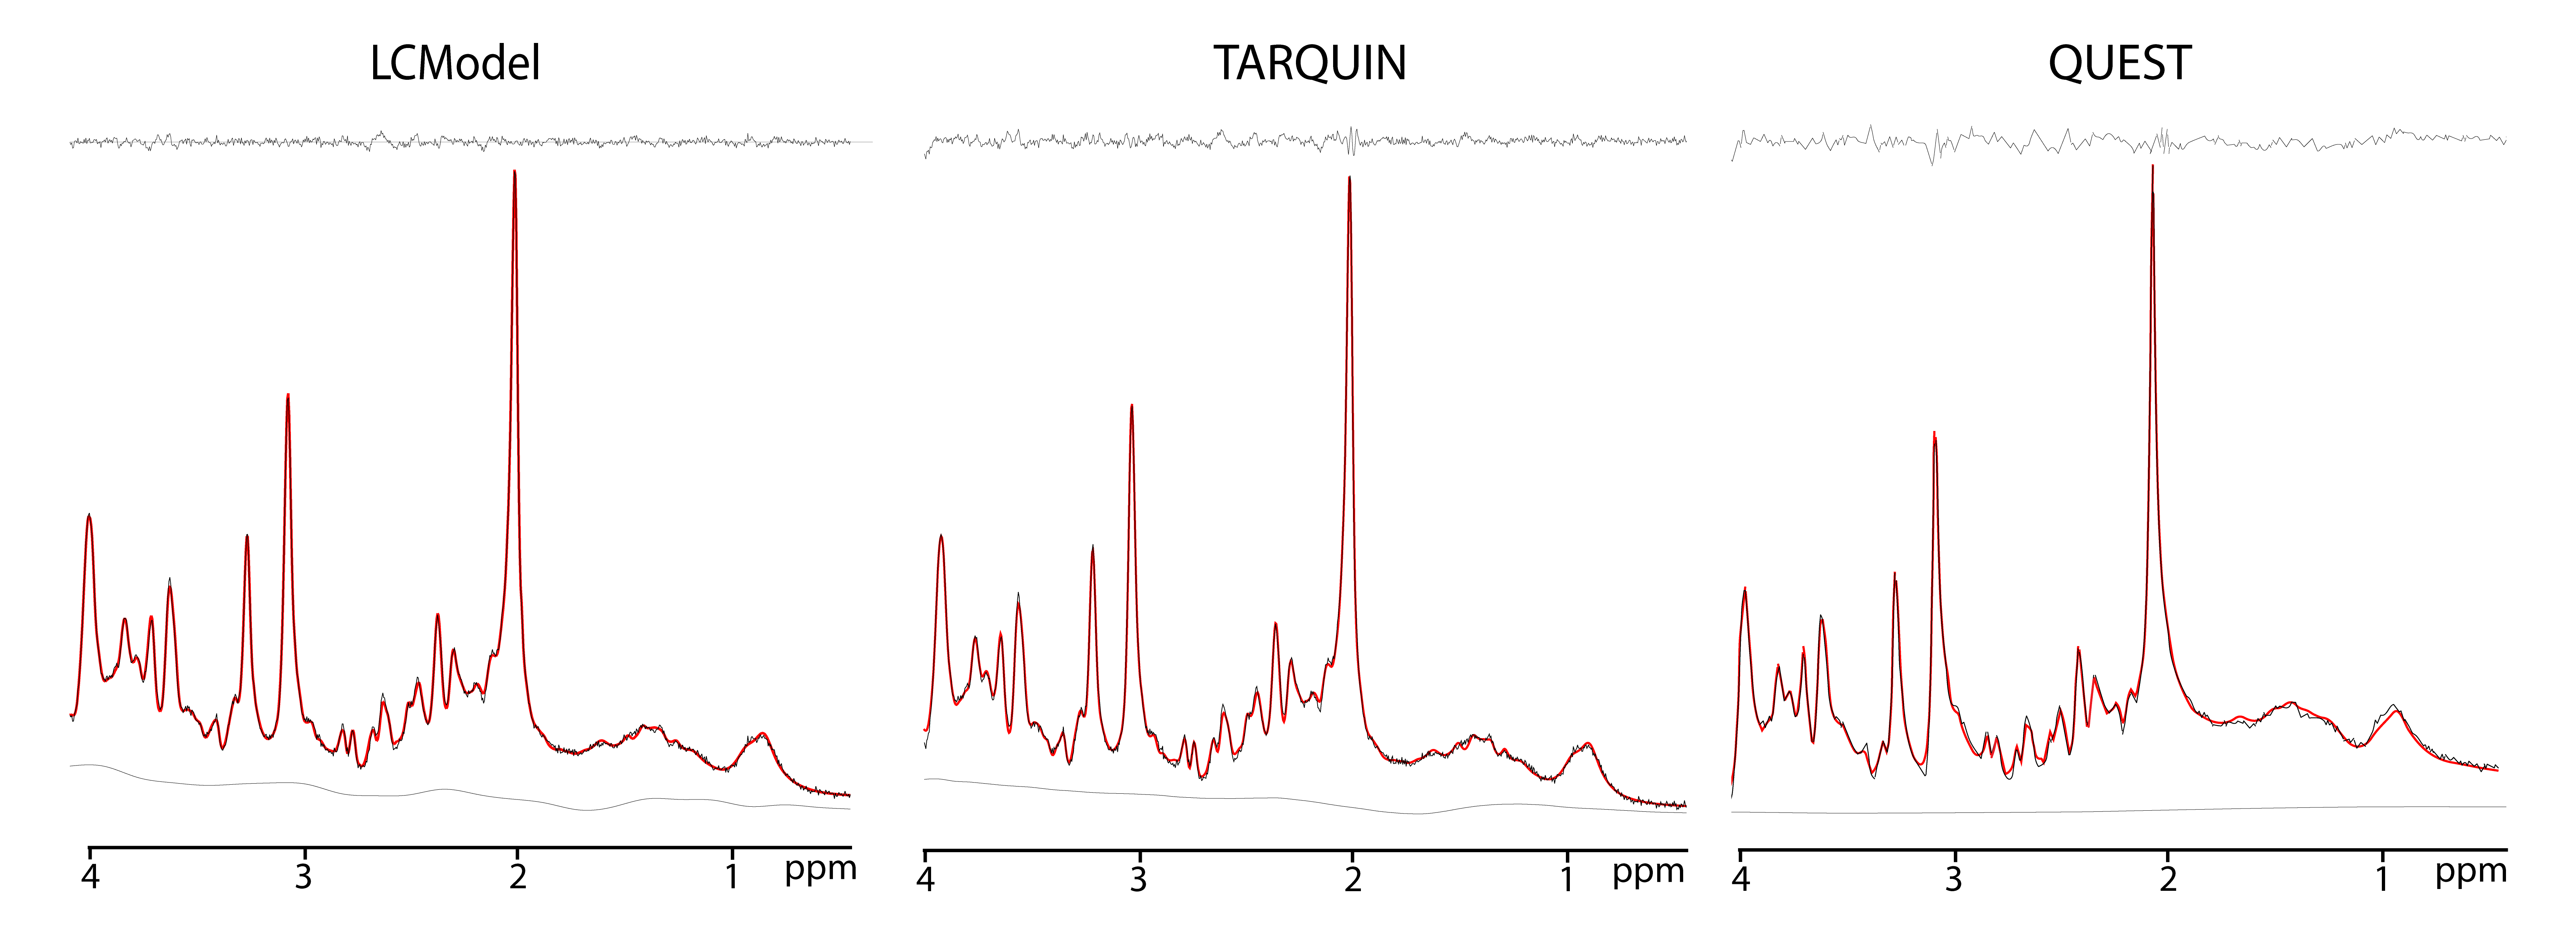
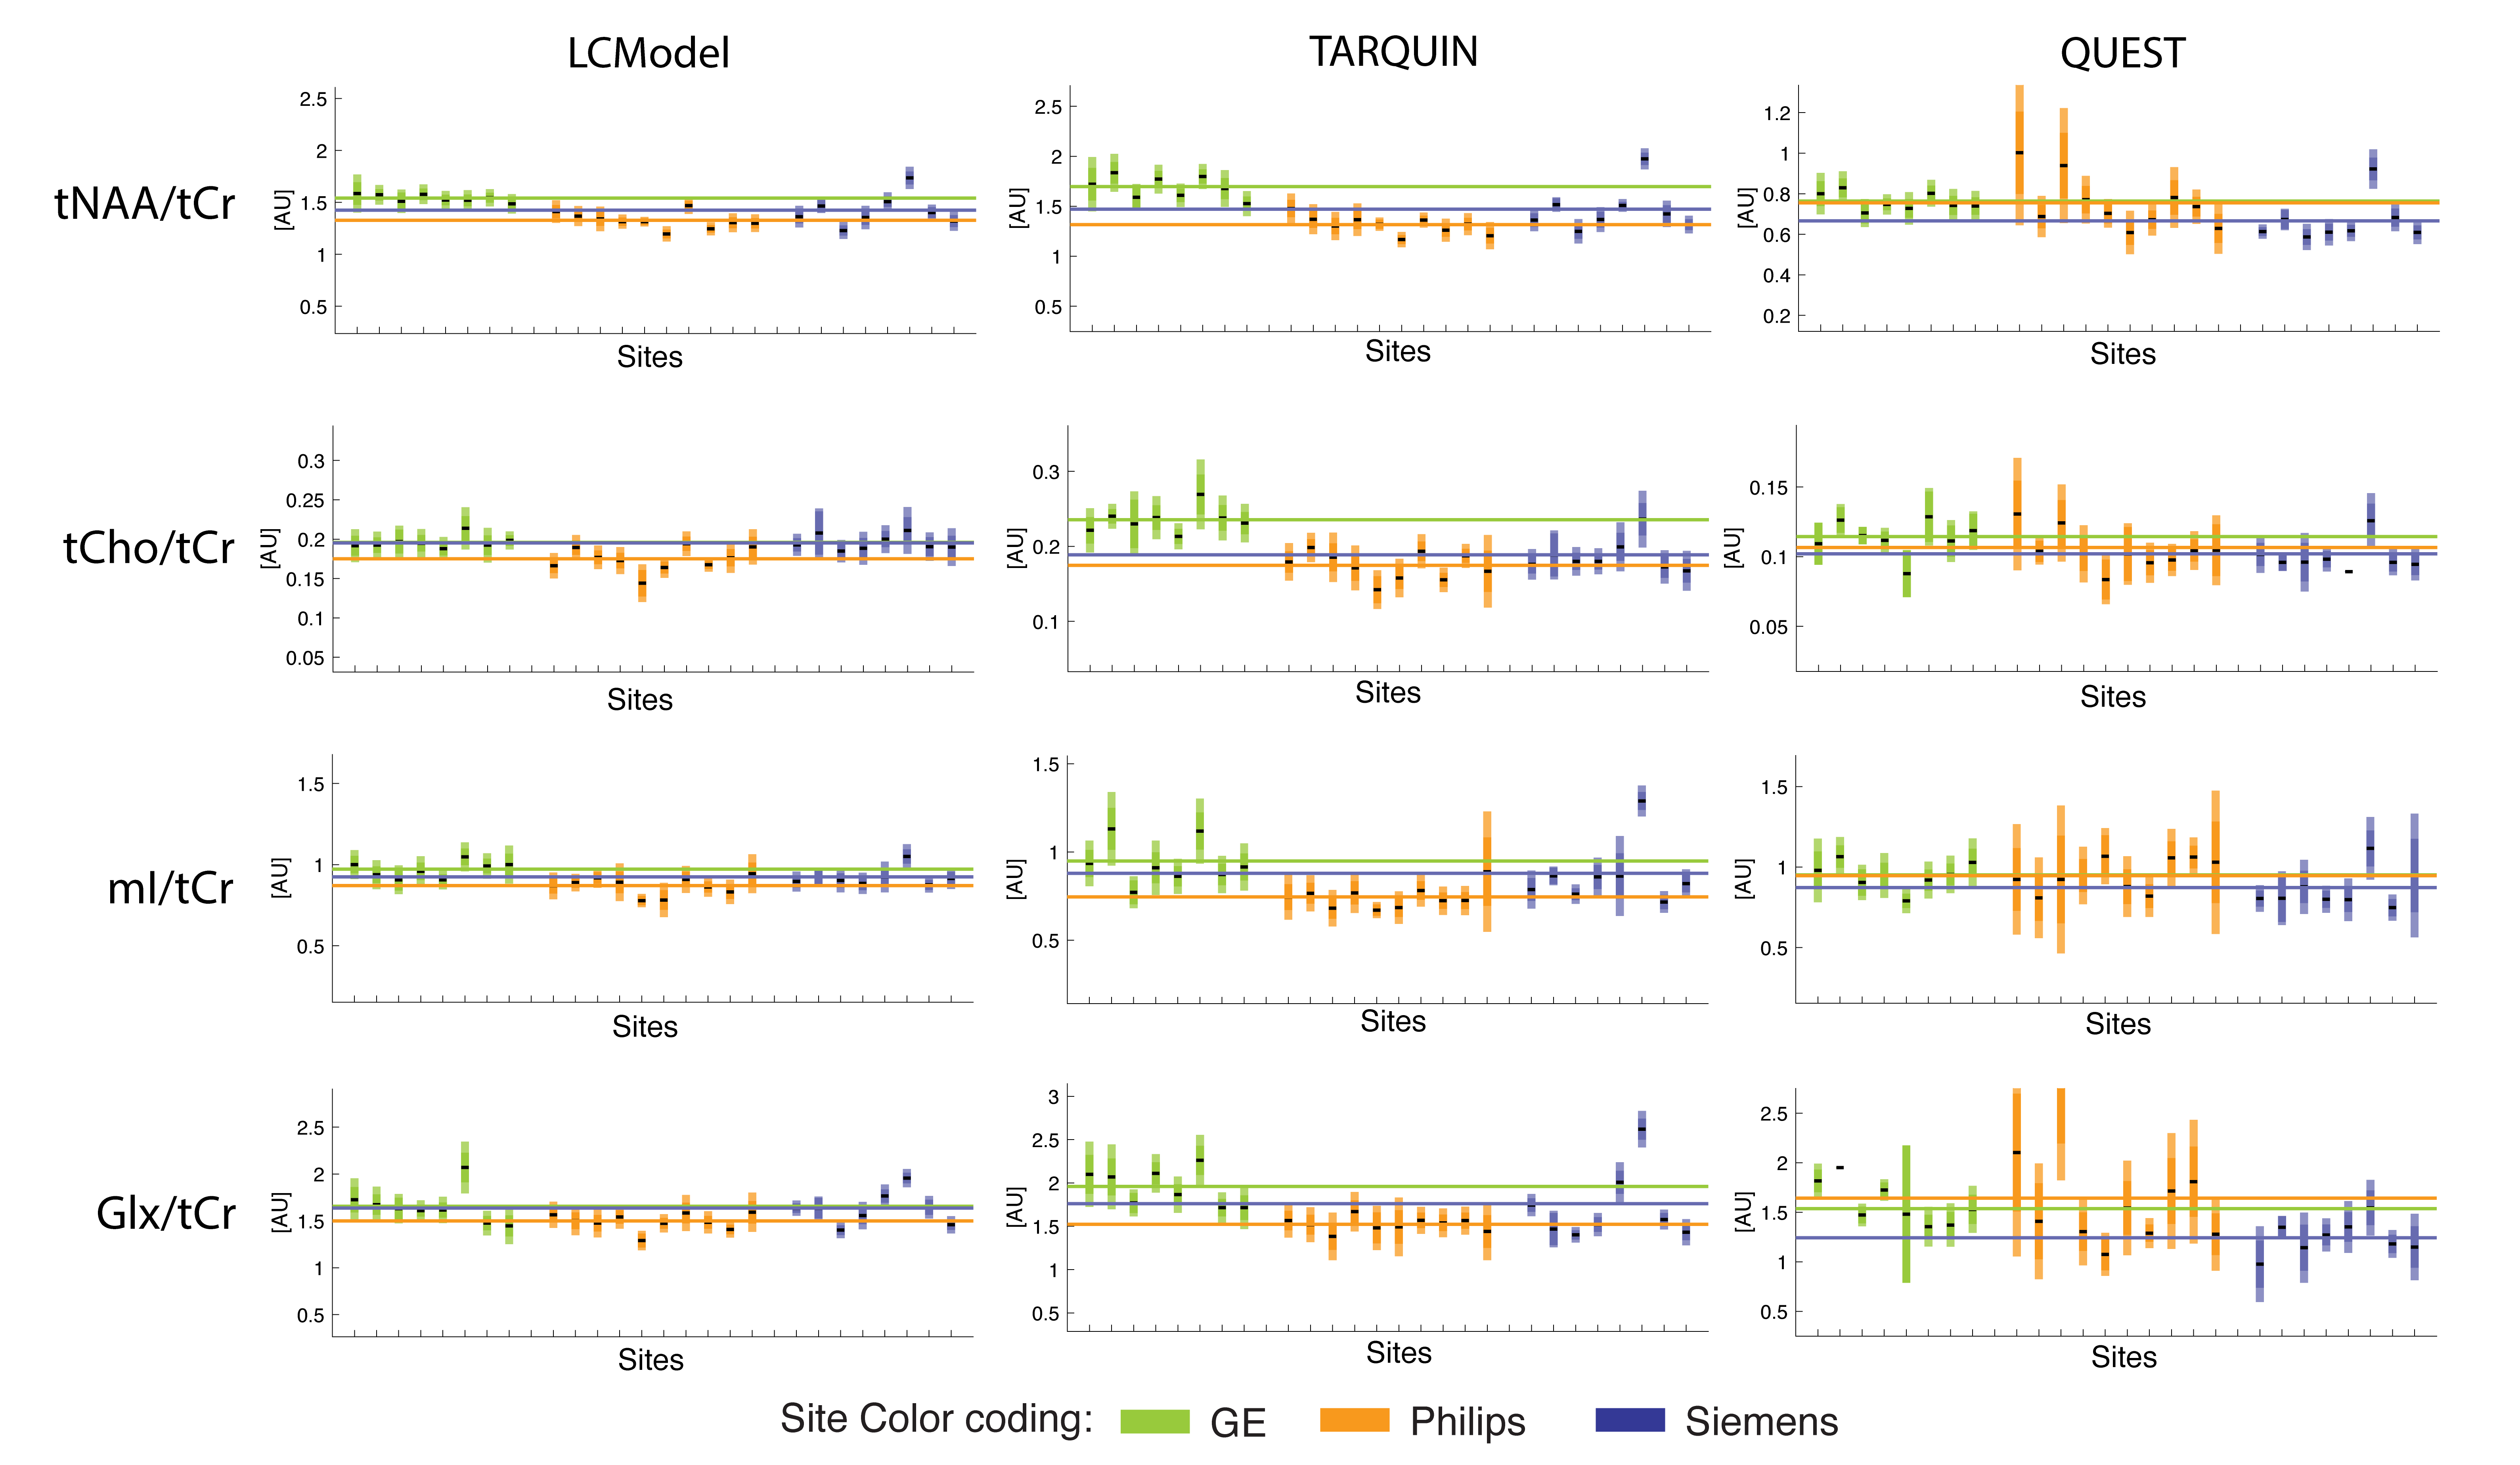
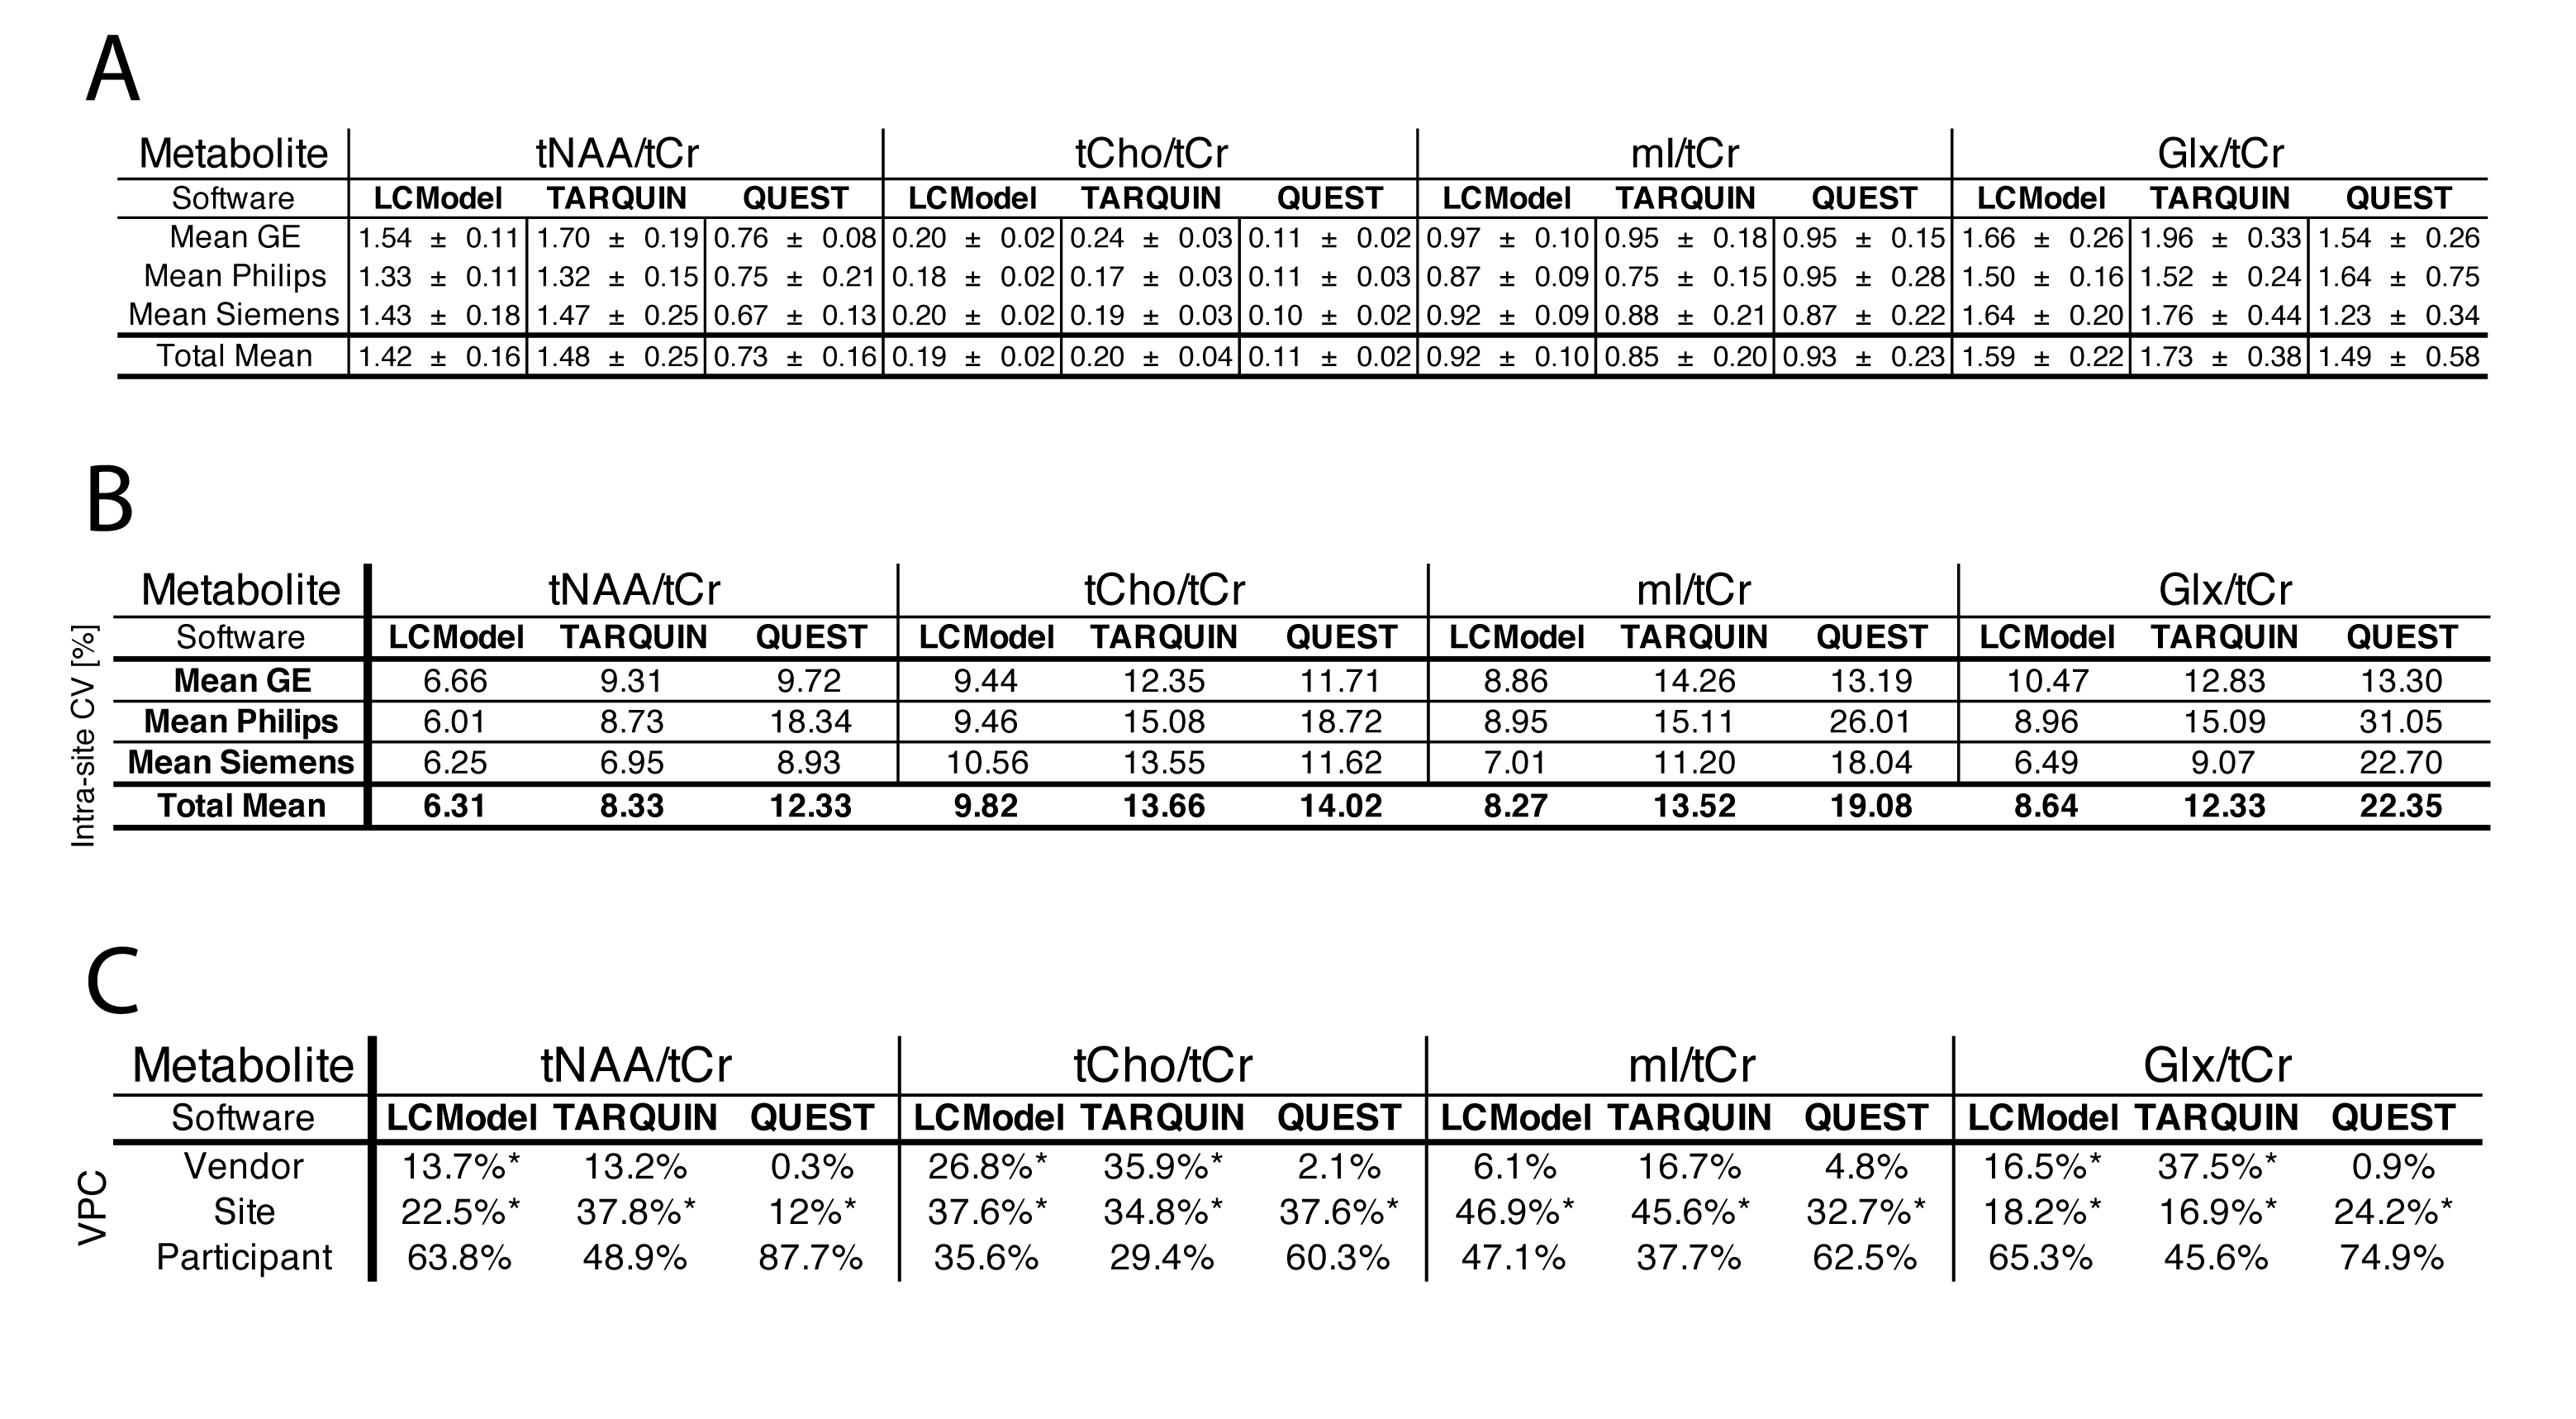
The fitting performance of LCModel, TARQUIN and QUEST is shown in Fig.2. The mean Cramer-Rao Lower Bounds (CRLB) across all sites and vendors were <1.5% for tNAA and tCr, <3.5% for tCho, <4% for mI, and <5% for Glx for all three software packages. Site-mean and vendor-mean metabolite ratios are reported in Fig.3 and Fig.4A, respectively. Vendor-mean and total mean intra-site (between-subject) CV are shown in Fig.4B. For LCModel vs. TARQUIN, Pearson’s r ranged from 0.66 (mI/tCr) to 0.88 (tNAA/tCr), whereas for QUEST compared to LCModel or TARQUIN, Pearson’s r ranged from ~ 0.02 (Glx/tCr) to ~0.47 (tCho/tCr) (Fig.5). Pearson’s r of the measured MM spectrum (MM/tCr) included in the basis set was 0.73 for LCModel vs. TARQUIN, whereas only ~0.01 for LCModel vs. QUEST or TARQUIN vs. QUEST. Significant vendor effects were found for tNAA/tCr (LCModel), Glx/tCr and mI/tCr (LCModel,TARQUIN) only (Fig.4C). A significant effect of site was found for all metabolite ratios and all packages.Discussion
All three software packages provided an overall good quality of fit characterized by minimal residuals and low CRLBs. Calculated metabolite ratios were in agreement with the literature11,12. Within-site and between-site variability were lowest for LCModel, followed by TARQUIN and QUEST. Higher intra-site CVs found in Philips data fitted with QUEST and TARQUIN may reflect the minor differences in pre-processing. Despite identical scaling, metabolite ratios of tNAA/tCr and tCho/tCr reported from QUEST were consistently lower compared to other two packages. Based on the Pearson’s r, LCModel and TARQUIN were shown to agree well for all reported metabolites, whereas QUEST exhibited a poor consistency, particularly for Glx/tCr. A potential source of variation between software packages is the different handling of the baseline in QUEST (Fig.2), with direct impact on the concentration estimation of the MM background (manifested by very small MM/tCr Pearson’s r for QUEST)13. Differences in soft constraints and prior quantification knowledge applied by each software package may also bias concentration estimates. The site effect on the total variation of data was similar for all metabolites and software and may reflect the site-specific methodology. The vendor-effect is most probably a combined effect of the vendor-specific prior knowledge and differences in sequence timings across vendors. Further investigation is needed to resolve the quantitative disparity of 1H-MRS results.Conclusion
An automated analysis of large multi-site datasets helped to reveal some of the possible sources of bias in 1H-MRS quantification. The results confirmed an important role of the analysis parameters and a baseline model used for quantification. These findings may facilitate a standardization of MRS quantification.Acknowledgements
This work was supported by NIH grants R01 EB016089, R01 EB023963 and P41 EB015909.References
1. G, Ö., JR, A., Barker, P. B. et al., E. Clinical Proton MR Spectroscopy in Central Nervous System Disorders. Radiology 270, 658–679 (2014).
2. Bhogal, A. A. et al. 1H–MRS processing parameters affect metabolite quantification: The urgent need for uniform and transparent standardization. NMR Biomed. 30, 1–9 (2017).
3. Scott, J., Underwood, J., Garvey, L. J., Mora-Peris, B. & Winston, A. A comparison of two post-processing analysis methods to quantify cerebral metabolites measured via proton magnetic resonance spectroscopy in HIV disease. Br. J. Radiol. 89, 1–7 (2016).
4. Provencher, S. W. Estimation of metabolite concentrations from localized in vivo proton NMR spectra. Magn. Reson. Med. 30, 672–679 (1993).
5. Reynolds, G., Wilson, M., Peet, A. & Arvanitis, T. N. An algorithm for the automated quantitation of metabolites in in vitro NMR signals. Magn. Reson. Med. 56, 1211–9 (2006).
6. Naressi, A. et al. Java-based graphical user interface for the MRUI quantitation package. MAGMA 12, 141–52 (2001).
7. Považan, M. et al. Multi-vendor, multi-site comparison of 1H-MRS PRESS data acquired at 25 research sites. Proc. Jt. Annu. Meet. ISMRM-ESMRMB, Paris, Fr. 68, 160 (2018).
8. Bottomley, P. Selective volume method for performing localized NMR spectroscopy. US patent 4,480,228 (1984). doi:10.1016/0730-725X(85)90032-3
9. Berrington, A. et al. Improved localisation for 2-hydroxyglutarate detection at 3T using long-TE semi-LASER. Tomogr. a J. imaging Res. 2, 94–105 (2016).
10. Mikkelsen, M. et al. Big GABA: Edited MR spectroscopy at 24 research sites. Neuroimage 159, 32–45 (2017).
11. Baker, E. H. et al. Regional apparent metabolite concentrations in young adult brain measured by (1)H MR spectroscopy at 3 Tesla. J. Magn. Reson. Imaging 27, 489–99 (2008).
12. Kirov, I. I. Concentration Ranges of Common Metabolites Detected by MRS in Healthy Human Tissue. in Handbook of Magnetic Resonance Spectroscopy In Vivo: MRS Theory, Practice and Applications 1232 (2016).
13. Giapitzakis, I.-A., Borbath, T., Murali-Manohar, S., Avdievich, N. & Henning, A. Investigation of the influence of macromolecules and spline baseline in the fitting model of human brain spectra at 9.4T. Magn. Reson. Med. 1–13 (2018). doi:10.1002/mrm.27467
Figures