4243
Impact of wavelets and apodisation in magnetic resonance spectroscopy quality for paediatric brain tumours1Institute of Cancer and Genomic Sciences, University of Birmingham, Birmingham, United Kingdom, 2Birmingham Children’s Hospital NHS Foundation Trust, Birmingham, United Kingdom
Synopsis
Ependymomas, medulloblastomas and pilocytic astrocytomas are common paediatric central nervous system tumours. In vivo 1H magnetic resonance spectroscopy is a non-invasive technique to determine tumour metabolic characteristics, however suffers from limited signal-to-noise ratios. Our previous studies demonstrated that metabolite concentration estimation may be improved through wavelet de-noising on both simulated and in vivo MRS data, as reflected by improved tumour classification. In this study we compared improvements in fit quality using both wavelets and apodisation on simulated and in vivo MRS data of the three tumours by measuring overall and regional SNR.
Introduction
Ependymomas (EP), medulloblastomas (MB) and pilocytic astrocytomas (PA) are common paediatric central nervous system tumours. In vivo 1H magnetic resonance spectroscopy (MRS) is a non-invasive technique to determine tumour metabolic characteristics, however suffers from limited signal-to-noise ratios. Previous studies have found that estimated metabolite concentrations can be used as sensitive biomarkers to classify the three groups of brain tumours, achieving a success rate of 95%1-2. Our previous studies demonstrated that metabolite concentration estimation may be improved through wavelet de-noising on both simulated and in vivo MRS data, as reflected by improved tumour classification . In this study we compared improvements in fit quality using both wavelets and apodisation on simulated and in vivo MRS data.Materials and methods
Simulation Single metabolite spectra were generated using the Versatile Simulation, Pulses, and Analysis (VeSPA) (TE=30ms, B0=1.5T, line broadening frequency=3Hz, metabolites=choline, creatine, glutamine, glutamate, lactate, myo-inositol, N-acetylaspartate (NAA), scyllo-inositol and taurine). Tumour spectra were then generated by combining single metabolite spectra to be representative of clinical in vivo MRS4. Gaussian white noise was added to the Free Induction Decay (FID) to produce noisy data (SNR=4-20dB).
Clinical data acquisition Clinical MRS was acquired using the Siemens 1.5 T scanner and the single-voxel spectroscopy (SVS) with the Point-RESolved Spectroscopy (PRESS) sequence (TE=30ms, TR=1500ms) at Birmingham Children’s Hospital. A total of 68 cases were enrolled, including 7 infratentorial EP, 30 MB and 31 PA, diagnosis confirmed by biopsy. All cases were validated through T2W structural MRI to make sure voxels had been placed inside tumours.
Data Processing De-noising was performed using both wavelets and FID apodisation. Based on our previous results3, discrete wavelet transforms were used decompose the FID signals and level-dependent thresholding was used to reconstruct the de-noised signals from the signal components5-6. Wavelet bases were selected based on the SNR of de-noised spectra. Apodisation was performed using exponential function, and the apodisation frequency was 3Hz for all cases. Finally, we measured the overall, maximum and metabolite SNR based on the metabolite signal intensity and background noise and used analysis of variance (ANOVA) to evaluate de-noising performance.
Results
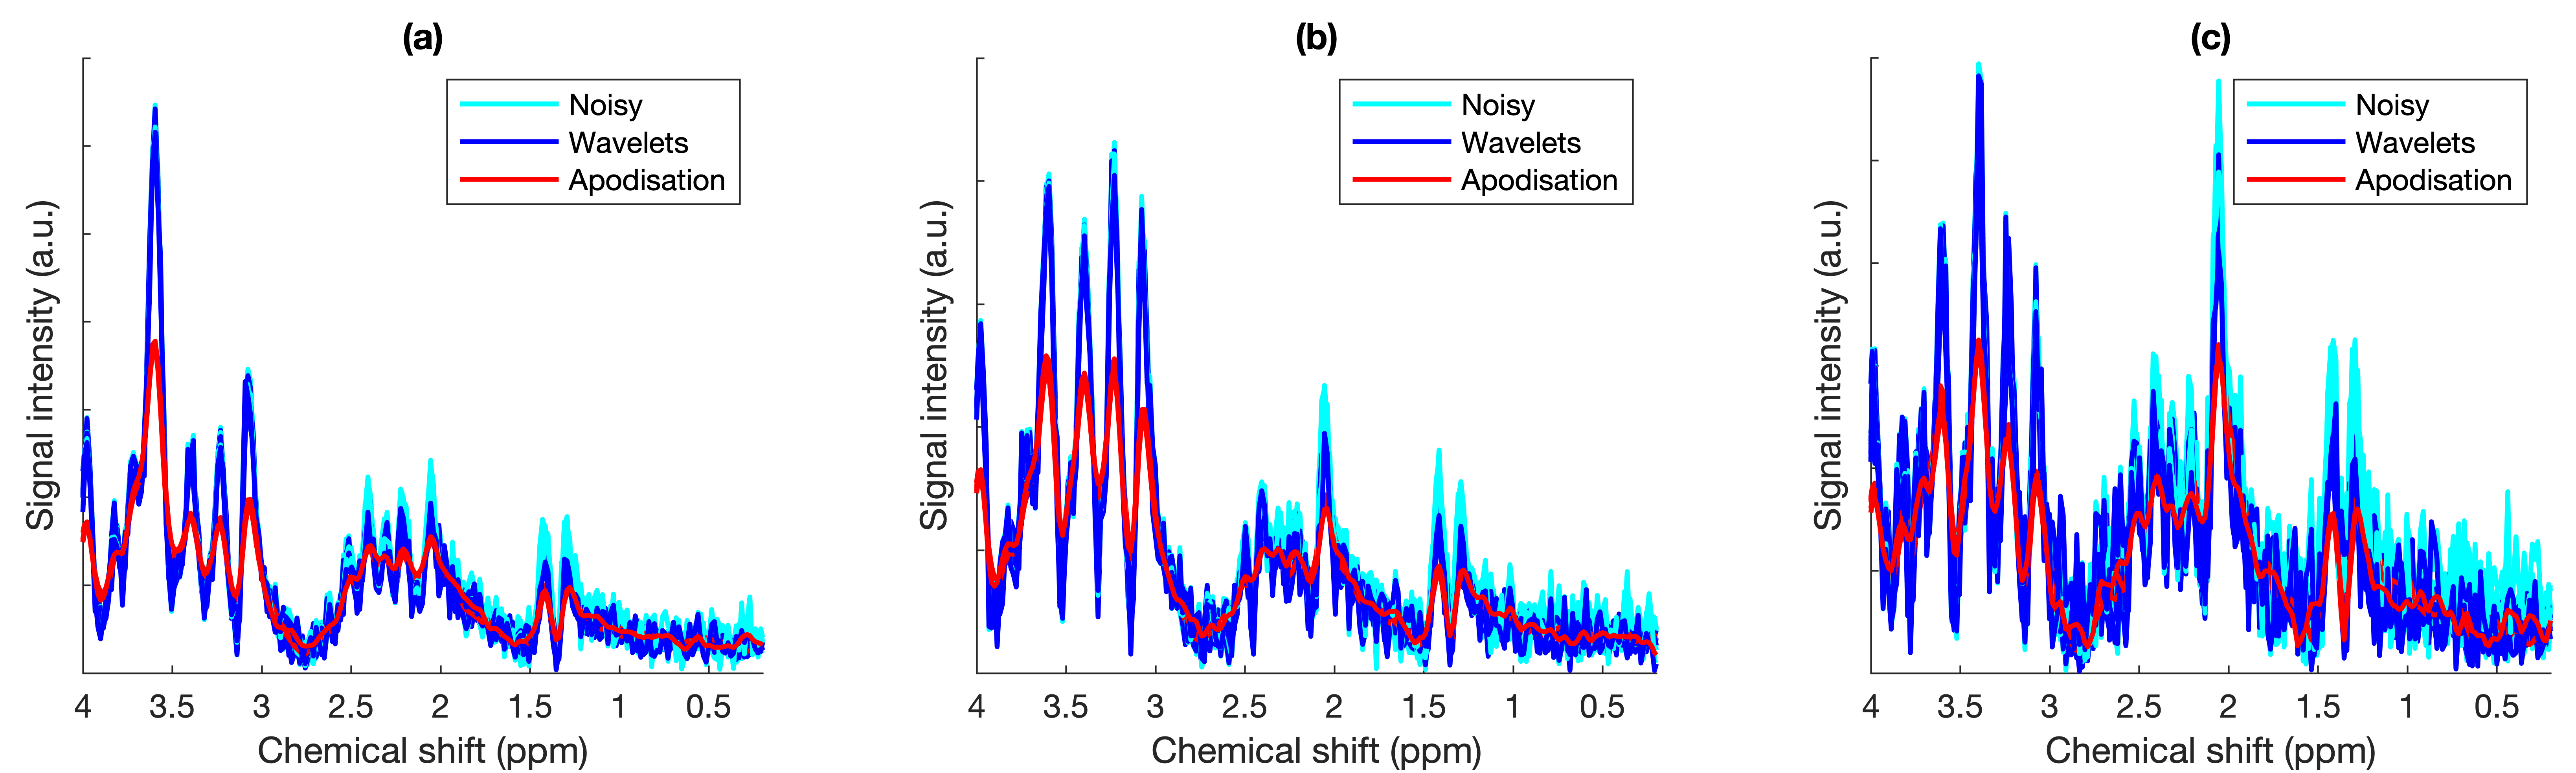
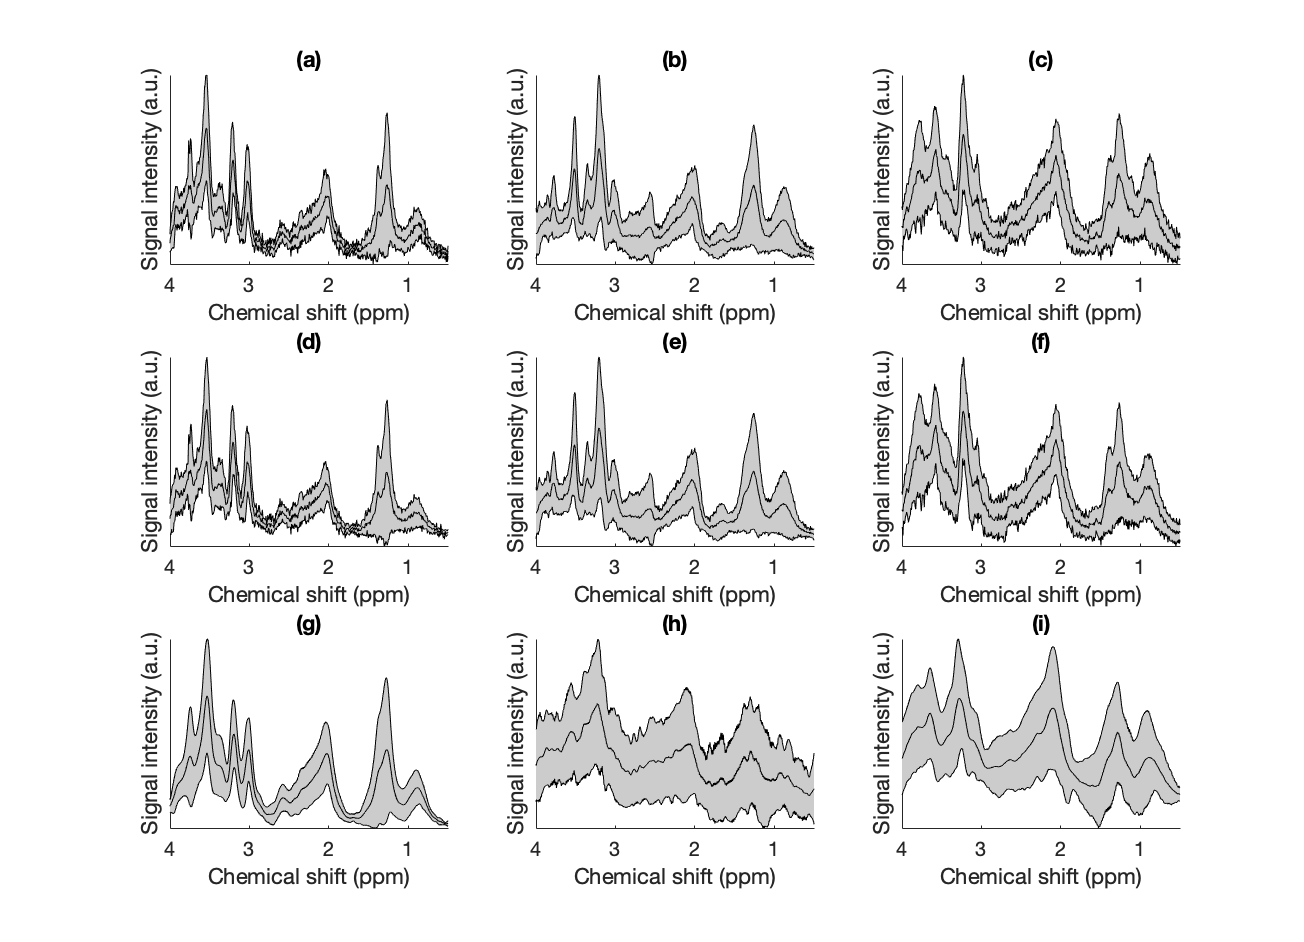
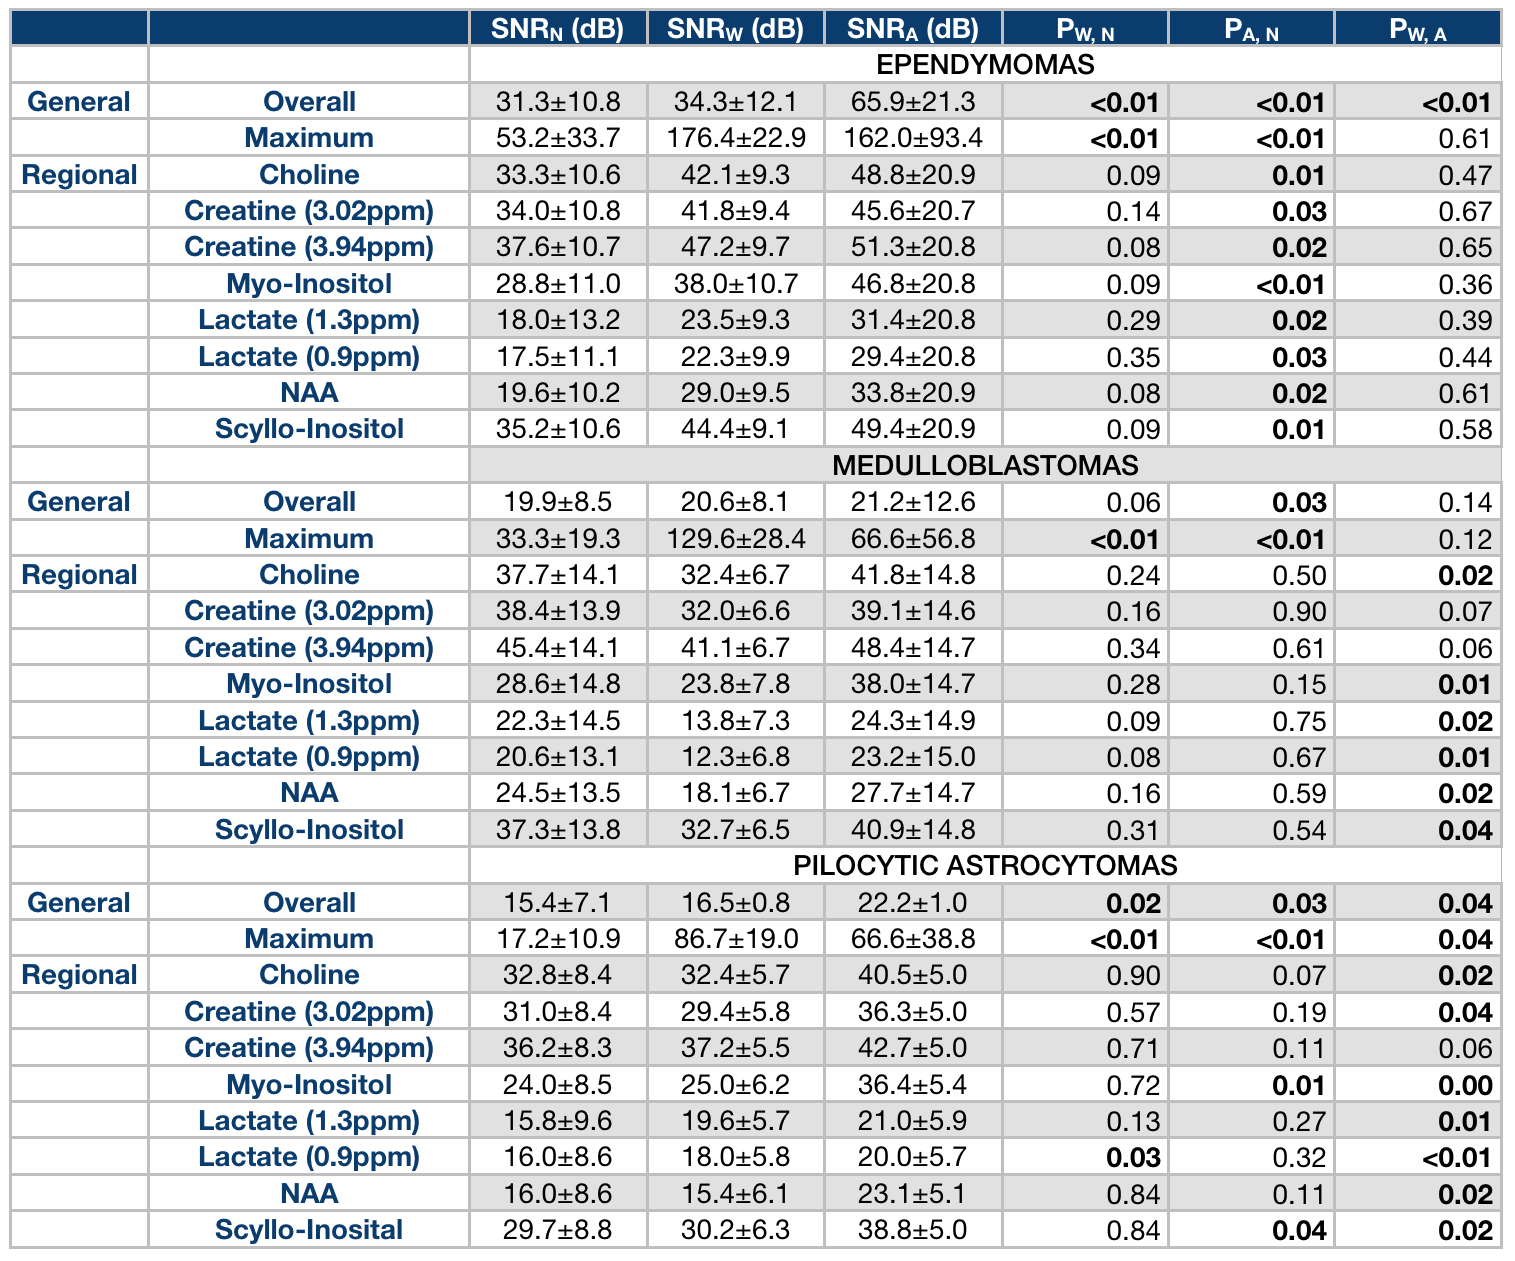
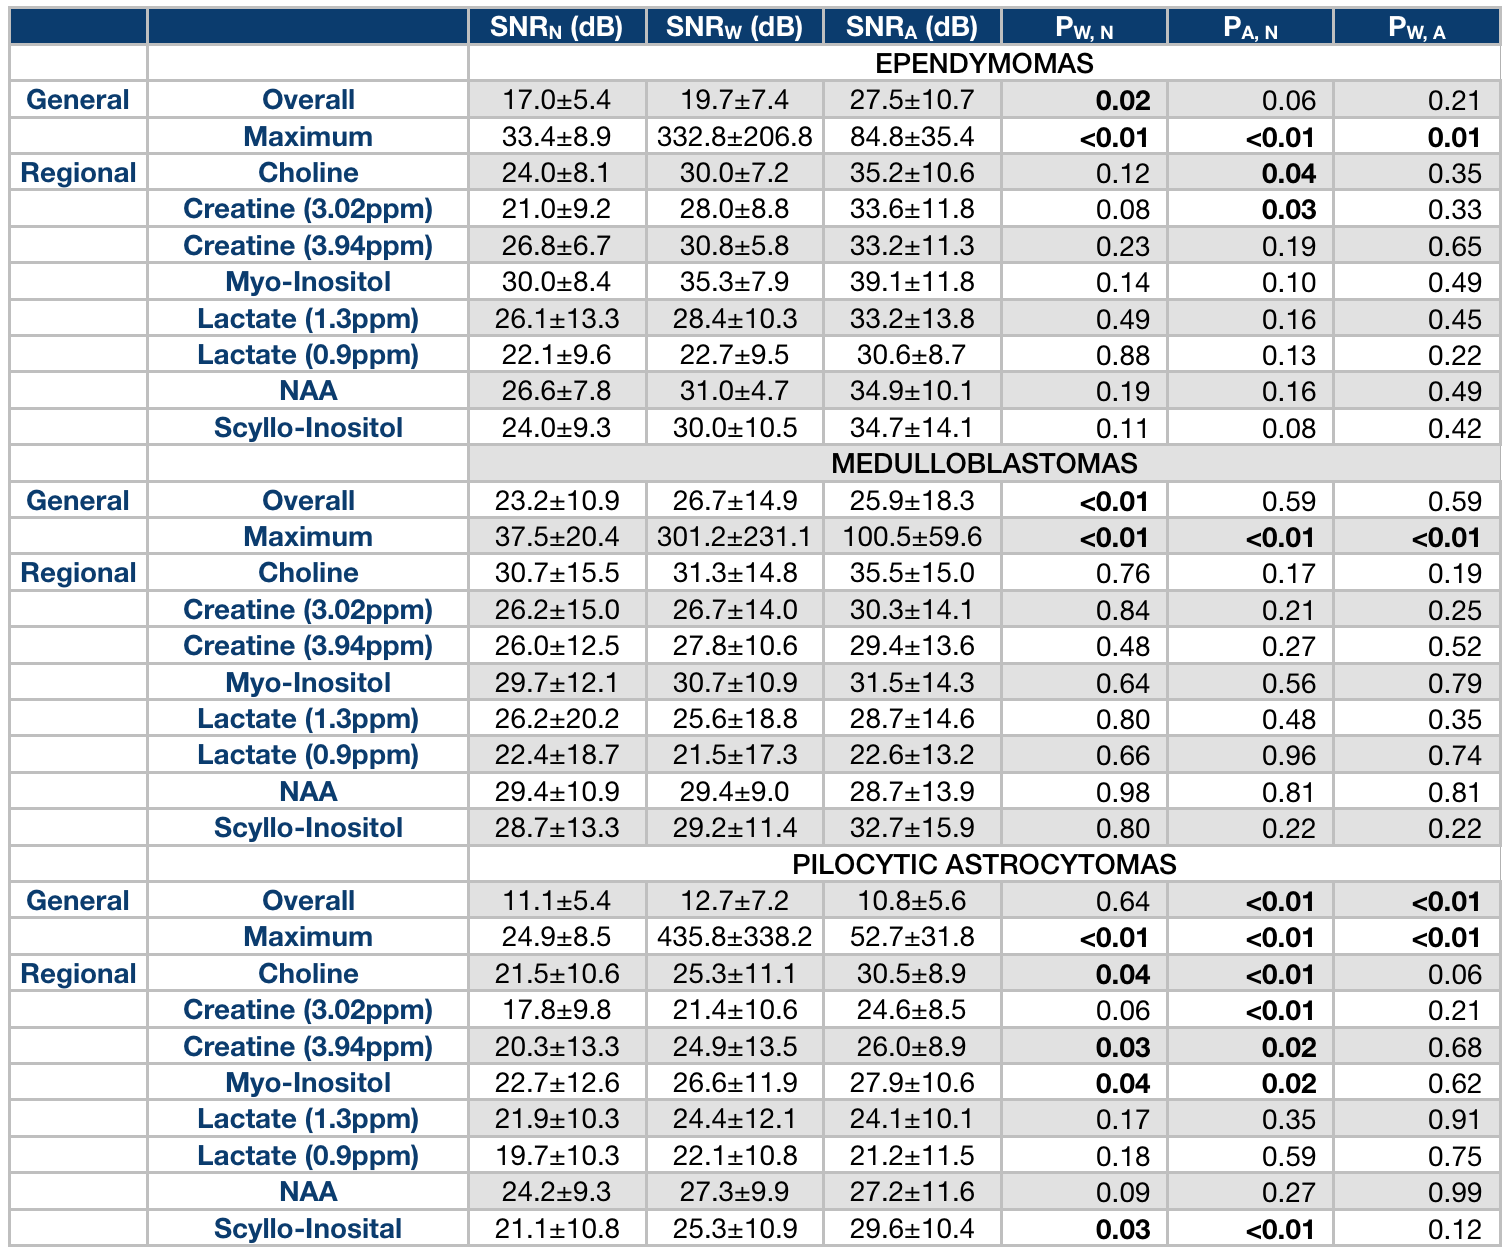
Figure 1 shows a group of simulated EP, MB and PA MRS noisy and de-noised spectra (SNR=4dB). Figure 2 shows the average in vivo noisy and de-noised spectra with standard deviation for all enrolled cases. Table 1 and Table 2 demonstrate details of de-noising performance for simulated and in vivo MRS, with the SNR of choline, creatine, myo-inositol, lactate, NAA, scyllo-inositol and taurine shown. Maximum SNR was significantly improved through wavelets and apodisation (P<0.01). MRS quality of ependymomas was improved by wavelets as overall SNR significantly increased (Psimu<0.01, Pvivo=0.02), and that of pilocytic astrocytomas was also improved by apodisation (Psimu=0.03, Pvivo<0.01). Regional SNR was generally improved by apodisation, including choline (Psimu=0.01, Pvivo=0.04), creatine (3.02ppm, Psimu=0.03, Pvivo=0.03) in MRS of ependymomas as well as myo-inositol (Psimu=0.01, Pvivo=0.02) and scyllo-inositol (Psimu=0.04, Pvivo<0.01) in MRS of pilocytic astrocytomas.Discussion
We have investigated the utility of wavelet and apodisation-based de-noising to improve MRS quality, with the increased performance reflected by increased overall, maximum and metabolite SNR for both simulated and in vivo MRS. Our previous results have shown that wavelet de-noising may increase accuracy of metabolite concentration estimation in simulated MRS3. The generally improved overall, maximum and region SNR in both simulated and in vivo MRS support the use of wavelets and apodisation in MRS post-processing. In the simulated MRS, more significantly increased overall SNR shows from apodisation rather than wavelets (P<0.05), while wavelets perform relatively better than apodisation in maximum SNR. Meanwhile, unstable improvement of SNR by apodisation is reflected by the enlarged variance compared to the noisy and wavelet results, which also appears for in vivo MRS. Compared to apodisation, wavelets reserve several metabolite details, which is reflected mainly in lactate for medulloblastomas. Performance of apodisation de-noising may be further improved by using an adaptive apodisation frequency, based on the water peak full width at half maximum for each data set. There might also be a possible situation that apodisation firmly decrease the noise, and this dominates the SNR even if metabolite peaks have been filtered. Our future work will consider full width at half maximum as the other criteria to evaluate the de-noising performance.Acknowledgements
No acknowledgement found.References
- Manias KA, Gill SK, MacPherson L, Foster K, Oates A, Peet AC. Magnetic resonance imaging based functional imaging in paediatric oncology. European Journal of Cancer. 2017 Feb 1;72:251-65.
- Davies NP, Wilson M, Harris LM, Natarajan K, Lateef S, Macpherson L, Sgouros S, Grundy RG, Arvanitis TN, Peet AC. Identification and characterisation of childhood cerebellar tumours by in vivo proton MRS. NMR in Biomedicine: An International Journal Devoted to the Development and Application of Magnetic Resonance In vivo. 2008 Oct;21(8):908-18.
- Zhao D, Sun Y, Sawlani V, Babourina-Brooks B, Rose HL, Peet AC. Improving MRS classification of children’s brain tumours through wavelet de-noising. Proceedings the 24th British Chapter of ISMRM Annual Meeting. Oxford, England, 24-26 Sep, 2018.
- Zarinabad N, Abernethy LJ, Avula S et al. Application of pattern recognition techniques for classification of pediatric brain tumors by in vivo 3T (1) H-MR spectroscopy-A multi-center study. Magn Reson Med. 20171-8.
- Cancino‐De‐Greiff HF, Ramos‐Garcia R, Lorenzo‐Ginori JV. Signal de‐noising in magnetic resonance spectroscopy using wavelet transforms. Concepts in Magnetic Resonance: An Educational Journal. 2002;14(6):388-401.
- Gudbjartsson H, Patz S. The Rician distribution of noisy MRI data. Magnetic resonance in medicine. 1995 Dec;34(6):910-4.
Figures