4239
Recommendations for Accurate Basis Set Generation for Magnetic Resonance Spectroscopy Quantification1Biomedical Engineering, Columbia University, New York, NY, United States, 2Radiology, Columbia University, New York, NY, United States
Synopsis
Data from magnetic resonance spectroscopy (MRS) experiments require quantification, which consists of fitting the measured data to a series of scaled, shifted and broadened spectral lines, referred to as a basis set. The numerical generation of basis sets necessitates certain assumptions and approximations to ensure practicality given the available computational power and memory size. However, these assumptions can substantially impact the derived spectral lineshapes. Common assumptions found throughout the literature were systematically investigated with our newly developed MAgnetic Resonance Spectrum Simulator (MARSS) software and recommendations are given to generate realistic basis sets for accurate quantification of MRS studies.
Introduction
A critical portion of an in vivo magnetic resonance spectroscopic (MRS) experiment is quantification, which typically involves fitting the measured spectrum to a linear combination of scaled and line-broadened underlying lineshapes, referred to as basis sets1. In order to accurately estimate the concentration of the metabolites of interest it is of utmost importance that physically realistic basis sets are used. Some previous simulation results have been shown to disagree with experiments for reasons not entirely known2. To date, little attention has been paid to the numerous assumptions made in generating basis sets, which we hypothesize to be at least in part responsible for measured previously reported disagreements between simulations and experiment2.
Here the effect of four assumptions which are often used within the literature are systematically investigated and recommendations are given for generation of realistic basis sets: These include:
1) number of spatial points necessary in the volume integral (which also investigates the so-called “hard pulse” approximation corresponding to a single point in space),
2) coherence order pathway handling with crusher gradients,
3) effects of relaxation during RF pulses,
4) experimental details between different vendor sequences.
Methods
All simulations were performed with the in-house software package MAgnetic Resonance Spectrum Simulator (MARSS), which employs the full density matrix formalism4, with the entire details and experimental validation given in another submitted abstract. All spectra were simulated at 3 Tesla and all displayed spectra were line broadened by 2 Hz exponential apodization (narrower than in vivo linewidths in order to be sensitive to subtle differences).
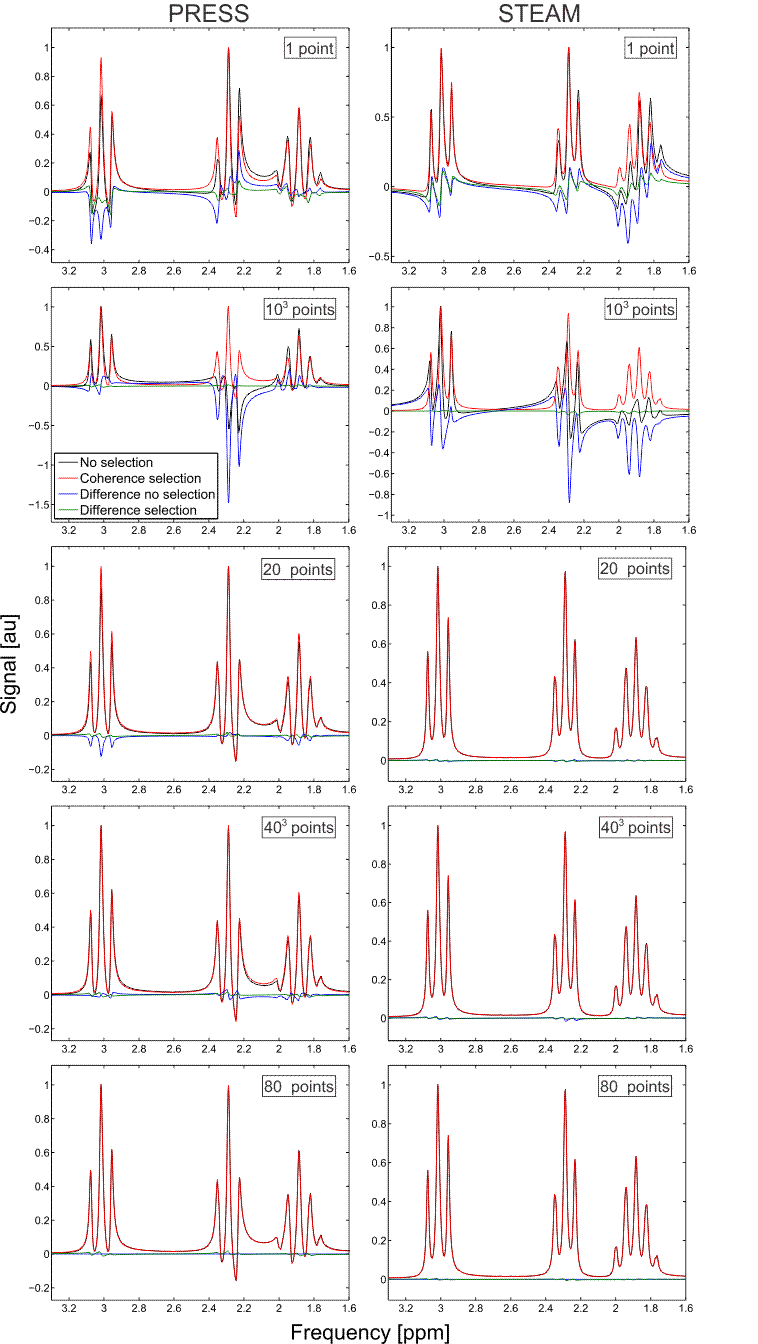
To investigate the first two assumptions two different pulse sequences were simulated: General Electric’s (GE) PRESS5 and STEAM6 (which included RF pulses, slice-select gradients, crusher gradients and timings identical to nominal experimental parameters), with echo times (TE) of 30 and 20 ms, respectively, for the metabolite gamma-aminobutyric acid (GABA). Signals were generated for five different number of spatial points: 1 (which is analogous to the hard-pulse approximation), 103, 203, 403, and 803. Signals were generated by filtering the density matrix following each RF pulse according to the equation
$$\rho_f(x,y,z) = F\circ\rho(x,y,z), $$
where $$$\circ$$$ denotes the Hadamard or element-wise multiplication and $$$F$$$ is the filter matrix which has element values of 1 for elements which correspond to the desired coherence order for that particular time interval and 0 for all other elements. This filtering is a novel method of appropriately handling coherence pathways. Identical simulations were also done without this filter to assess the impact of the coherence pathway selection with crusher gradients.
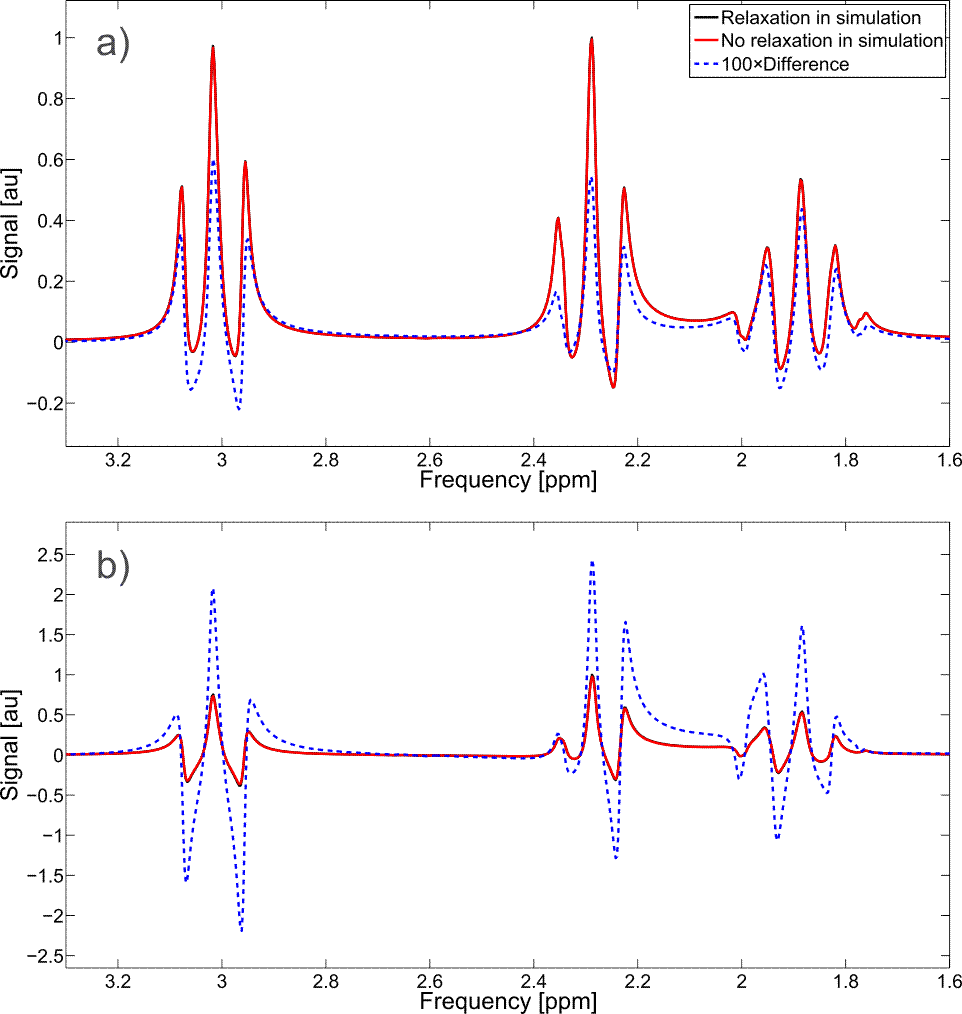
To investigate the third assumption, two simulations were run. The first incorporated proper relaxation via monoexponential T2 decay at each discretized time point (including time points during RF pulses) for single quantum coherence terms, and monoexponential recovery to the steady-state populations by T1 whereas the other simulation neglected the effects of relaxation and scaled the resultant spectrum by exp(-TE/T2). This was performed on two different sequences: GE’s PRESS sequence with TE = 30 ms (two 5.2 ms SLR refocusing pulses) and sLASER with an TE = 40 ms (four 5 ms AFP pulses). The metabolite GABA was investigated (T1 = 1310 ms7; T2 = 88 ms8) at 3T. Because GABA has a large ratio of T1/T2 the differences between the monoexponential relaxation assumption and proper relaxation incorporation into the simulation are expected to be exacerbated.
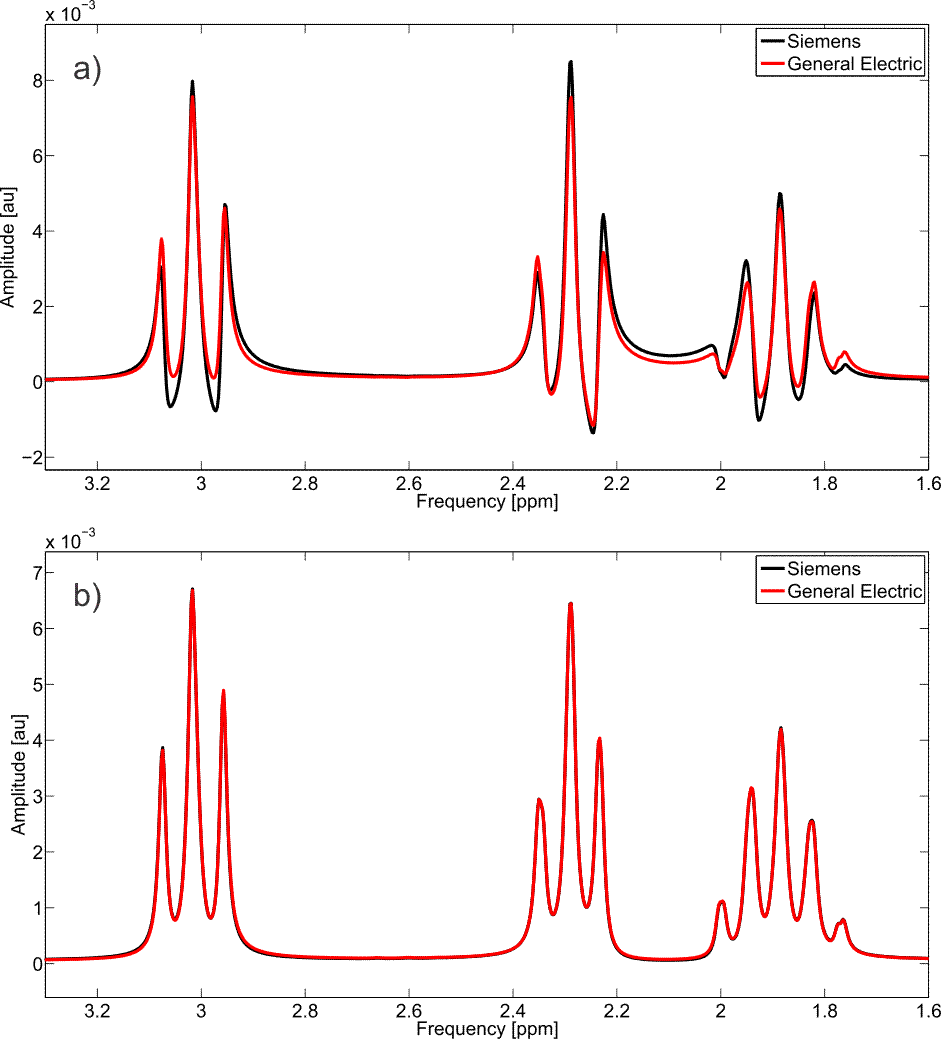
To investigate the fourth assumption, the spectra from GABA with 643 spatial points was simulated for both the Siemens and GE’s PRESS sequence with TE = 30 ms.
Results and Discussion
These recommendations are given based on the four assumptions investigated:
1 & 2) at least 203 points for STEAM and 403 points for PRESS, and when using less than that coherence pathway selection should be used, as without this the simulated spectra can deviate substantially (Figure 1).
3) Properly handling relaxation has little effect on PRESS simulation (<1%), whereas with sLASER the effect is about 2.5% (Figure 2), which indicates that for most sequences scaling the basis set without relaxation by exp(-TE/T2) is sufficient.
4) There were substantial differences between the GABA spectra from Siemens’ and GE’s stock PRESS sequence (Figure 3a), indicating that in order to accurately quantify concentrations it is critical that, for some sequences, the exact experimental details are included in the simulation, which may explain some of the variation among vendor quantification3.
Conclusion
Four assumptions commonly made within the literature in the generation of basis sets for MRS experiments were investigated. Recommendations to obtain realistic basis sets were provided to ensure accurate quantification for future studies.Acknowledgements
Special thanks to the New York State Psychiatric Institute (NYSPI) and Dr. Feng Liu for their facilities and technical support. This research was supported by the National Multiple Sclerosis Society (NMSS, RG-5319).References
- Provencher, S. Estimation of Metabolite Concentrations from Localized in Vivo Proton NMR spectra. Magn Reson Med 30, 672–679 (1993).
- Saleh, M. G. et al. Spectral simulations of glutathione at 7T: Comparison of two different spin system parameter sets. Proc Intl Soc Mag Reson Med Program Number 3971.
- Mikkelsen, M. et al. Big GABA: Edited MR spectroscopy at 24 research sites. Neuroimage 159, 32–45 (2017).
- Malom H. Levitt. Spin Dynamics. (Wiley, 2008).
- Bottomley, P. A. Spatial Localization in NMR Spectroscopy in Vivo. Ann N Y Acad Sci 508, 333–348 (1987).
- Haase, A., Frahm, J., Matthaei, D., Hanicke, W., Bomsdorf, H., Dietmar, K., Tischler, R. MR imaging using stimulated echoes (STEAM). Radiology 160, 787–790 (1986).
- Puts, N. A. J., Barker, P. B. & Edden, R. A. E. Measuring the longitudinal relaxation time of GABA in vivo at 3T. J Magn Reson Imag 37, 999–1003 (2013).
- Edden, R., Intrapiromkul, J., Zhu, H., Cheng, Y. & Barker, P. B. Measuring T2 in vivo with J‐difference editing: Application to GABA at 3 tesla. Jour Magn Reson Imag 35, 229–234 (2012).
Figures