4235
T2 Measurement and quantification of cerebral white and gray matter aspartate concentrations in vivo1Semenov Institute of Chemical Physics of RAS, Moscow, Russian Federation, 2Clinical and Research Institute of Emergency Pediatric Surgery and Trauma, Moscow, Russian Federation, 3Emanuele Institute of Biochemical Physics of RAS, Moscow, Russian Federation
Synopsis
In this study for the first time in vivo transverse relaxation rate (T2) of aspartate (Asp) from Asp edited MEGA-PRESS spectra using phanton data were quantified as 161±33 ms. Asp concentrations in gray matter (GM)- and white matter (WM)-dominant brain regions were measured as 2.78±0.21 mM vs 1.04±0.16 mM, respectively. Estimation of the absolute Asp concentrations with Asp editing MEGA-PRESS has potential in many research applications, such as studying the processes underlying the reduction of N‐acetyl aspartate. The T2 measurement method which has been successfully applied for edited Asp signals can also be used for other strongly J-coupled signals.
Introduction
Recent studies1,2 revealed using MEGA-PRESS for detection of Asp (Asp edited MEGA-PRESS), where On editing pulse set to δOn=3.89 ppm to affect CH- Asp resonance at 3.89 ppm and therefore to refocus the TE evolution of scalar couplings between the Asp spins and non-equivalent β-aspartyl proton ones at δ=2.80 and 2.65 ppm. As a result according to1,2 in the edited spectrum (δOff=5.21 ppm) we can observe strong total non-overlapped Asp signal at δ≈2.72 ppm using at least four suitable TE (90, 115, 140 and 150 ms). This theoretically makes it possible to measure T2 of Asp from Asp edited MEGA-PRESS and consequently is an important step in making this editing method quantitative.Methods
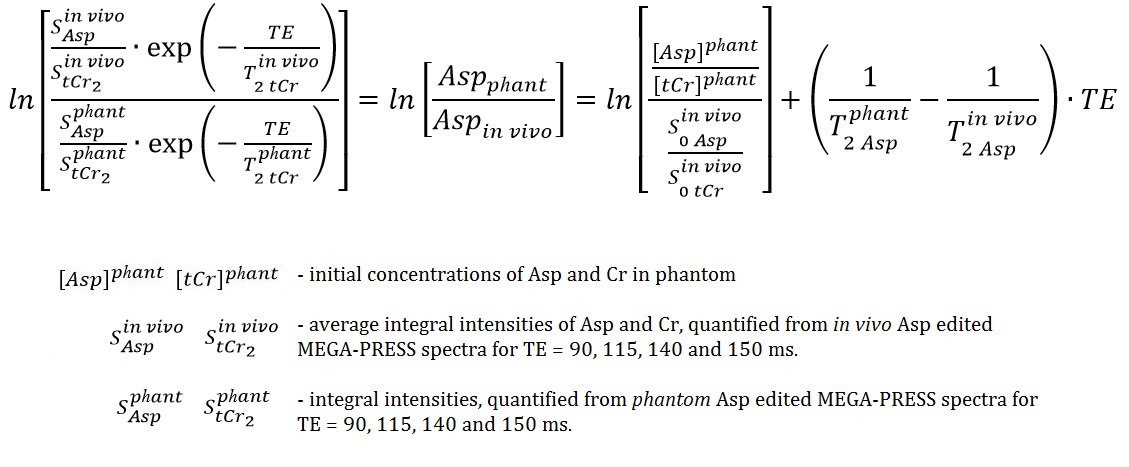
Function describing TE-dependence of the Asp signal in Diff spectrum is non-periodic function, the analytical form of which cannot be obtained, due to J-evolution, that strongly complicates T2 measurements1. To avoid that difficulty this function can be expressed from phantom Asp edited MEGA-PRESS spectra. The resulted linear functionis shown on fig.1.
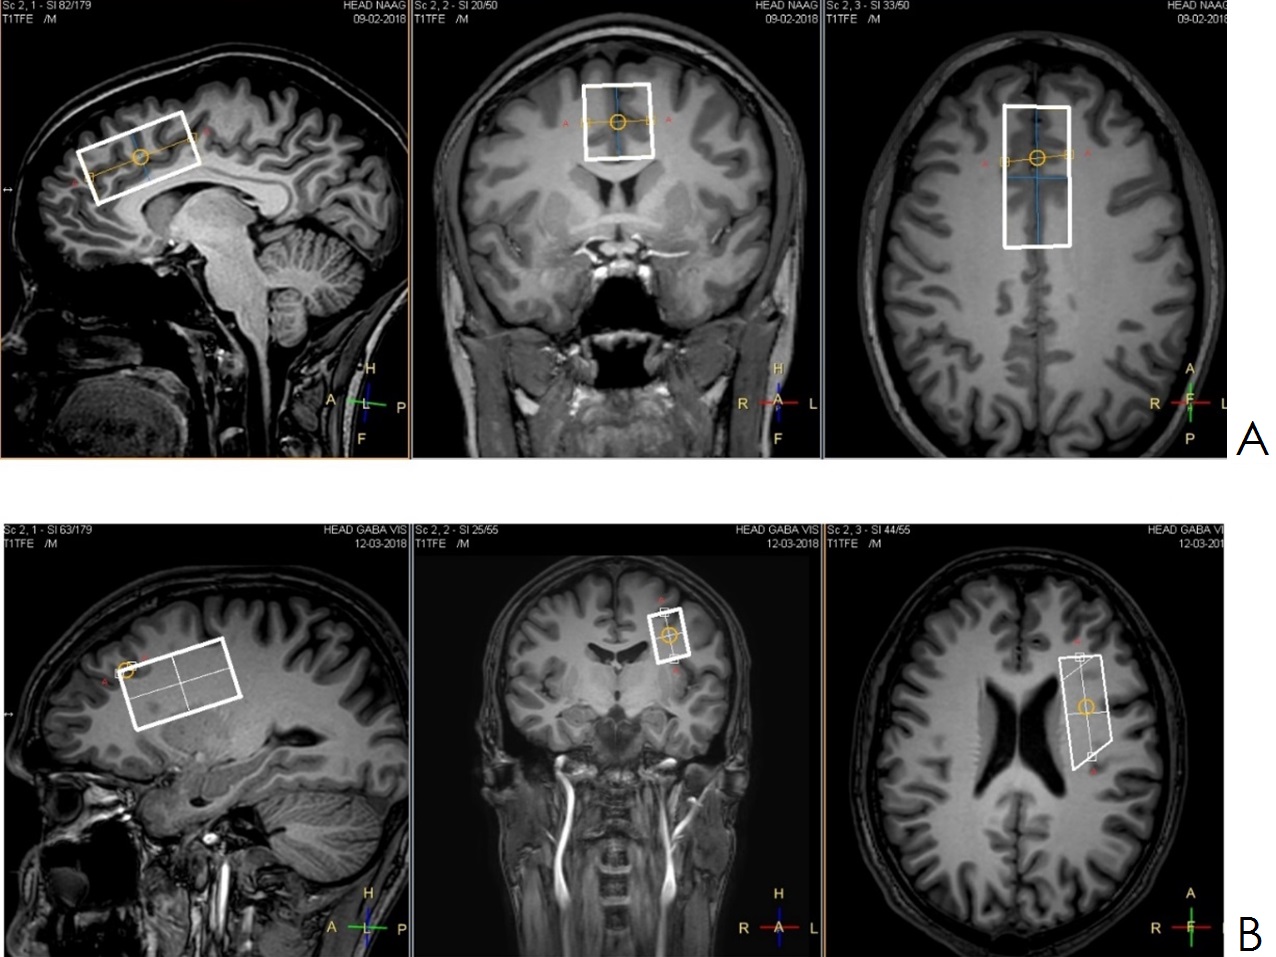
Phantom T2 values of Asp and Cr were obtained from phantom (Asp – 6mM; Cr – 20mM) from PRESS spectra (TE=35, 70, 90, 100, 120, 140ms, TR=10s) using quantification with prior data in VESPA analysis tool. Asp edited MEGA-PRESS (TE=90, 115, 140 and 150 ms, TR=2s) spectra were acquired from both the phantom (Asp – 6mM; Cr – 20mM) and in vivo (16 healthy volunteers, 8 spectra for each TE point, VOI in size of 50×25×25mm, ACC) (fig.2). Spectra were quantified using AMARES routine.Asp concentrations with were quantified from gray- (ACC 50×25×25mm,) and white-matter (left centrum semiovale (LCS) 50×19×27mm) dominant regions using Asp edited MEGA-PRESS (TE=90, 115, TR=2s). The spectra were fitting using prior data in VESPA analysis tool. Totally there were 29 healthy volunteers enrolled in the concentration estimation.
Results
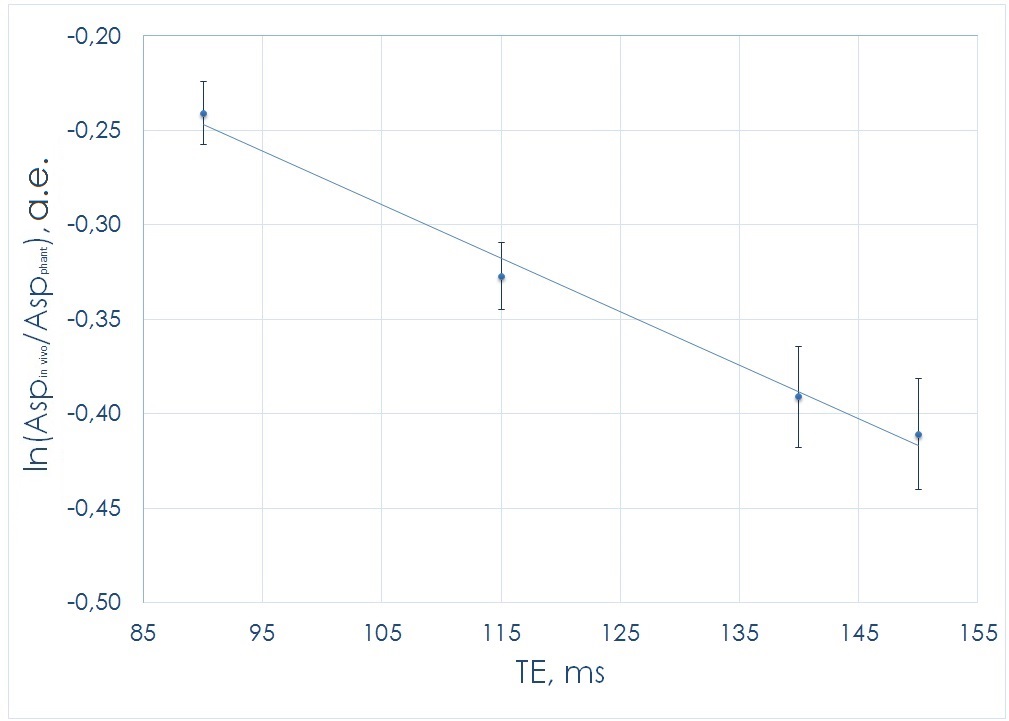
T2 values of aspartate and Creatine were quantified as follows: 303±35 and 327±27ms. According to expression (fig.1) significant linear regression (R2=0.97, p<.01) were found (fig.3.). Where, in vivo T2 of Asp were quantified as 169±33 ms.Asp concentrations in gray matter (GM)- and white matter (WM)-dominant brain regions were measured as 2.78±0.21 mM and 1.04±0.16 mM, respectively.Discussion&Conclusion
For the first time, the T2 value for the Asp –CH2 resonance (δ=2.71 ppm) was measured at 3 T in the present study and found to be 161±33 ms. This value is within the error of previous T2 values quantified with the JPRESS pulse sequence, i.e., 131±31 ms3 at the same location. In contrast to this study, in which T2 relaxation was estimated for all “Asp moieties”, in our study, we measured the T2 of only the –CH2 resonance of Asp, which can explain the difference between these measured values. Currently, MEGA-PRESS is the most frequently used editing technique. Thus, the T2 values of edited Asp resonance measured in recent studies are very important for the absolute quantification of Asp concentrations. It is important to note that the proposed T2 measurement can also be used for other strongly J-coupled signals.
The cortical GM Asp concentration coincides with the cerebral concentration measured in the rat cortex4 with short-TE STEAM at 9.4T (2.72±0.19 vs 2.43±0.14). The value for the CS is in good agreement with those measured with HERMES2, for which T2 was set as 270 ms (1.05±0.15 vs 0.88 ± 0.17 mM). Our results provide strong evidence that the in vivo brain Asp concentration is significantly higher in cortical GM than in WM. Some previous studies have suggested that Asp, along with Glu, acts as an excitatory neurotransmitter in the human central nervous system and therefore accumulates in synaptic vesicles. For Glu and for the major inhibitory neurotransmitter GABA, the same trend was previously reported, with higher concentrations in GM than WM. However, recent studies5 have negated Asp as a neurotransmitter. Thus, it is likely that Asp levels are higher in GM than in WM because GM contains more neuronal cell bodies and thus contains more mitochondria. In conclusion it is nessesary to say that estimation of the absolute Asp concentrations with Asp editing MEGA-PRESS has potential in many research applications, such as studying the processes underlying the reduction of N‐acetyl aspartate as well as studying some mithohondrial diseases.
Acknowledgements
$$$This work is funded by RFBR Grant 17-04-01149 A and RSF Grant 18-13-00030
References
[1] P. Menshchikov, T. Akhadov, N. Semenova. Magn Reson Mater Phy 2017; 27:5499
[2] K. Chan, M. Saleh et al NeuroImage 2017;155: 587–593
[3] Wyss PO, Bianchini C, Scheidegger M, et al. Magn Reson Med. 2018; 80(2): 452-461.
[4] Harris JL, Yeh H, Choi I, et al. J Cereb Blood Flow Metab. 2012;32(12):2122-2134.
[5] Herring BE, Silm K, Edwards RH, Nicoll RA. J Neurosci. 2015;35(28):10168-10171.
Figures