4234
An in vivo proton magnetic resonance spectroscopy study with multi-echo-time technique for concurrent quantification and T2 measurement of glutamate1The Catholic University of Korea, Seoul, Korea, Republic of, 2Gachon University, Incheon, Korea, Republic of, 3Asan Medical Center, Seoul, Korea, Republic of
Synopsis
The purpose of the study was to propose a multiple-echo-time (TE) in vivo proton magnetic resonance spectroscopy (MRS) for a concurrent quantification and T2 measurement of glutamate. Point-resolved spectroscopy with eight TE values was used. The validity of selected TEs for T2 estimation of glutamate was verified by the spectral analysis. Comparison results showed that the reliability of the proposed method was comparable to that of typically used MRS techniques for quantification and T2 estimation, respectively. The proposed method can concurrently measure concentration and T2 of glutamate and effectively investigate brain metabolism and microenvironment in an acceptable scan time.
Purpose
As a tool for investigating brain metabolism, the value of in vivo proton magnetic resonance spectroscopy (1H MRS) has been increasing with application of high-field MRS. In addition, the use of a short-echo-time (TE) can improve the reliability of the quantification by reducing the effects of T2 relaxation and J-coupling. These synergistic advantages of high-field and short-TE MRS can be applied to optimize quantification of glutamate (Glu). Recently, in vivo 1H MRS has been extendedly applied for investigation of the brain microenvironment. Changes in the T2 relaxation time of the specific metabolites, measured by in vivo 1H MRS, might indicate the microenvironmental changes in brain tissue. However, typical T2 measurement using MRS involves long scan times, and repetitive MRS scans for quantification and T2 measurement are ineffective. In this study, we propose the concept of a multiple-TE (mTE) in vivo 1H MRS for the concurrent measurement of concentration and T2 relaxation time of Glu.Methods
All the MRI/MRS scans of five Sprague–Dawley rats were performed using a Bruker PharmaScan® 7T MRI system. Multislice axial/sagittal T2-weighted images were acquired using RARE sequence. An MRS voxel of 22.5 μL was located in the prefrontal cortex. An automated shimming with the FASTMAP was performed to maintain an water linewidth to 10–13 Hz. In vivo 1H MRS scans were performed using a point-resolved spectroscopy (PRESS) sequence with the following methods: (1) the typical short-TE MRS for quantification (Quant), (2) typical T2 measurement (T2-measurement), and mTE. All schemes of MRI/MRS scans were addressed in Table 1. Quantifications were performed using the LCModel software with simulated basis-sets using the VeSPA software. The mono-exponential curve-fitting tools with the Trust-Region algorithm in the MATLAB software was used to estimate T2 of the metabolites, and the CRLB and R2 value was used as a reference. To verify that the TEs of the mTE were valid for T2 measurement of Glu, spectral analysis of the pseudo-triplet of the Glu-C4 was performed. To verify the feasibility of the mTE, the concentration and CRLB value of the metabolites obtained by the Quant and mTE, and the T2 of the metabolites and R2 value of the T2-measurement and mTE were compared.Results
Figure 1 illustrates multislice T2-weighted MRI scans. Figure 2 illustrates in vivo 1H MRS obtained with (a) the Quant and (b) mTE using PRESS with a TE of 16.3 ms, and the concentration and CRLB value are listed in Table 2. The concentration of the mTE was not significantly different from that of the Quant (p > 0.05). In vivo 1H MRS of (a) the mTE and (b) T2-measurement are illustrated in Figure 3, and the T2 relaxation time and R2 values of the major metabolites are listed in Table 3. The scan time of the Quant was about 40 min, while that of the mTE was about 2 hours, which was shorter than that of the T2-measurement. The Glu spectra of (a) the simulation and (b) mTE are illustrated in Figure 4, and the relative area ratio index of the upfield/downfield outer-wings to the central peak of the pseudo-triplet of the Glu-C4 are listed in Table 4.Discussion and Conlcusion
The metabolite concentrations of the mTE were not significantly different from the Quant and the mean CRLB value of the mTE was still in a reliable range. Thus, the quantification reliability of the mTE was comparable with that of typically used high-field and short-TE MRS. The T2 relaxation time of Glu, tNAA and tCr was consistent between the two methods, and the CRLB and R2 values were improved in the mTE compared to the T2-measurement. Although some discrepancies, the mTE might be used for the reliable T2 estimation of tNAA, tCr, and Glu, and thus can be used to investigate microenvironmental changes in localized brain tissues. As shown in the spectral analysis, the typical antiphase patterns of the outer bands were observed in the main resonance of Glu (2.34 ppm) and the CRLB values increased to about 20% at TE of 40–80 ms (TE ~ 1/2J). These antiphase patterns at the resonance of Glu were rephased at TE of 110–130 ms (TE ~ 1/J), and the CRLB value was decreased to about 10%. Considering the fluctuating patterns of the CRLB with TE and J-modulation, the selected TEs of the mTE could be considered as reliable for T2 estimation of Glu. The validations showed that high-field in vivo 1H MRS with our method can be used for effective measurement of concentration and T2 of Glu to investigate the physiology of brain metabolism and microenvironment and its disease-related changes.Acknowledgements
This work was supported by the National Research Foundation of Korea Grant funded by the Korean Government (2018R1A2B2005343), and the Brain Research Program through the National Research Foundation of Korea (NRF) funded by the Ministry of Science and ICT & Future Planning (2017M3C7A1043838). In addition, we thank the Magnetic Resonance Core facility at the convergence medicine research center (CREDIT), Asan Medical Center for support and instrumentation (or name of technical service).References
1. Rosen Y, Lenkinski RE. Recent Advances in Magnetic Resonance Neurospectroscopy. Neurotherapeutics. 2007;4(3):330-345. doi:10.1016/j.nurt.2007.04.009
2. Trattnig S, Bogner W, Gruber S, et al. Clinical applications at ultrahigh field (7 T). Where does it make the difference? NMR Biomed. 2016. doi:10.1002/nbm.3272
3. Choi C, Dimitrov IE, Douglas D, et al. Improvement of resolution for brain coupled metabolites by optimized 1H MRS at 7T. NMR Biomed. 2010. doi:10.1002/nbm.1529
4. Bartha R, Drost DJ, Williamson PC. Factors affecting the quantification of short echo in-vivo1H MR spectra: Prior knowledge, peak elimination, and filtering. NMR Biomed. 1999;12(4):205-216. doi:10.1002/(SICI)1099-1492(199906)12:4<205::AID-NBM558>3.0.CO;2-1
5. Tkáč I, Starčuk Z, Choi IY, Gruetter R. In vivo 1H NMR spectroscopy of rat brain at 1 ms echo time. Magn Reson Med. 1999;41(4):649-656. doi:10.1002/(SICI)1522-2594(199904)41:4<649::AID-MRM2>3.0.CO;2-G
6. Xin L, Gambarota G, Mlynarik V, Gruetter R. Proton T2 relaxation time of J-coupled cerebral metabolites in rat brain at 9.4 T. NMR Biomed. 2008. doi:10.1002/nbm
7. Provencher SW. LCModel & LCMgui User’s Manual. http://s-provencher.com/pub/LCModel/manual/manual.pdf.
8. Soher, B., Semanchuk, P., Young, K., Todd D. VeSPA-simulation user manual and reference. https://scion.duhs.duke.edu/vespa/.
9. Govindaraju V, Young K, Maudsley AA. Proton NMR chemical shifts and coupling constants for brain metabolites. NMR Biomed. 2000;13(3):129-153. doi:10.1002/1099-1492(200005)13:3<129::AID-NBM619>3.0.CO;2-V
Figures
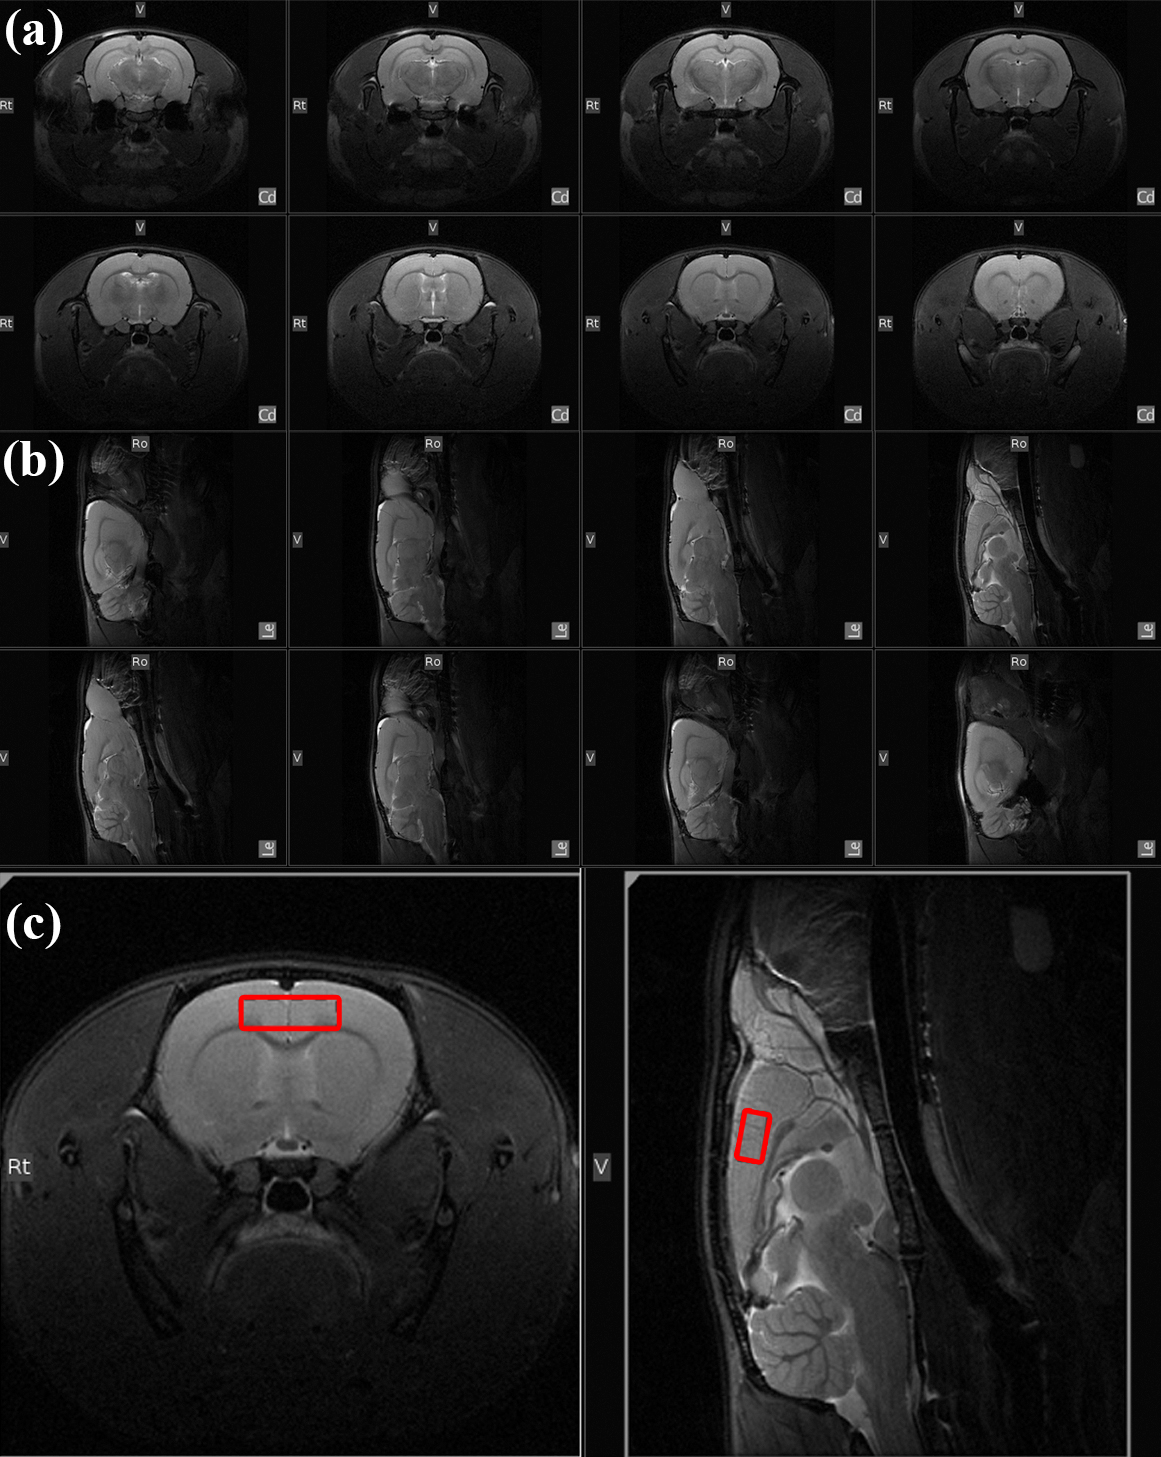
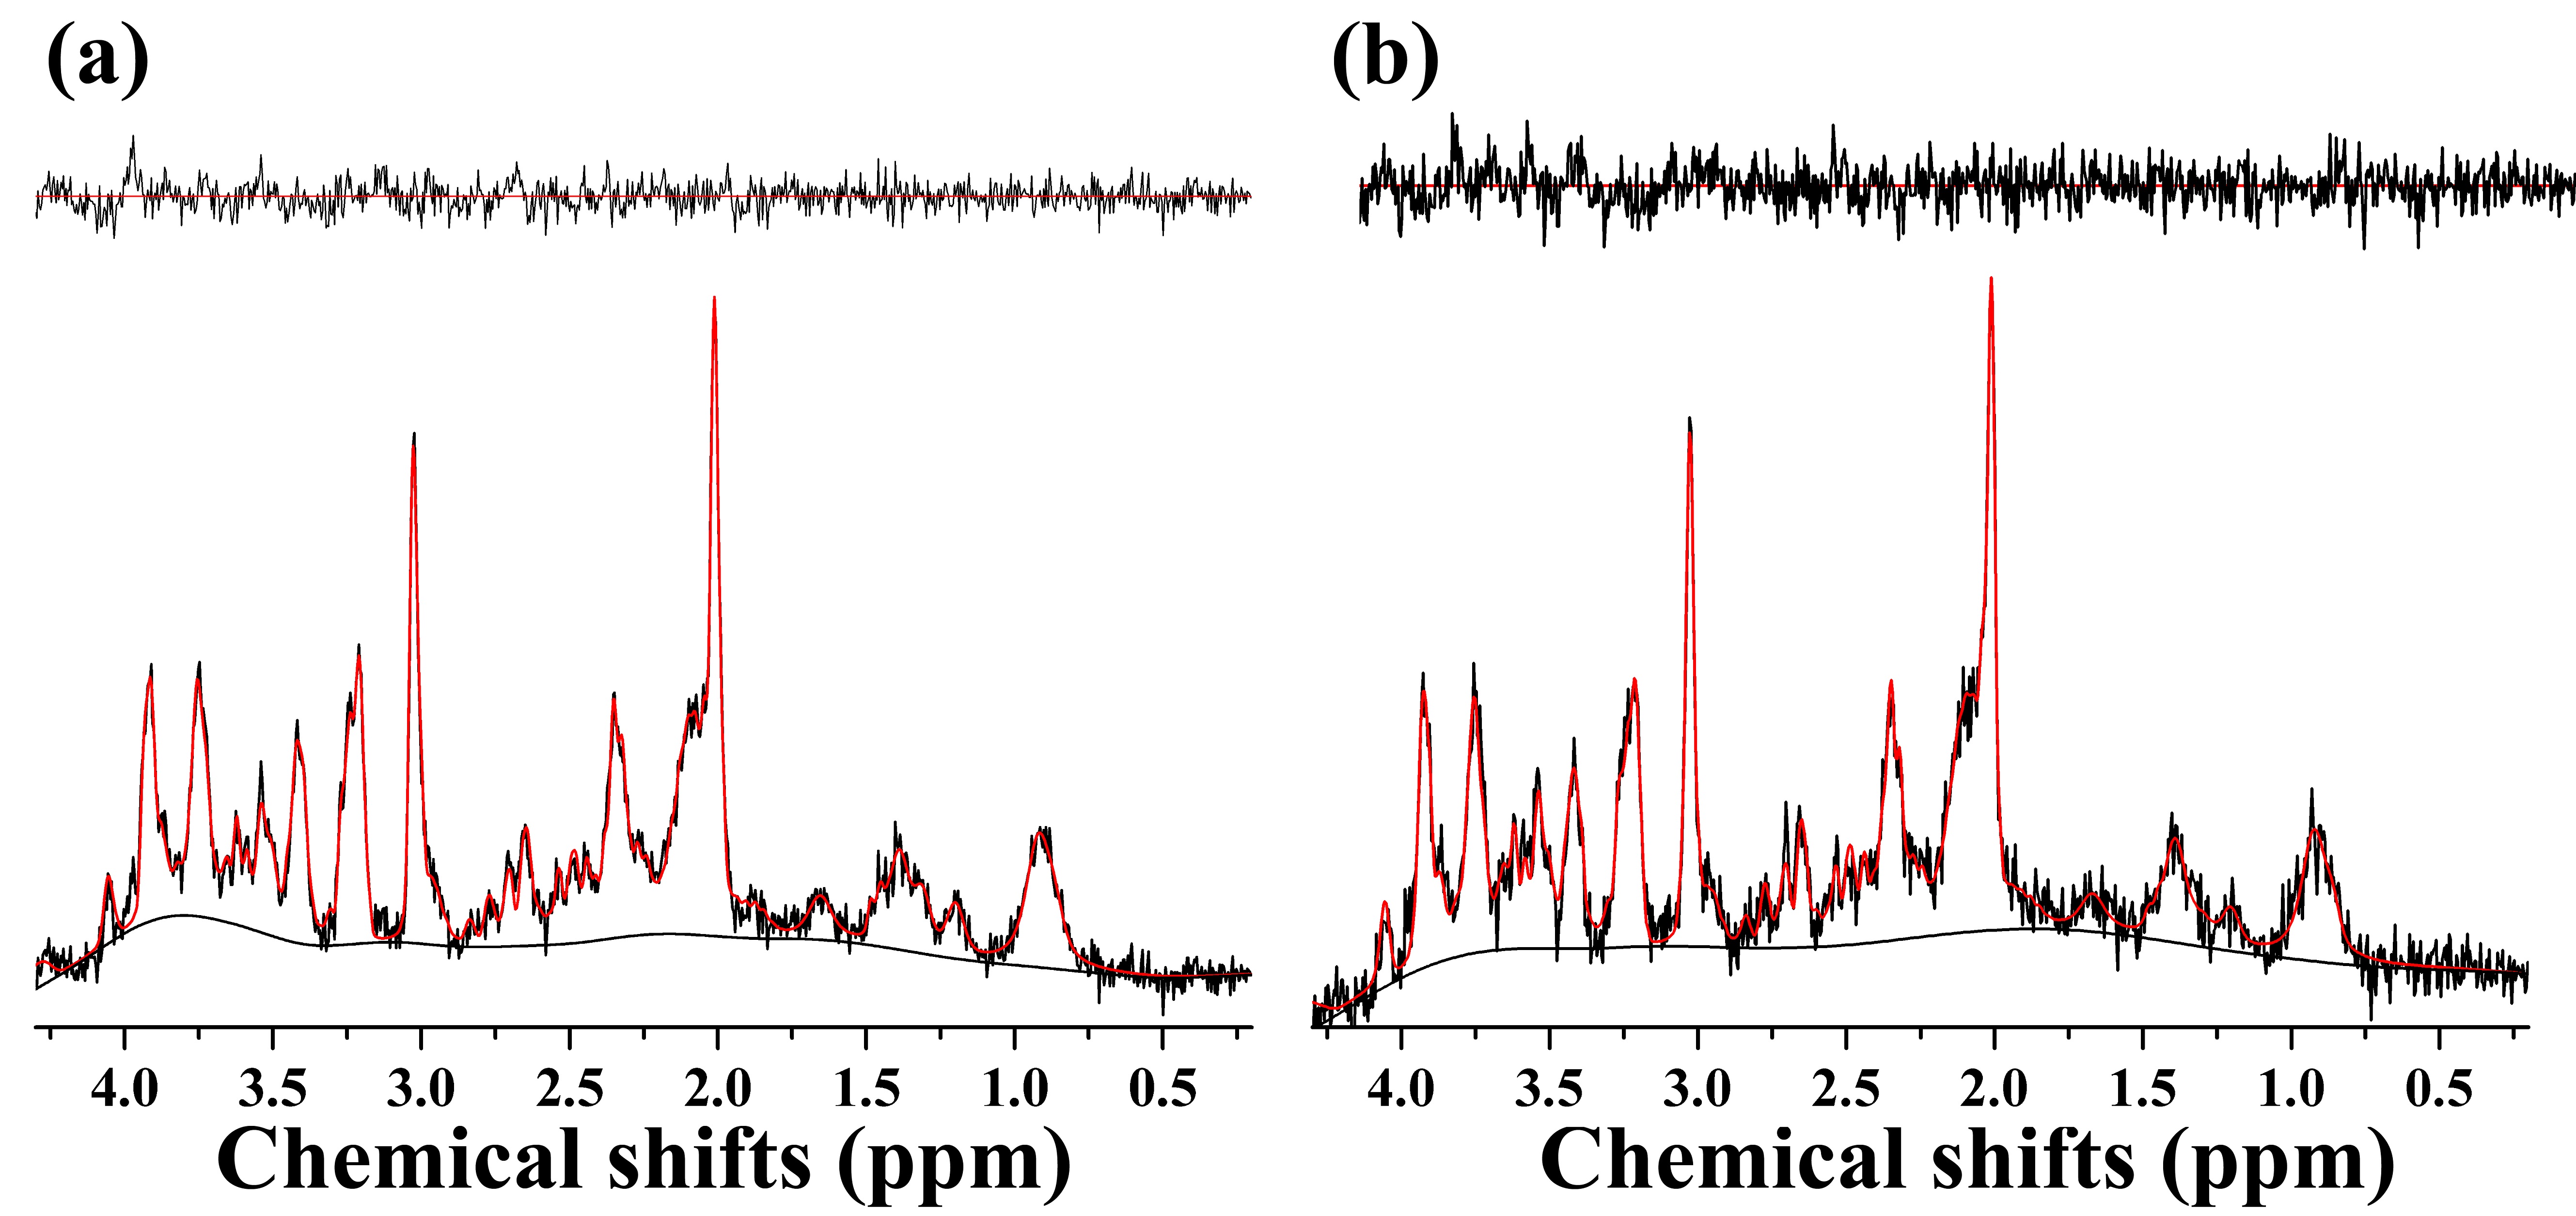
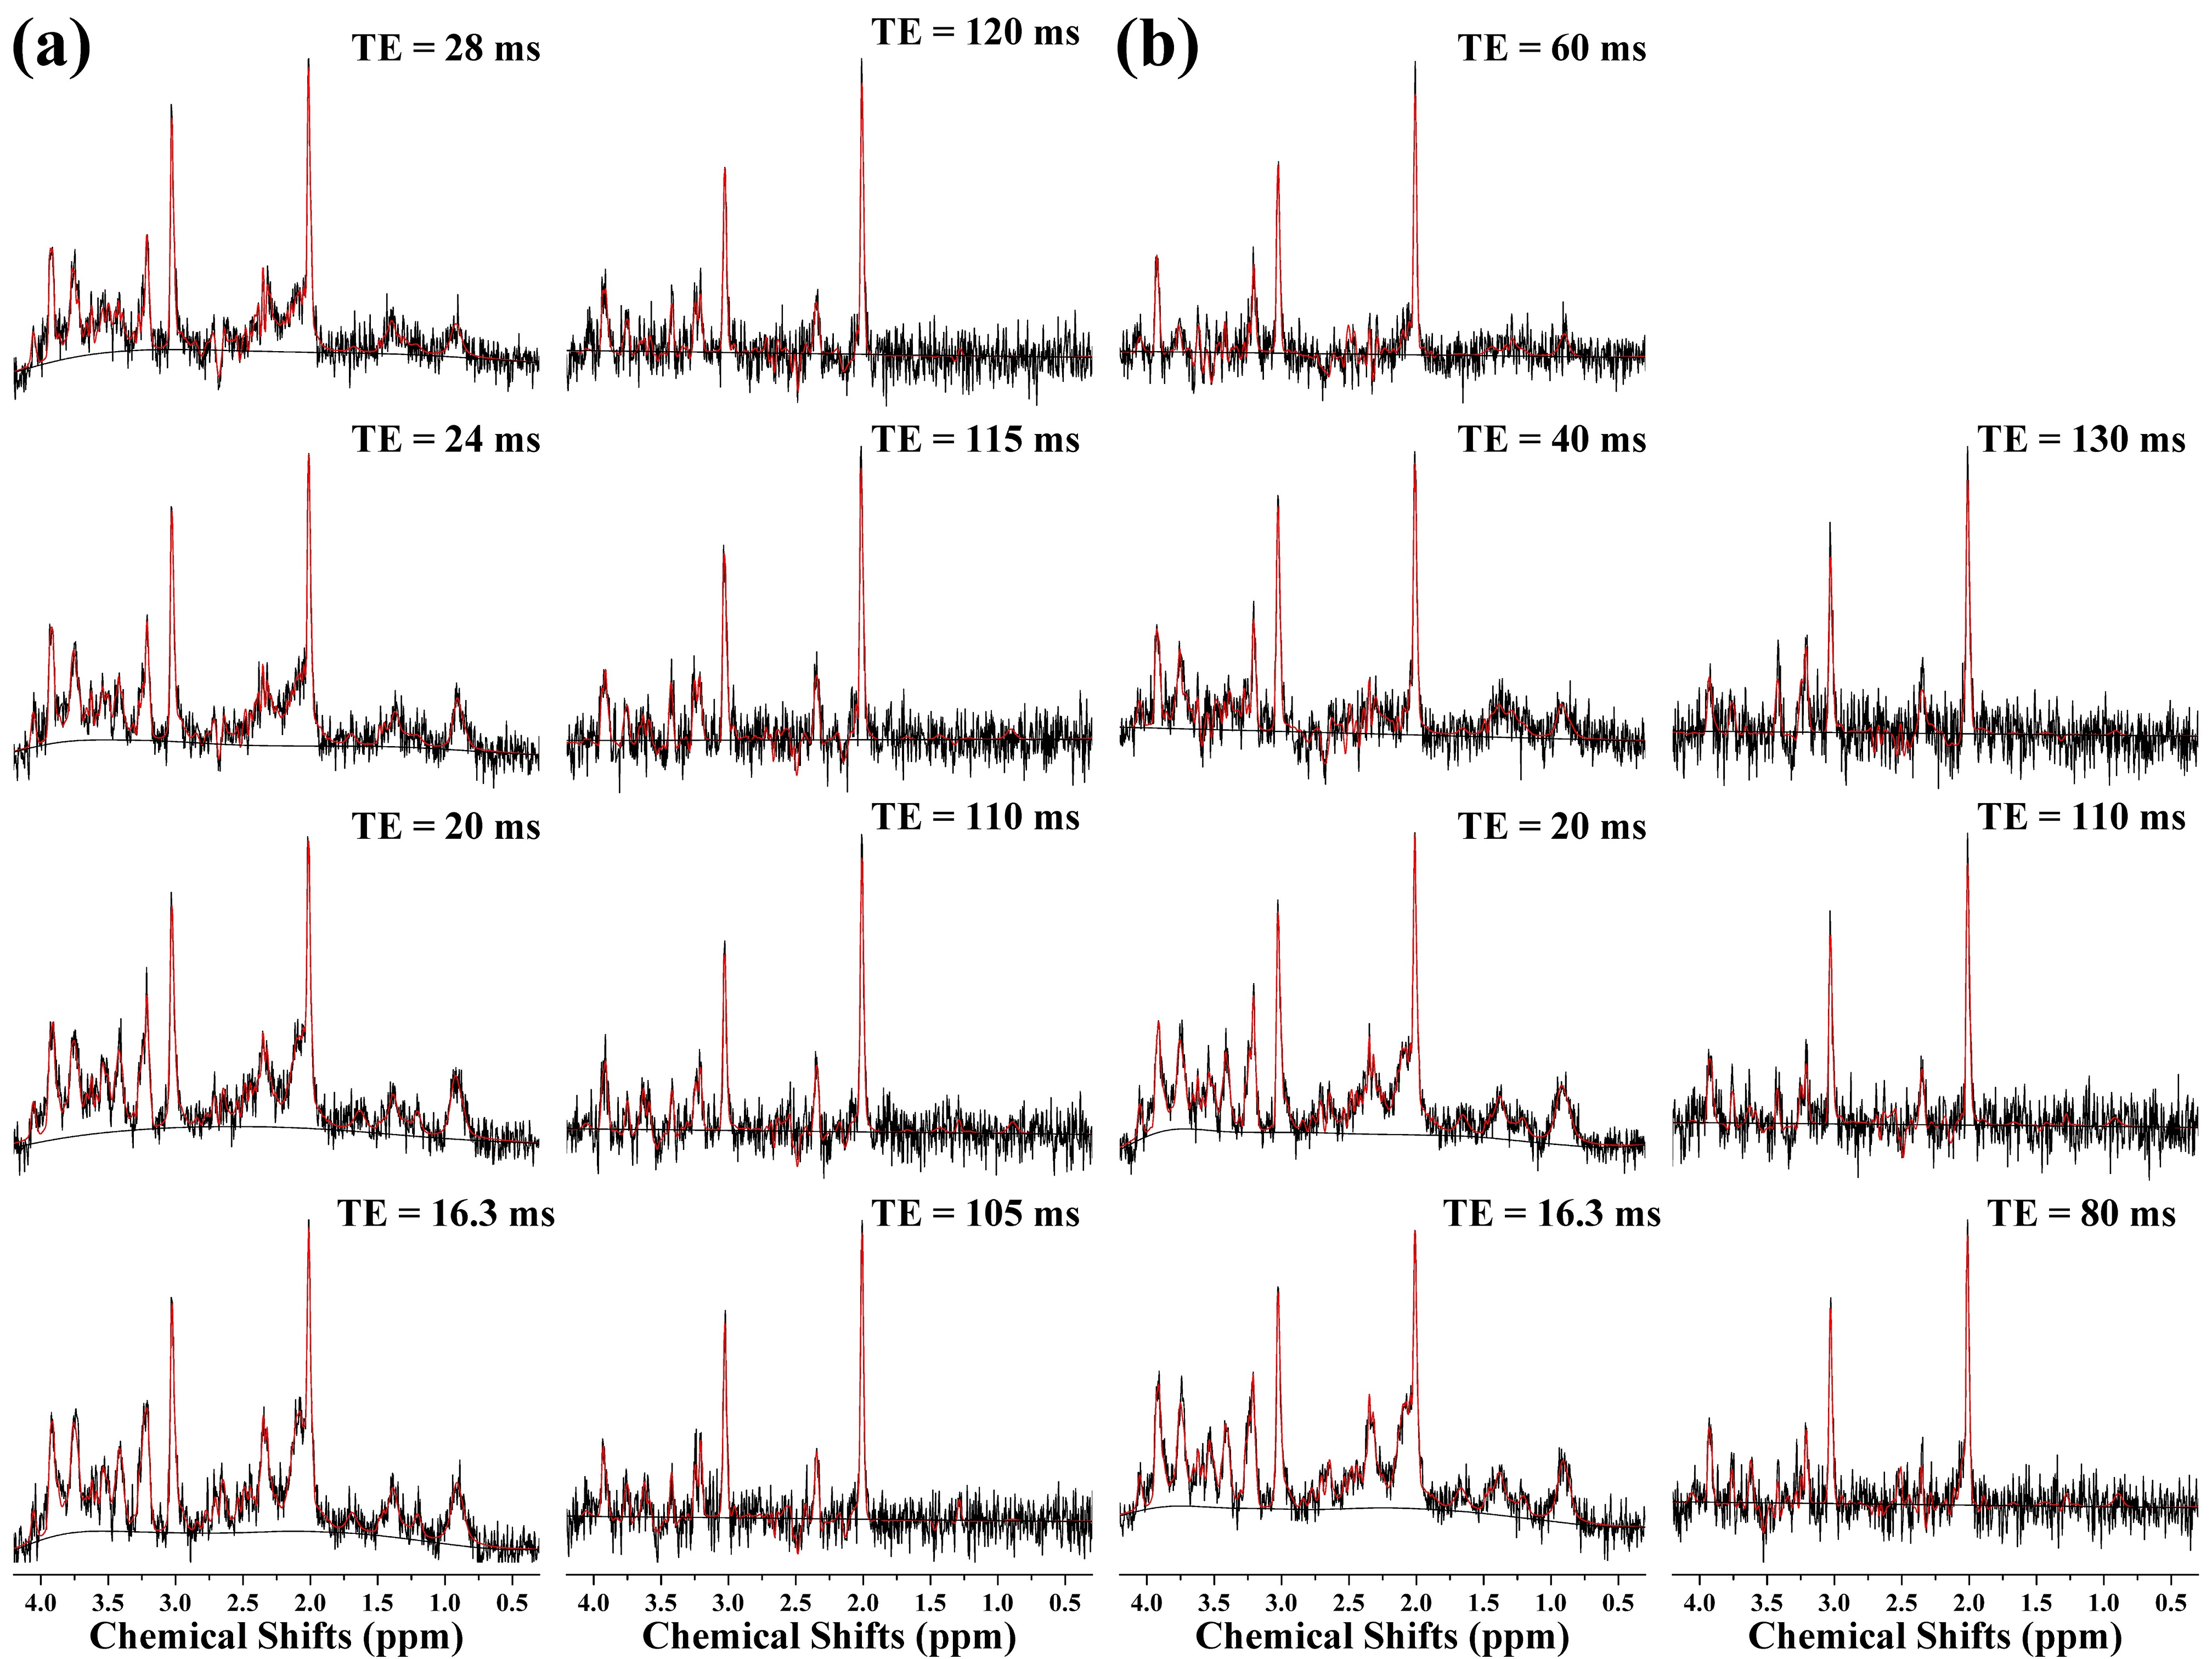
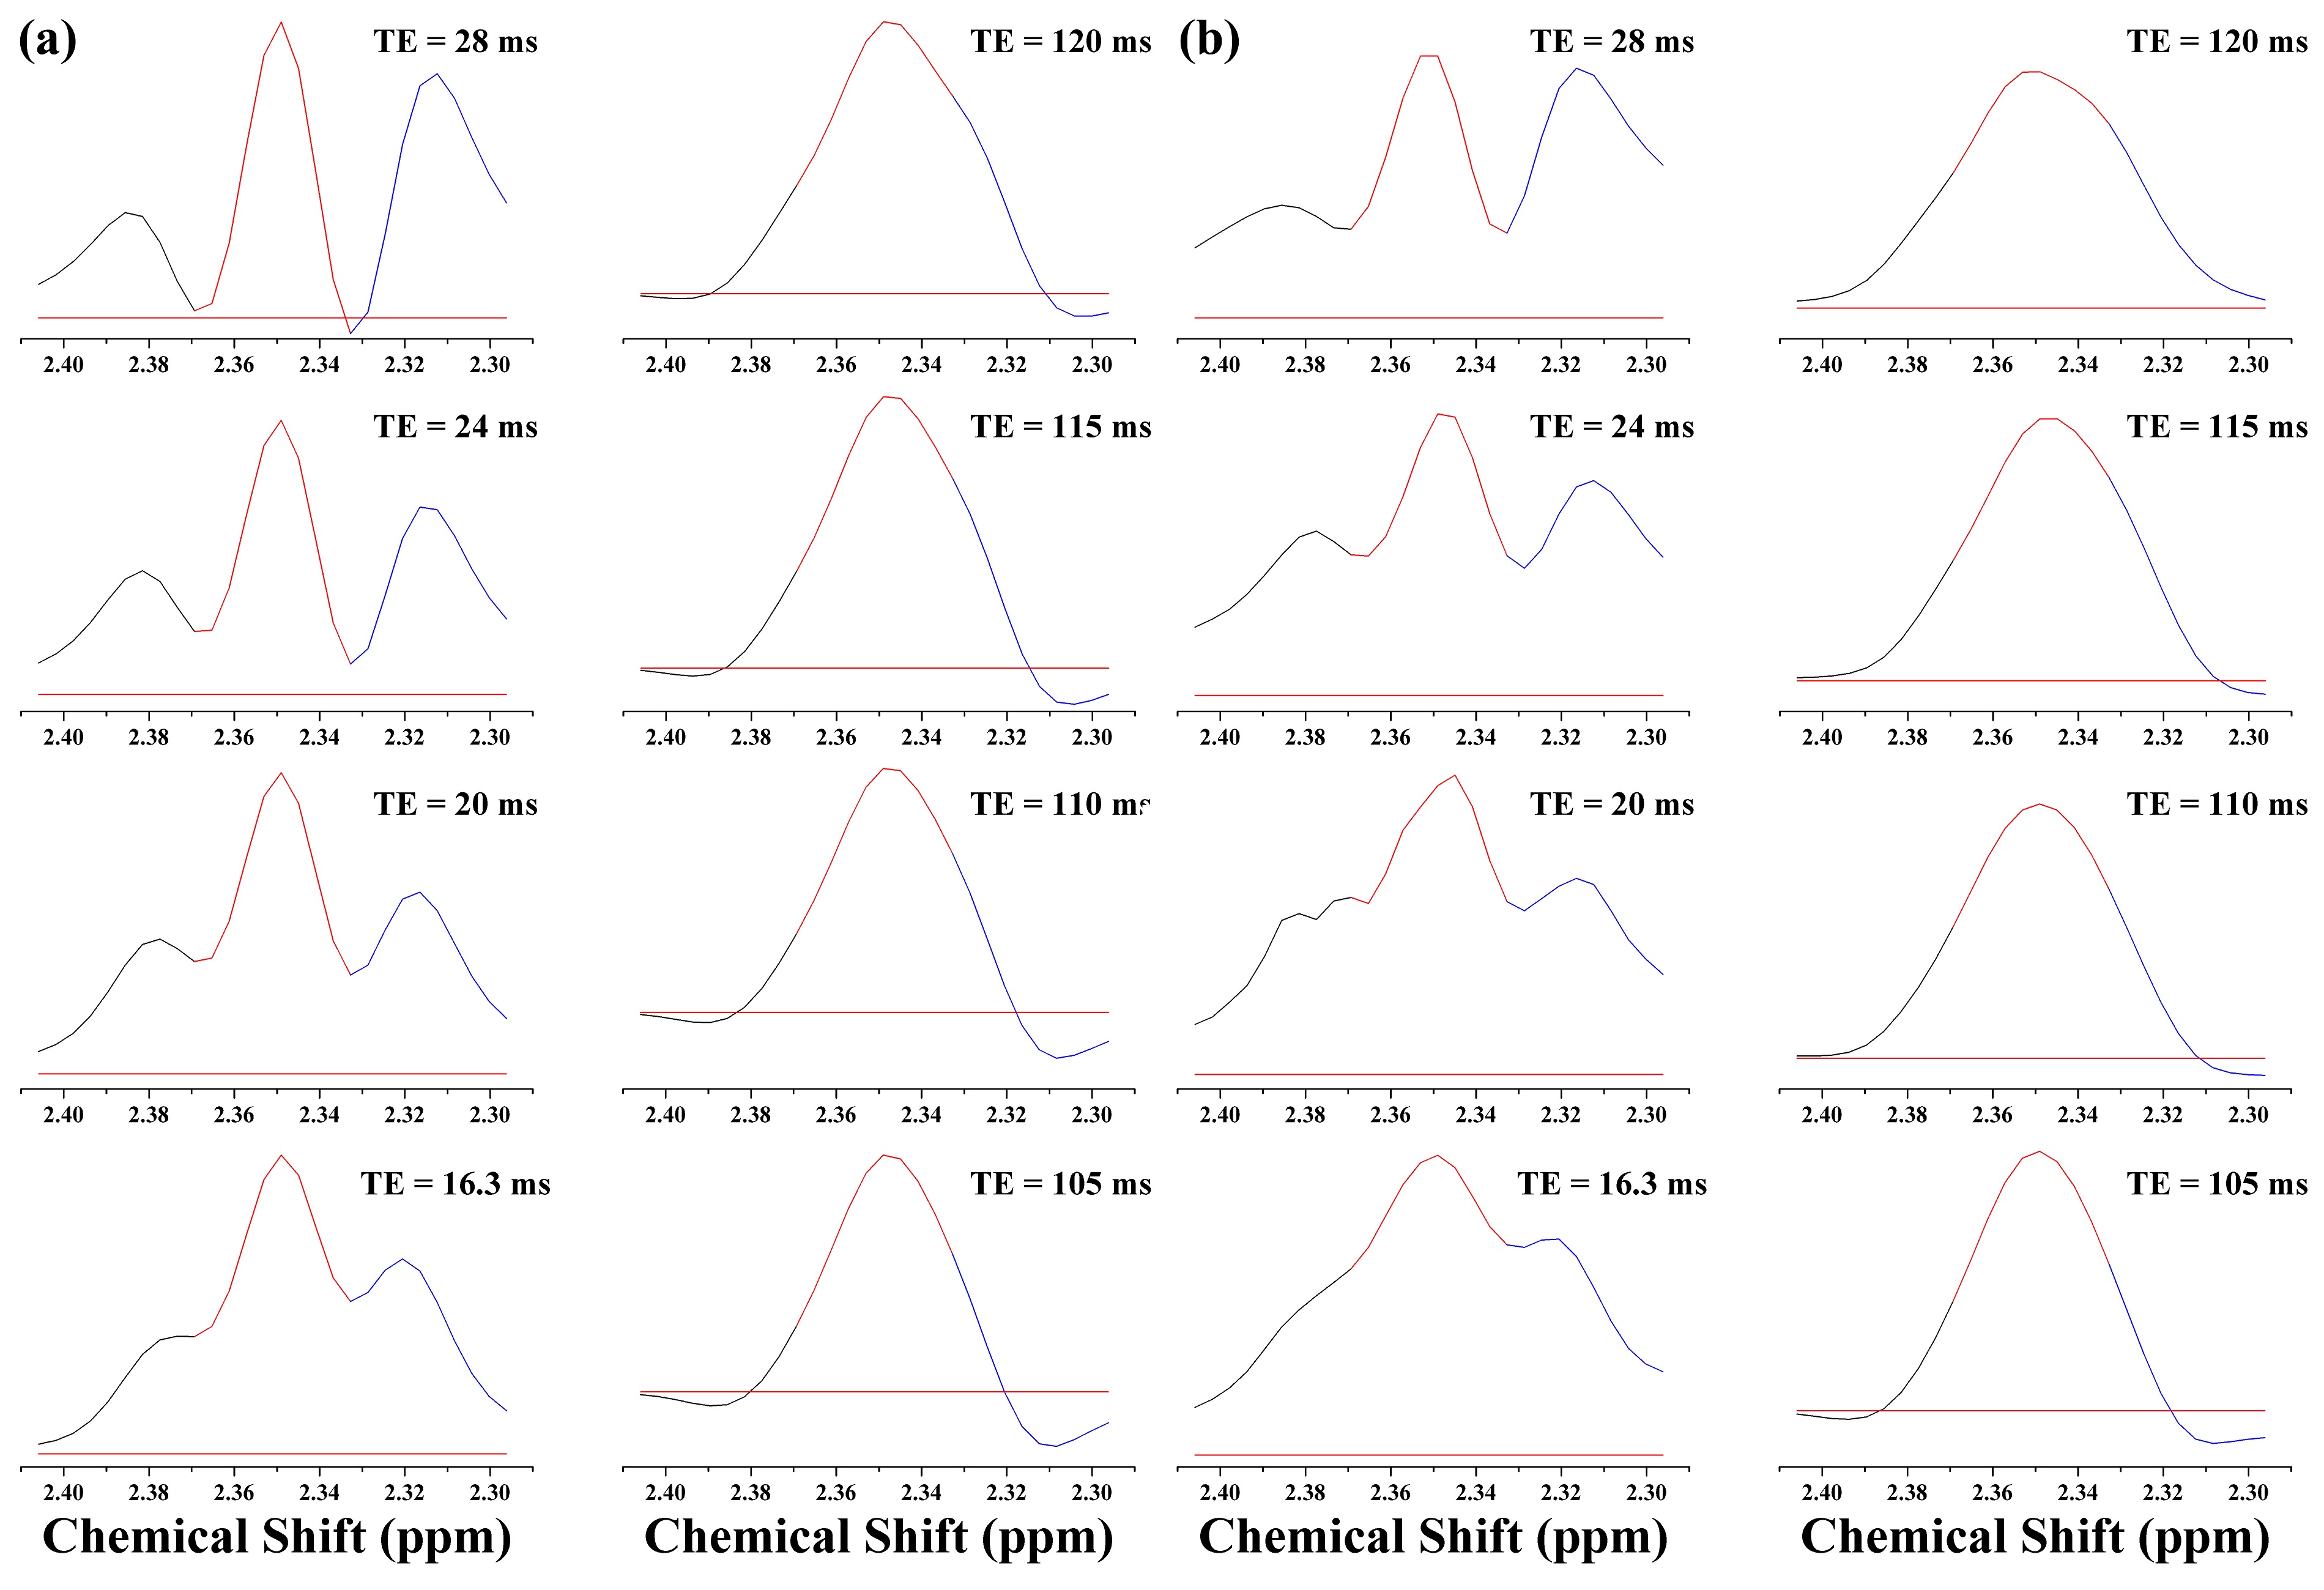
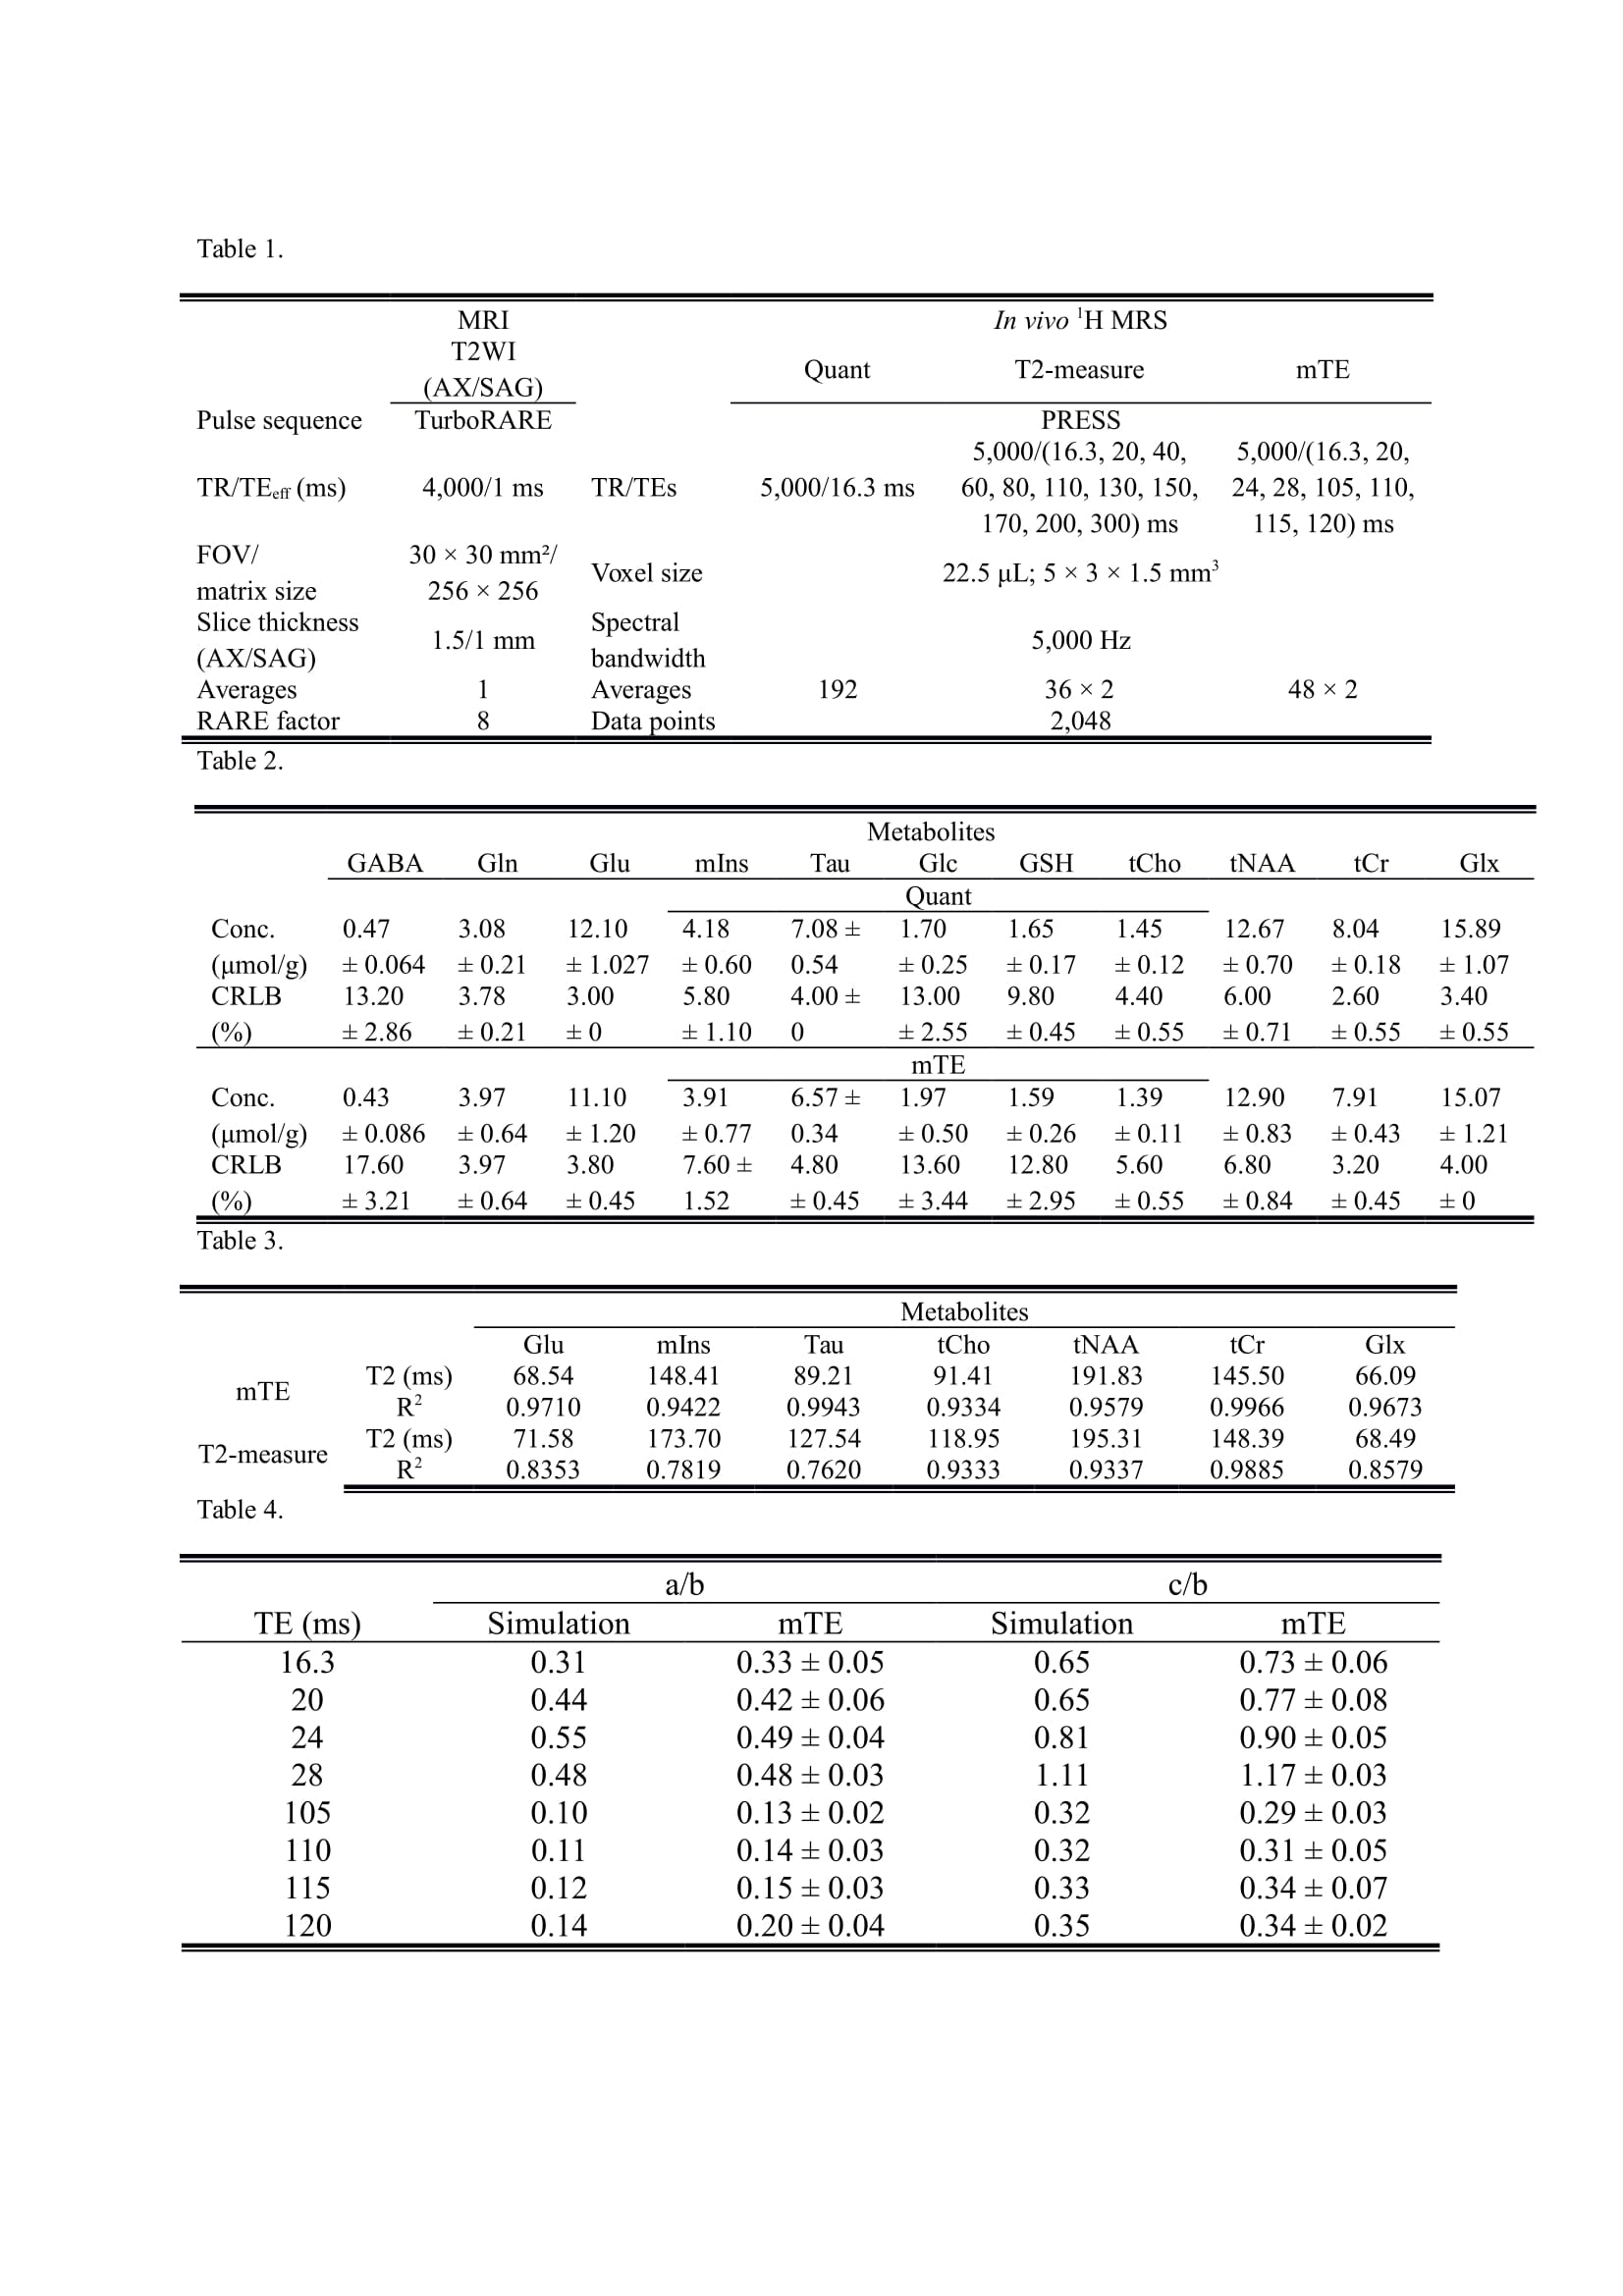
Table 1. Acquisition schemes of the MRI/MRS scans.
Table 2. The mean concentrations and CRLB values of the major metabolites measured using in vivo 1H MRS with (a) the Quant and (b) mTE (TE = 16.3 ms).
Table 3. The mean T2 relaxation time and R2 value of the major metabolites measured using in vivo 1H MRS with (a) the mTE and (b) T2-measurement.
Table 4. The relative area ratio of the upfield (a/b) and downfield outer-wings (c/b) to the central peak of the pseudo-triplet of the Glu-C4 obtained using the spectral simulation and mTE.