4231
Towards probing diffusion barriers for water and metabolites in skeletal muscle by MR spectroscopy using oscillating and pulsed diffusion gradients with a large range of diffusion times1Departments of Radiology and Biomedical Research, University Bern, Bern, Switzerland
Synopsis
Diffusion-weighted MR spectroscopy has recently been shown to help elucidate the microstructure of brain tissue and the use of oscillating gradients in MRI has provided the option to study local features on a smaller scale. Here, we aim at combining both techniques to investigate human skeletal muscle in vivo on a clinical scanner. Oscillating and pulsed gradient schemes with a large range of diffusion times were applied with otherwise identical acquisition settings. Initial results are shown, but also the challenges faced for muscle where physiologic pulsation and gradient-related artifacts may be prominent.
Introduction
Diffusion-weighted (DW) MR sequences are widely used in clinical MRI and dedicated diffusion sequences yield information on the microstructure of tissue. Most studies make use of DW MRI, but DW-MR spectroscopy (MRS) – in spite of the SNR disadvantage – can yield further insight because it provides cell-specific information that is not confounded by intra/extracellular exchange1. Besides some work with 31P MRS2 only very few studies have probed the microstructure of (human) skeletal muscle by DW-MRS3. Some work has focused on the lipid signals4-6, but only one investigation has looked into spatial diffusion anisotropy of metabolites by 1H-MRS7. Even DW-MRI studies with a focus on muscle microstructure are scarce but recent work8 has nicely investigated the dependence of the diffusion behavior as function of diffusion time (TD = Δ-δ/3) and drawn conclusions on diffusion barriers and membrane permeability: at TD>30 ms, the major diffusion barriers are likely to represent cell membranes, while intracellular obstacles do not contribute to changes in ADCs as function of characteristic TDs. In this work, we start extending such analysis to shorter TDs by moving to oscillating gradients and to investigations of time-dependent diffusion for muscle metabolites making use of a simultaneous investigation of metabolites and water using a metabolite-cycling (MC) semiLaser localization method combined with pulsed and oscillating diffusion-weighting gradients9-10.Methods
Acquisition: Siemens Prisma 3T (maximum gradients of 80 mT/m); multichannel transmit/receive extremity coil; in vitro tests using "braino" phantom (GE medical), in vivo data from 4 human subjects with ROI in tibialis anterior muscle (ROI size of 11-14 [cm3]) with leg parallel to B0. DW spectra acquired with a semiLaser localization sequence extended by optional diffusion weighting elements either in the form of pulsed trapezoidal gradients or oscillating gradient11 shapes placed on both sides of the last adiabatic refocusing pulse as illustrated in Fig. 1; sequence details and brain applications presented elsewhere10; in vivo spectra recorded with a repetition time of 2.5 s and a long echo time (TE) of 170 ms to accommodate enough diffusion weighting ($$$b_{max}$$$ of $$$\sim$$$ 800 s/mm2 at TD 7.5 ms) for the case of oscillating gradients. For pulsed gradients, the same TE was used with modified TD (39-139 ms). At long TE, no water suppression is needed. Diffusion-weighting gradients were applied approximately along (z) and perpendicular (x,y) to the muscle fibers.
Data processing and fitting: Spectra processed in jmrui12 and matlab. Simultaneous fitting of the whole dataset from each volunteer performed in FiTAID13 making use of lineshape information taken from the isolated water peak in each spectrum, where the water peak had been parameterized as a superposition of 25 arbitrary Voigt lines spaced by 2-5 Hz. Spectra were modeled to fit resonances from water, IMCL, EMCL, creatines, and taurine (no choline signals visible at this TE). To correct for motion/vibration-based signal attenuation, the IMCL amplitude from each spectrum was used as scaling reference. IMCL doesn’t show any appreciable diffusion attenuation5 or temporal change during the scans, while the EMCL signal can readily change with slight patient motion.
Results
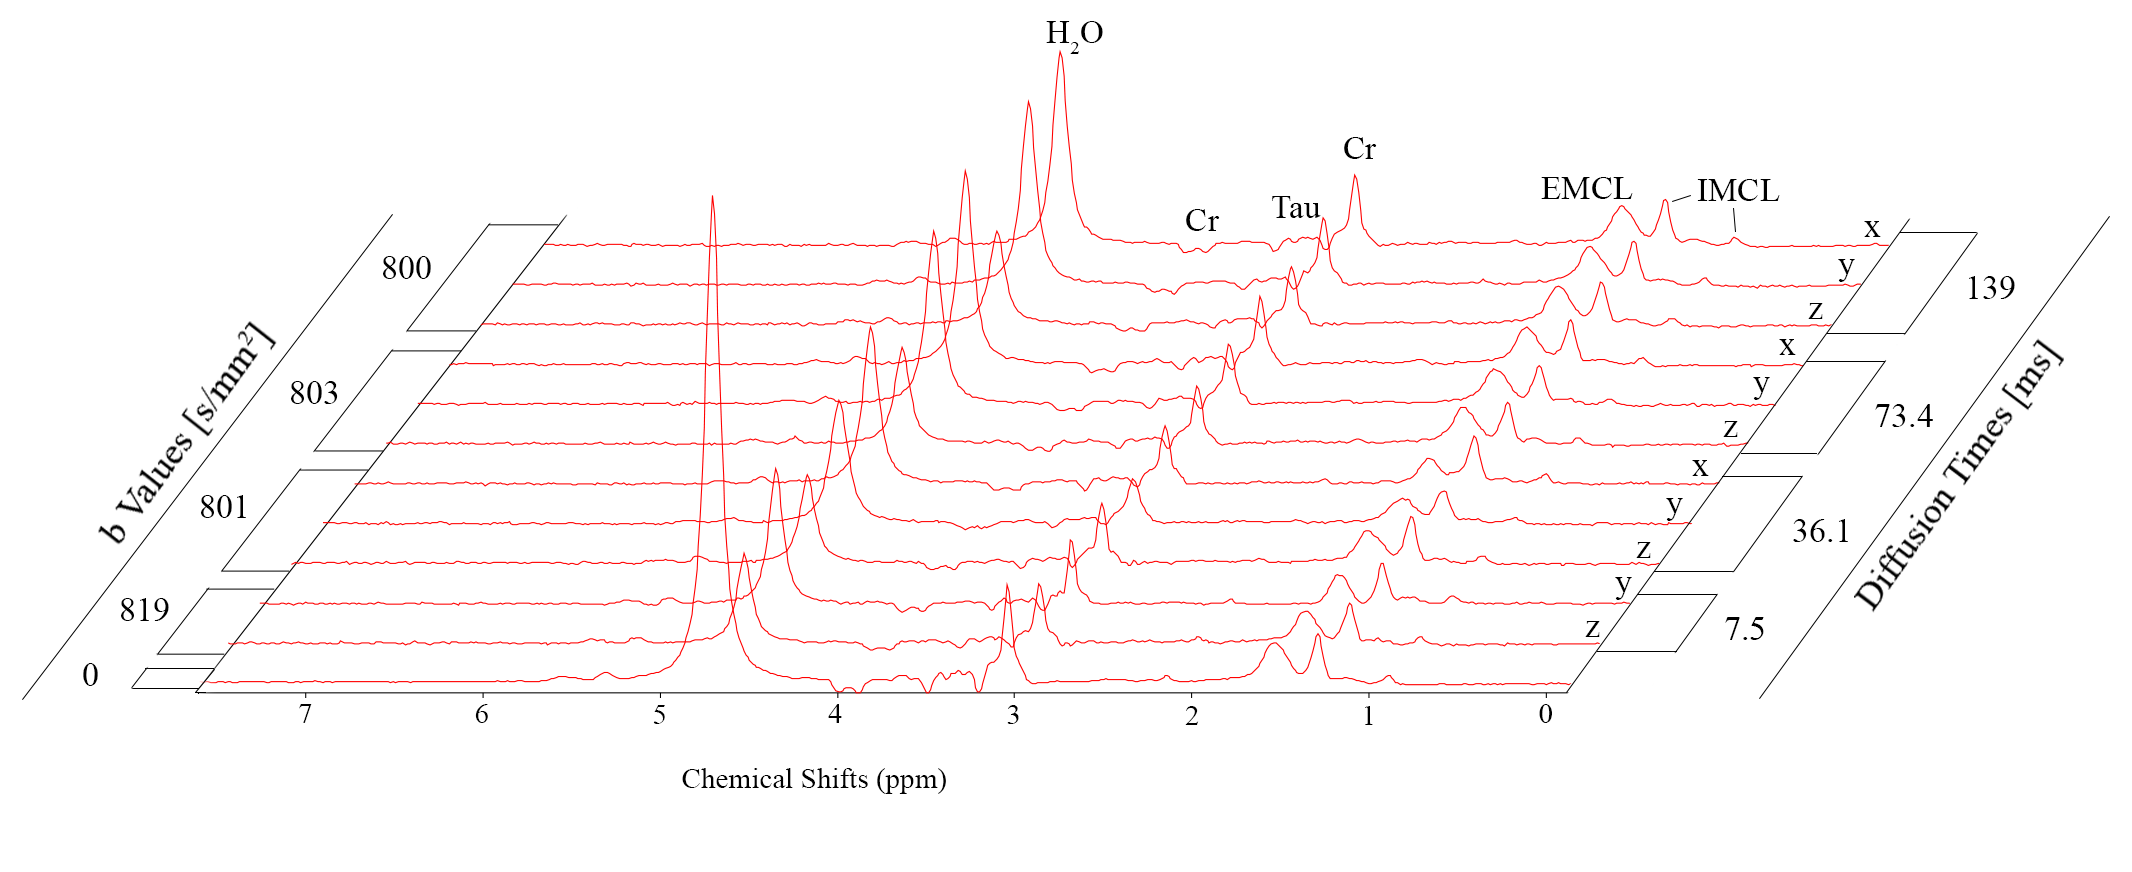
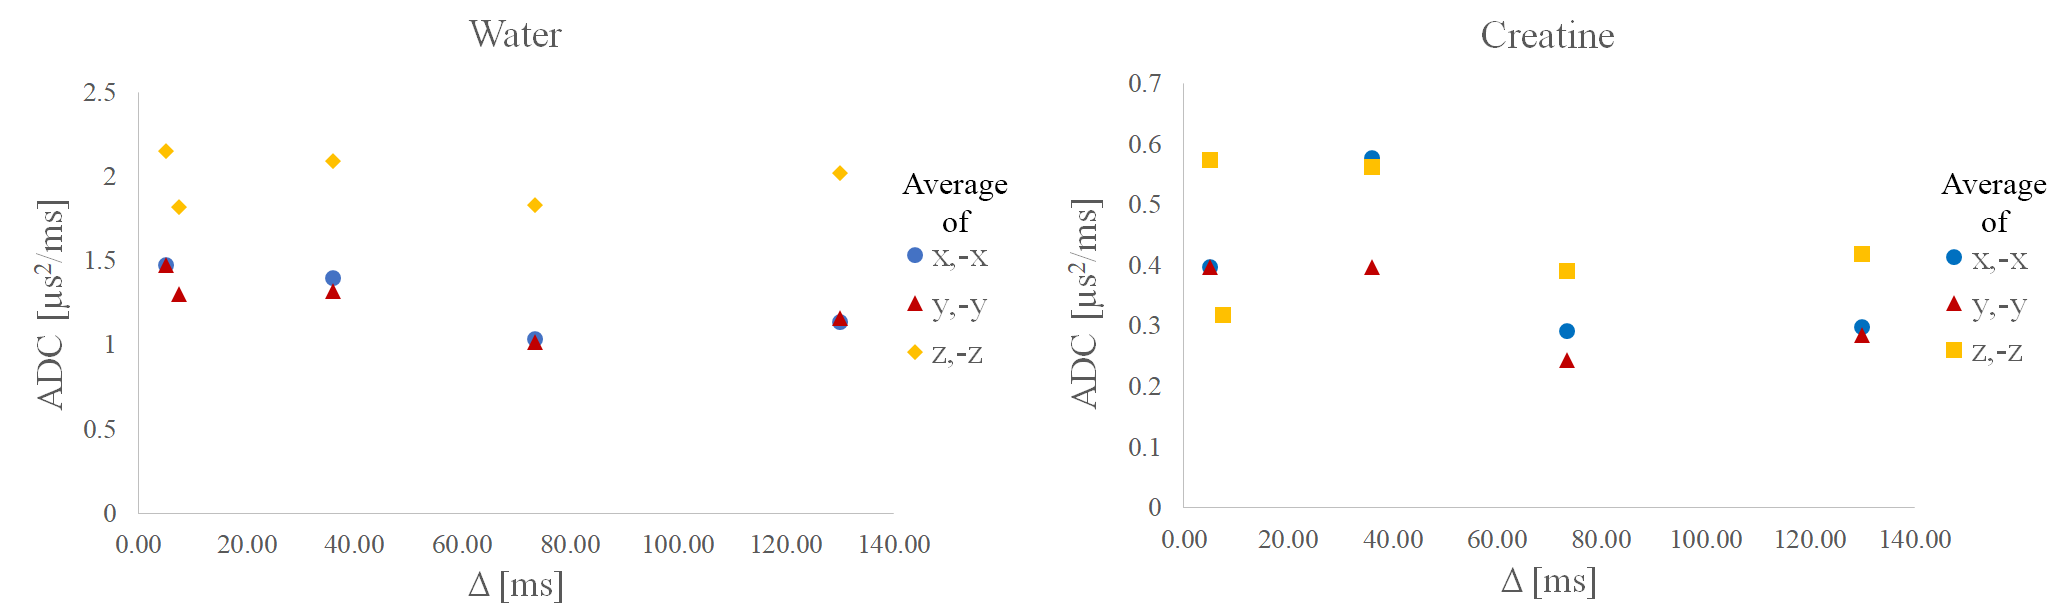
Fig. 2 documents good spectral quality in exemplary spectra for $$$b=$$$ 0 and $$$b\simeq$$$ 800 s/mm^2 for pulsed as well as oscillating gradients. Fig. 3 shows that eddy currents create lineshape distortions and possibly signal attenuation that depend on gradient direction and that these effects can only partially be compensated with eddy-current correction based on the fitted water signal (or by inclusion in the fit model). Fig. 4 documents signal attenuation as function of TD and gradient direction for one case. Signal attenuation is obvious for all metabolites and stronger for diffusion along the fibers than in perpendicular direction, but the influence of TD is not very strong even for very short TD. This is also documented by the evaluated ADCs calculated for this dataset (Fig. 5).Discussion
Spectra recorded with oscillating gradients are of high quality, while for the pulsed gradients the sequence still needs tuning to reduce eddy current effects. The fitted water signal can be used for lineshape reference, while IMCL as internal standard is needed to correct for signal fluctuation due to gradient-effects and subject motion. A slight decrease in ADCs with TDis observed and for water in line with expectation8, but needs corroboration in more subjects, and with stronger diffusion-weighting for metabolites. For water, ADCs at very short TDs have not been reported previously and for metabolites, diffusion behavior as function of TD is also unexplored and depends on diffusivity across myofibrillar proteins.Acknowledgements
This work is supported by the Swiss National Science Foundation (SNSF #320030‐175984).References
- Palombo et al. Insights into brain microstructure from in vivo DW-MRS. Neuroimage 182:97 (2017).
- Gabr et al. High-energy phosphate transfer in human muscle: diffusion of phosphocreatine. Am J Physiol Cell Physiol 301:C234 ( 2011).
- Cao & Wu. In vivo diffusion MRS investigation of non-water molecules in biological tissues. NMR Biomed. 30:e3481 (2017).
- Lehnert et al. Diffusion characteristics of large molecules assessed by proton MRS on a whole-body MR system. Magn Reson Imaging 22:39( 2004).
- Brandejsky et al. Restricted or severely hindered diffusion of intramyocellular lipids in human skeletal muscle shown by in vivo proton MR spectroscopy. Magn Reson Med 67:310 (2012).
- Cao,et al. Diffusion magnetic resonance monitors intramyocellular lipid droplet size in vivo. Magn Reson Med 73:59 (2015).
- Brandejsky et al. Proton diffusion tensor spectroscopy of metabolites in human muscle in vivo. Magn Reson Med 67:310 (2014).
- Fieremans. In vivo measurement of membrane permeability and myofiber size in human muscle using time-dependent diffusion tensor imaging and the random permeable barrier model. NMR Biomed. 30:e3612 (2017).
- Döring et al. Diffusion-weighted magnetic resonance spectroscopy boosted by simultaneously acquired water reference signals. Magn Reson Med 80:2326 (2018).
- Döring & Kreis. MRS extended by oscillating diffusion gradients as a probe for investigation of human brain tissue microstructure. 27th Annual Meeting of ISMRM, submitted (2019).
- Ligneul & Valette. Probing metabolite diffusion at ultra-short time scales in the mouse brain using optimized oscillating gradients and "short"-echo-time diffusion-weighted MRS. NMR Biomed 30:e3671 (2017).
- Stefan et al. Quantitation of magnetic resonance spectroscopy signals: the jMRUI software package. Measurement Science & Technology 20:104035 (2009)
- Adalid et al. Fitting interrelated datasets: metabolite diffusion and general lineshapes. Magn Reson Mater Phy 30:429 (2017).
Figures
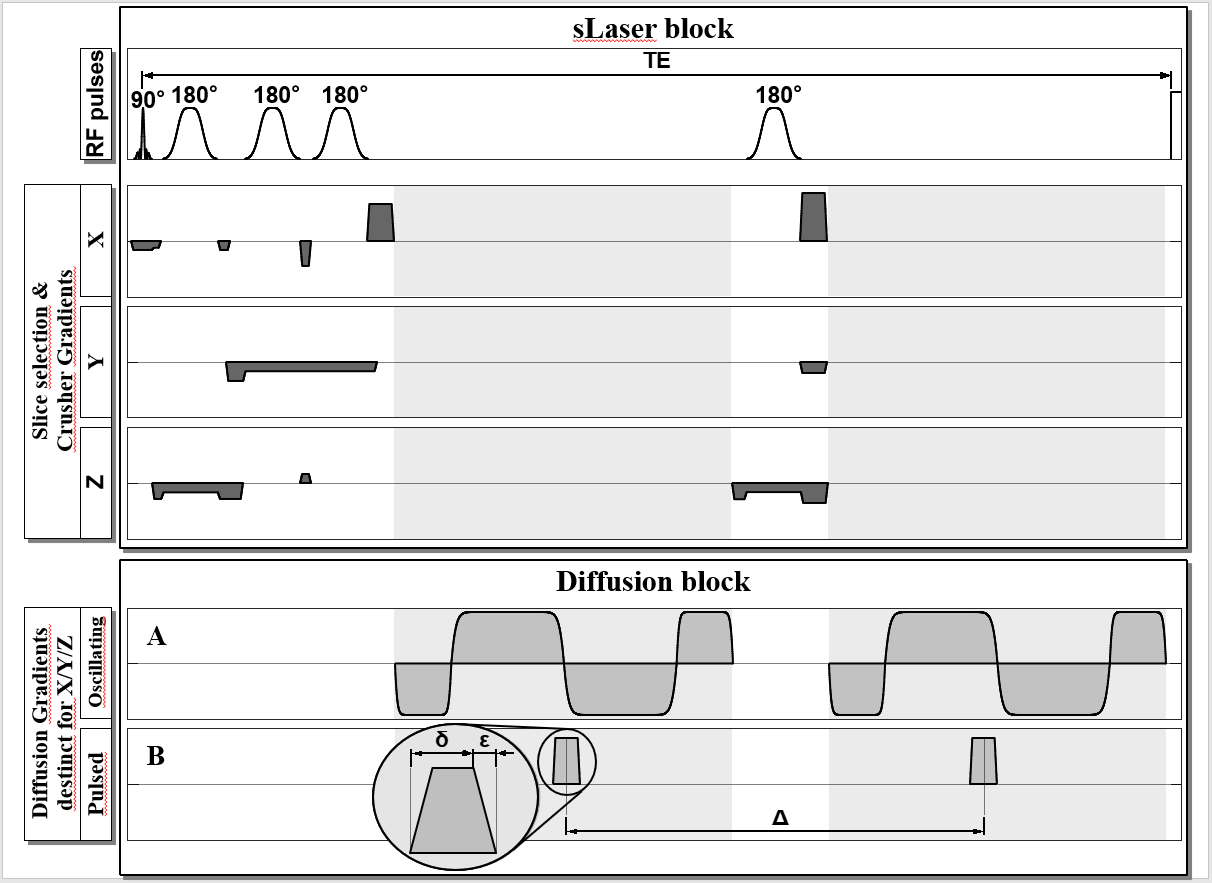
Schematic diagram of the semi-Laser sequence used with two alternatives for imprinting diffusion-weighting along individual or multiple spatial directions. The oscillating diffusion gradient shape formed by modified cosine oscillations including a stretching exponent is shown in A). The effective diffusion time (derived from the gradient modulation spectrum) can be chosen within allowed limits of slew rate and stimulation thresholds (see Ref. 11). The pulsed trapezoidal gradients shown in B) are arranged symmetrically around the last adiabatic 180° pulse with an effective diffusion time TD=(Δ-δ/3).
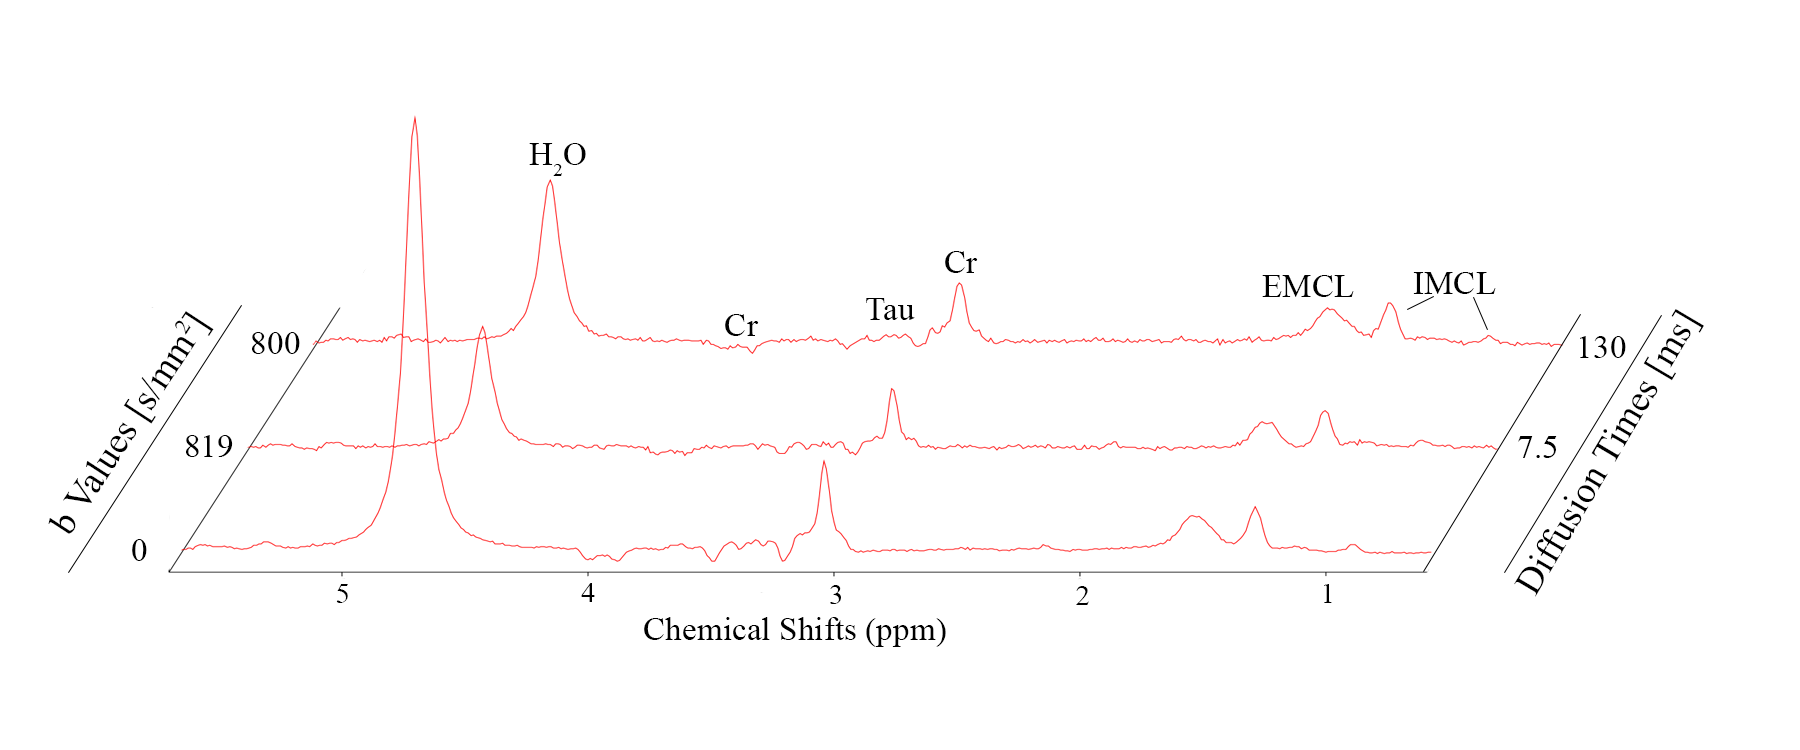
Fig. 2: Spectra illustrating quality in single scans (48 acquisitions) of tibialis anterior with diffusion-weighting of $$$b=$$$800 s/mm2 along one direction perpendicular to fibers. Spectra contain resonances from water (unsuppressed, strong T2-weighting), creatine/phosphocreatine (dipolar-split peaks; triplet: 3ppm; negative doublet: 3.9ppm), taurine (mostly negative peak-pattern at 3.2-3.5ppm due to J- and dipolar coupling), Intra- (IMCL) and Extra-Cellular Lipids (EMCL) with main peaks at 0.9, 1.3, 5.3ppm for IMCL and shifted by ~0.2ppm for EMCL.
Top: pulsed gradients (TD=130 ms, δ=10 ms, G=29.7 mT/m)
Middle: oscillating gradients (TD=7.5 ms11, G=41.3 mT/m)
Bottom: average of 5 scans without additional diffusion weighting.
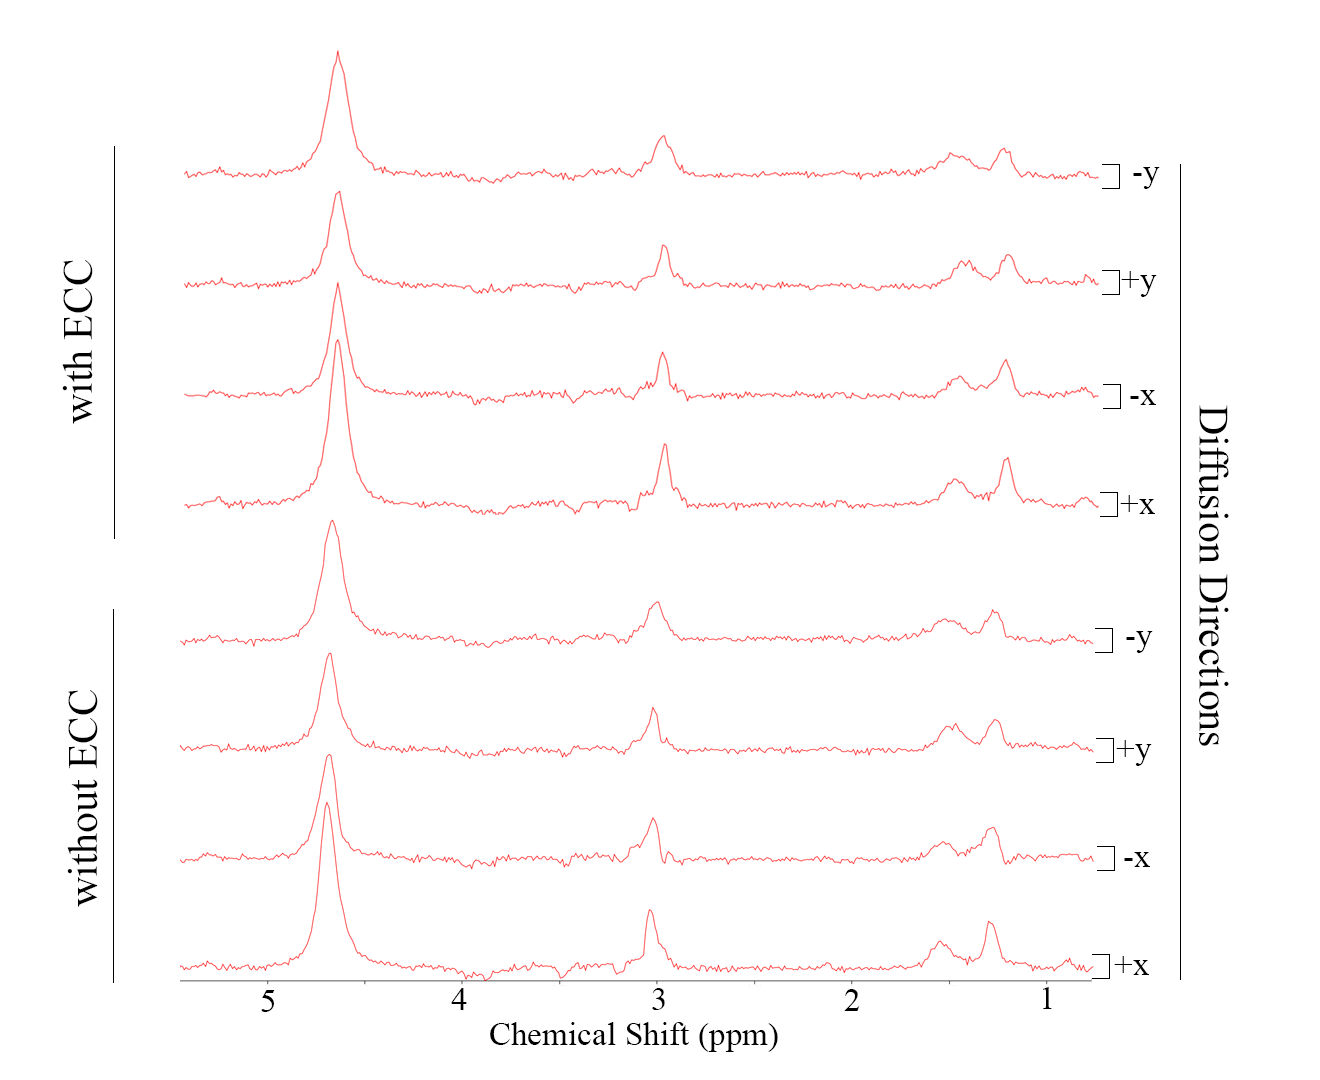
Fig. 3: Sample spectra illustrating resulting spectra when applying the diffusion-weighting along different directions. The lower half shows raw spectra contaminated by eddy-current artifacts that vary according to diffusion direction (x/y; negative/positive amplitude, particularly evident from the lineshape distortion of the main creatine resonance at 3ppm). Equivalent changes are seen for water and IMCL motivating the use of A) reference lineshapes defined from the water peak and B) reference amplitude taken from the IMCL peak that is not diffusion-weighted in area because of close-to-zero ADC. The upper part illustrates eddy-current-correction using the fitted water line.