4229
Characterization of downfield spectra using iRE-MRSSonia Isabel Goncalves1, Clémence Ligneul1, and Noam Shemesh1
1Champalimaud Neuroscience Programme, Champalimaud Centre for the Unknown, Lisbon PT, Lisbon, Portugal
Synopsis
About half of the proton spectrum (downfield of water) has been nearly ignored over the decades of MRS application due to water suppression. We show that ISIS-based Relaxation Enhanced MRS (iRE-MRS) which uses frequency selective excitation and ISIS localization offers short echo times and enhances exchange-broadened resonances. We take advantage of this to characterize the relaxation properties of downfield spectral peaks.
Synopsis
MRS allows non-invasive in-vivo exploration of tissue metabolism. However,about half of the proton spectrum (downfield of water) has been nearly ignored over the decades of MRS application due to water suppression.We show that ISIS-based Relaxation Enhanced MRS (iRE-MRS) which uses frequency selective excitation and ISIS localization offers short echo times and enhances exchange-broadened resonances.We measure the T1s and calculate signal decay due to T2 relaxation and find that downfield peaks show a signal decrease of more than 50% when increasing TE from 5 to only 16 ms.Calculated T1 values are in the range of 1.55-1.75 s.Introduction
Downfield magnetic resonance spectroscopy (MRS) has received little attention due to the difficulty in detecting resonances,mostly originating from labile protons.In fact,few studies with high dynamic range MRS [1-4] or Relaxation-Enhanced MRS [5] (RE-MRS),focused on downfield spectra.A recent new method,termed iRE-MRS [6] combines RE-MRS with ISIS localization [7] in the aim of obtaining downfield spectra at TEs as short as 5 ms – an important attribute given the rapidly exchanging signals downfield.Here,we use iRE-MRS to measure T1 and T2 relaxation effects of multiple downfield resonances in-vivo,at 9.4 T.Methods
Animal experiments were preapproved by the institutional and national authorities and carried out according to European Directive 2010/63. Experiments were carried out on N=6 Long-Evans female rats weighting 250, aged ~3 months.Pulse sequence design.Figure 1 illustrates the iRE-MRS pulse sequence.It is based on spectrally-selective excitation and refocusing, avoiding water suppression [5]. However,unlike the previous RE-MRS studies, localization is achieved by an ISIS block,consisting of three spatially-selective adiabatic inversions.OVS modules were implemented to improve localization quality. For T1 measurements,an additional inversion-recovery (IR) module,consisting of a non-selective adiabatic inversion followed by spoiler gradients,was added.Spectrally-selective RF pulses.The spectrally-selective RF pulses were generated by the shape algorithm implemented in Paravision 6.0.1 (Bruker Biospin,Ettlingen,Germany),which employs the Shinar LeRoux algorithm [8].Excitation and refocusing pulses were centered at 9.5 ppm,having a bandwidth of 6.5 ppm.MRS experiments.All experiments were performed using a 9.4 T horizontal bore scanner (Bruker-Biospin, Karlsruhe, Germany), equipped with an 86 mm coil for transmission and a 4-element array cryocoil (Bruker BioSpin, Fallanden, Switzerland) for signal reception. iRE MRS spectra were obtained in a centrally-positioned 6.0×2.5×3.5 mm3 voxel, including cortex and caudate-putamen.Experiments were executed using the following common acquisition parameters:TR=15000 ms (>>5T1 of metabolites),8 steps per ISIS cycle,8 repetitions (cycles) per experiment,spectral width 5597.01 Hz,spectral resolution 1.94Hz/point.T2 relaxation.Data were acquired (N=3 rats) for three TEs: 5, 16 and 40 ms. T1 measurement.Data were acquired (N=3 rats) for the following TIs (measured from the adiabatic inversion in IR module to the frequency selective excitation): 148, 238, 468, 578, 798, 1118, 2538, 4138, 6138, 14538 ms.Post-processing.Each FID (ISIS cycle) was Fourier transformed, the resulting spectra were individually rephased and then averaged over the total number of repetitions for each scan.Apodization with an exponential factor of 15 Hz-width.T1 data were fitted to function M(TI)=M0(1-2e-TI/T1) using non-linear regression.Average T1 values,weighted by the fit residuals,were calculated.For T2 relaxation quantification,the relative signal decrease with respect to TE=5 ms was calculated for all peaks and averaged over animals.Results
Figure 2 shows illustrative data obtained for T2 and T1 measurements.In figure 2a,in addition to NAA,multiple other spectral peaks (a,b,c,d,e and f) are detected between 6.8 and 8.5 ppm.Figure 3 depicts typical data points and fit results (peak e) for the 3 animals that were used for T1 measurement.Table 1 shows the average T1 values are larger than 1.55 s and smaller than 1.75 s.The T2 signal decay (Table 2),with the exception of NAA,is larger than 50% when increasing TE from 5 to as little as 16 ms,which explains their detection sensitivity to TE lengthening,as previously reported in [1].Discussion
With the exception of NAA,all downfield peaks are dramatically attenuated with TE lengthening.In fact,changing TE from 5 to only 16 ms leads to a decrease in signal intensity of 50 to 65%,being barely undetectable for TE=40 ms.It is thus very important to densely sample very short TEs in order to correctly recover the T2 decay curve of these species.T1 estimations are longer than what has been reported before [6, 9].Two reasons for this might be that we have sampled the IR recovery curve considering a longer maximum TI value (14,5 s against 6 s in [9]) and that T1s are biased to longer values due to exchange with water.Further research,calculating both T1 and exchange rate values in a unified model and/or using multi-exponential models,is needed to disentangle these effects.Conclusions
Downfield spectral peaks show large T2 relaxation effects already at TEs as short as 16ms.From here it results that performing downfield MRS at short TE (< 10 ms) is of paramount importance to detect these peaks.T1 values appear longer than previously reported.Acknowledgements
No acknowledgement found.References
[1] Gonçalves and Shemesh, ISMRM 2018; [2] Piotto et al., J. Biomol. NMR, 2, 661-665, 1992; [3] Dreher and Leibfritz, Magn. Res. Med., 54, 190-195, 2005. [4] MacMillan et al., 65, 1239-1246, 2011; [5] MacMillan et al., 70, 916-924, 2013; [6] Shemesh et al., Nat Commun, doi: 10.1038/ncomms5958, 2014; [7] Ordidge et al., J. Magn. Res., 66, 283, 1986; [8] Pauly et al., IEEE Trans. Med. Imaging, 10, 53-65, 1991; [9] Fichtner et al. Magn. Res. Med., 78, 11-19, 2017.Figures
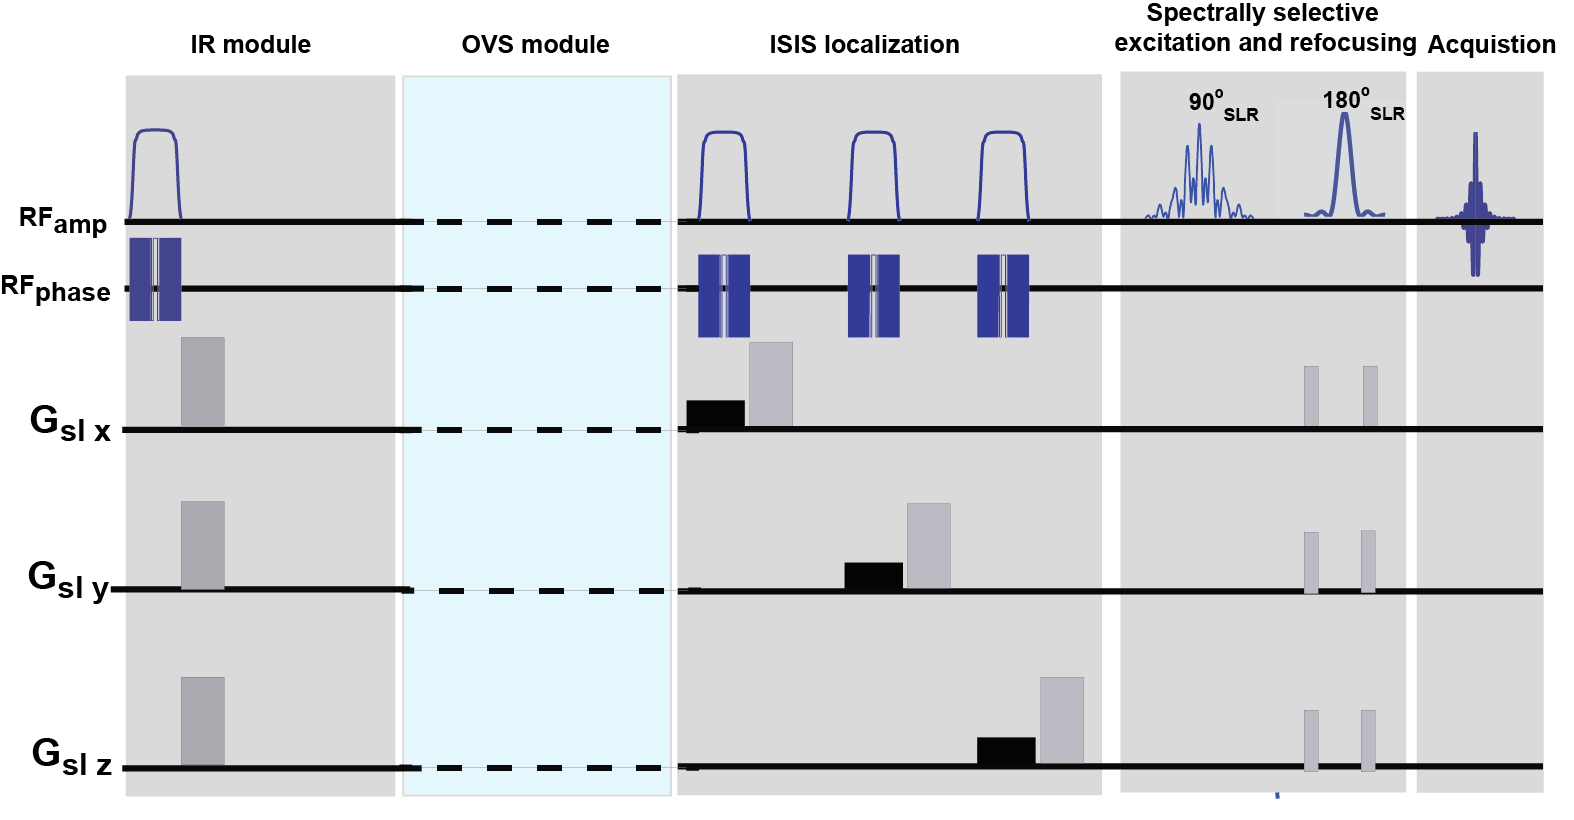
Figure 1.
Pulse sequence diagram.
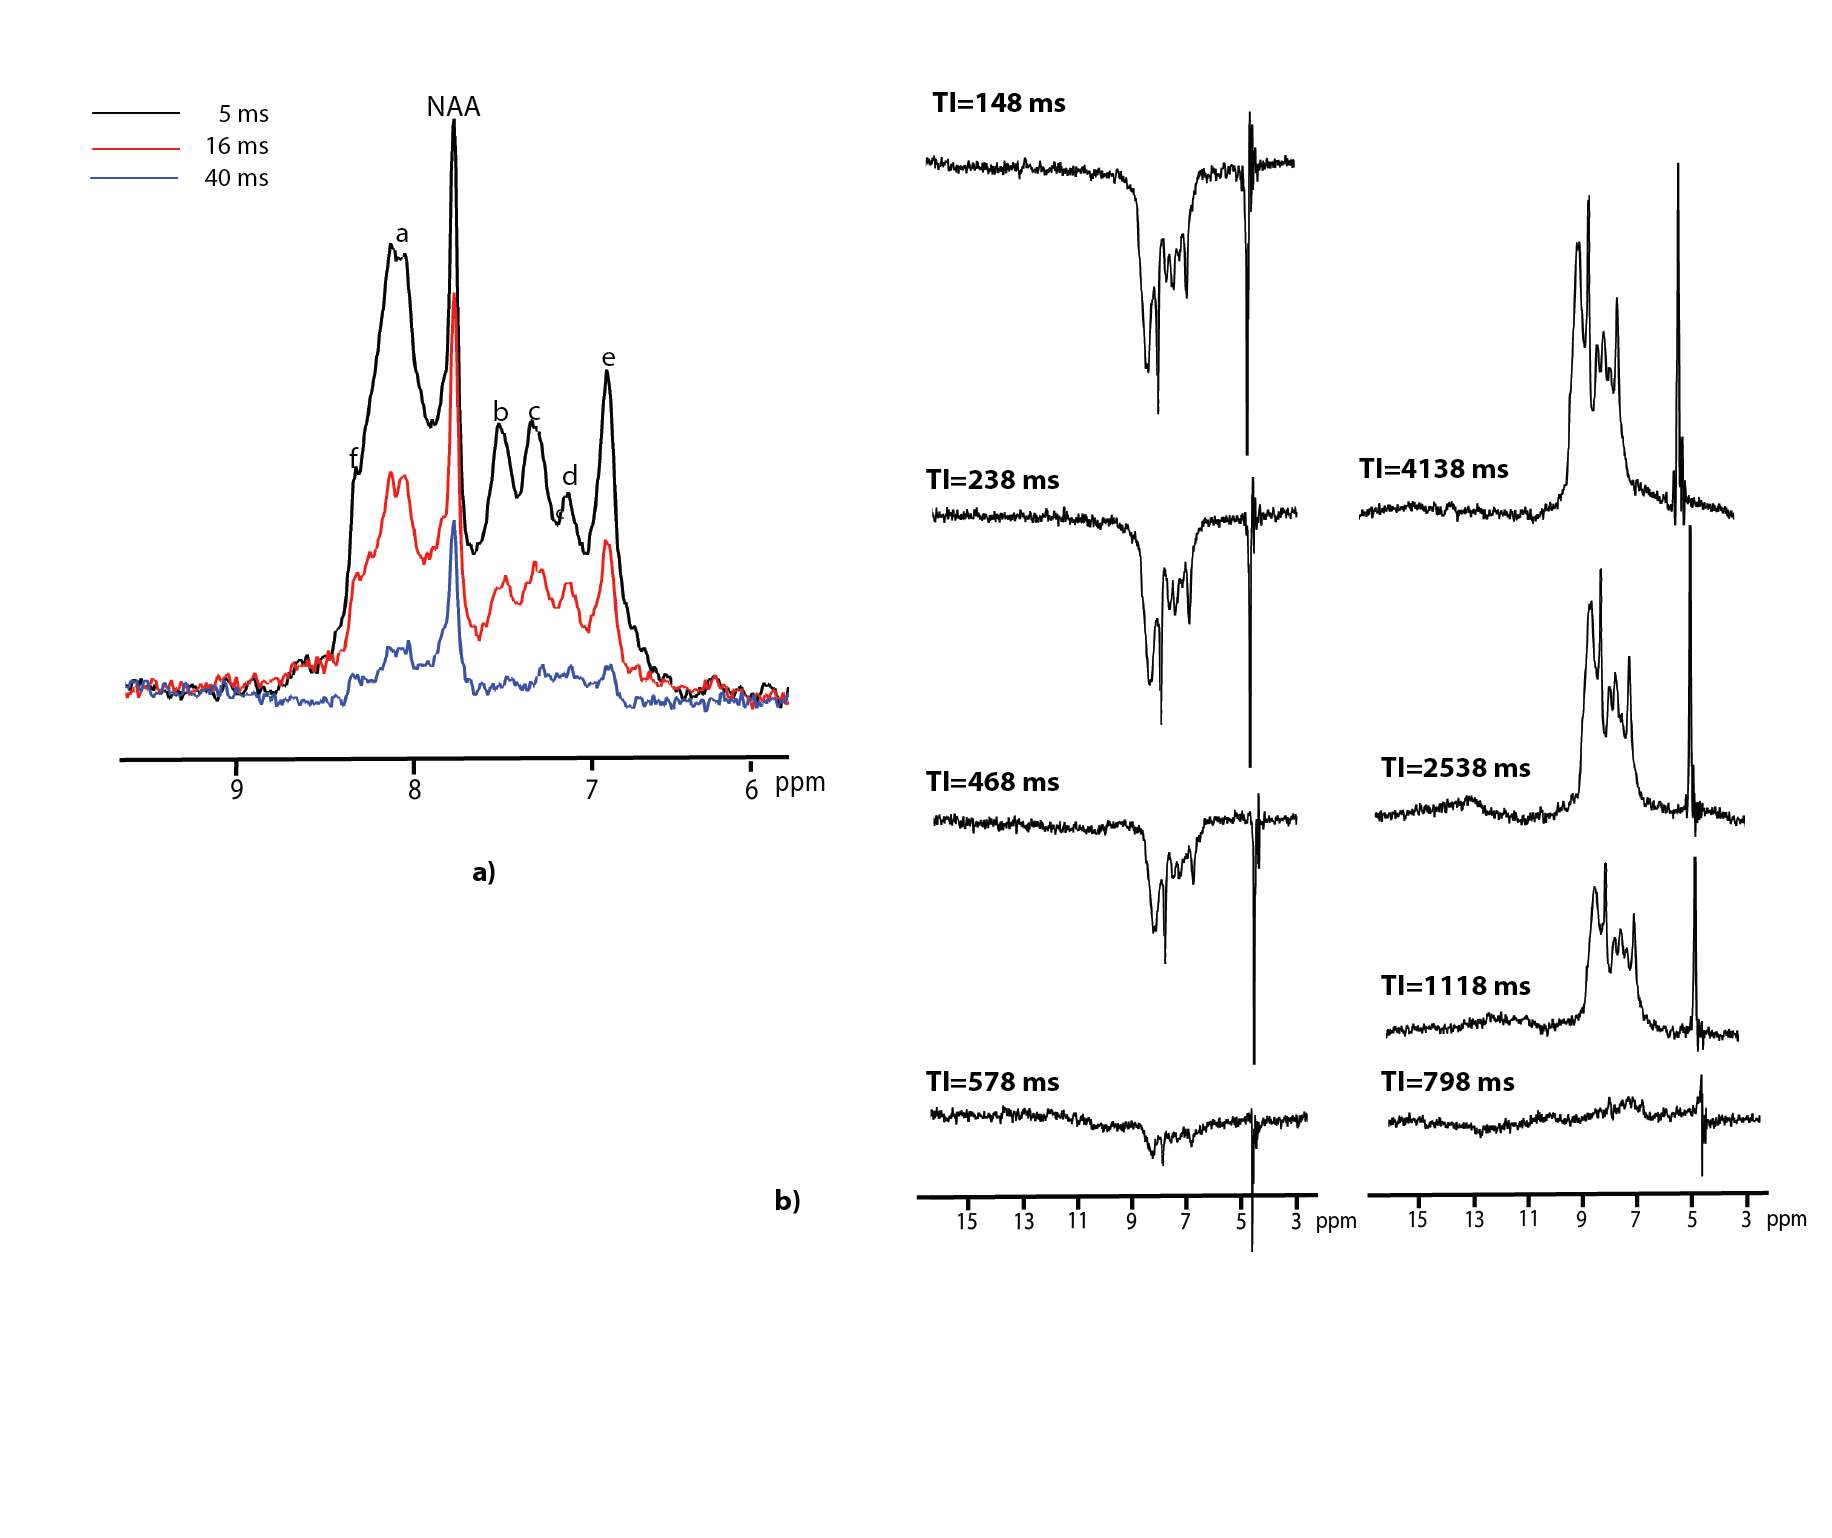
Figure 2. Illustrative spectra
obtained for varying TEs and TIs. a) Downfield spectra obtained (in one animal)
for 3 different TEs. In addition to the NAA peak, multiple other reference
peaks were identified as a, b, c,
d, e and k. b) Downfield
spectra obtained (in one animal) for various TIs.

Figure 3. Illustrative
data points and T1 fit results obtained for spectral peak e. Each color represents one animal.
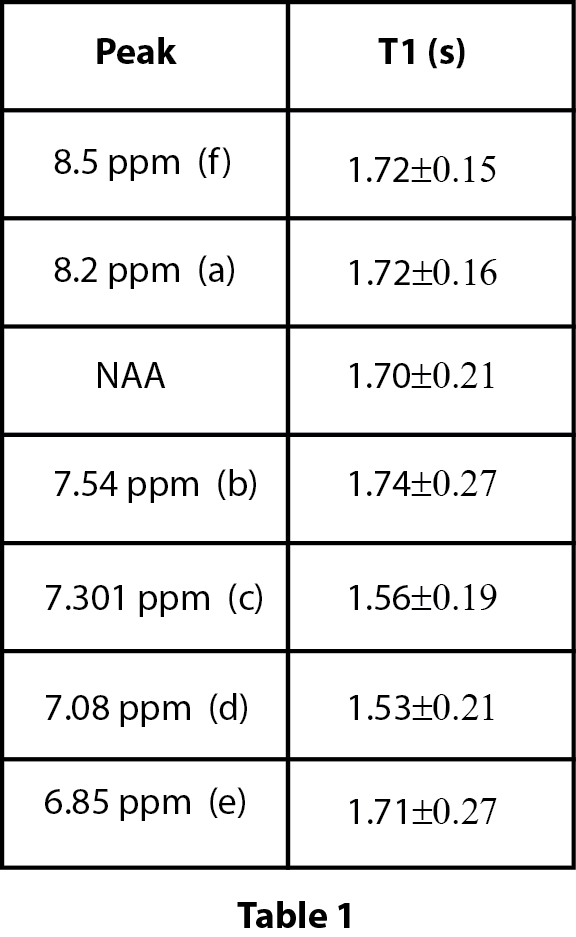
Table 1. Average T1 values for
the reference spectral peaks.

Table 2. Average
signal decays due to T2 relaxation for the reference spectral peaks.